Copyright
©The Author(s) 2015.
World J Orthop. Mar 18, 2015; 6(2): 221-235
Published online Mar 18, 2015. doi: 10.5312/wjo.v6.i2.221
Published online Mar 18, 2015. doi: 10.5312/wjo.v6.i2.221
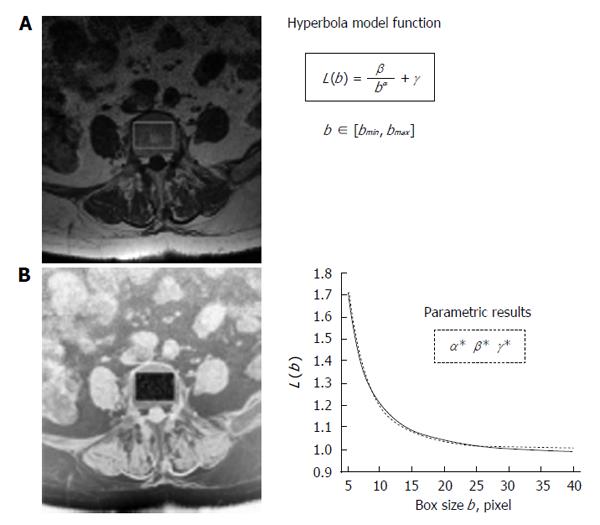
Figure 1 Schematic representation of fractal lacunarity analysis.
A: 1.5 T MRI spin-echo image (512 × 512 pixel, pixel size equal to 0.469 mm) of fifth axial section of lumbar vertebra; B: Rectangular ROI within the inner perimeter of vertebral body in a intermediate step of binarization procedure on the reverse gray-scale image. The plot (right bottom) represents the result of gliding box algorithm application (dotted line) as fitted by hyperbola function (solid line) used to calculate the triplet of parameters α, β, γ. MRI: Magnetic resonance imaging; ROI: Region of interest.
Figure 2 Representation of sigmoid function for different choices of parameters k, σ.
A: Sigmoid graph obtained by varying values of parameter k; B: Graph obtained by varying values of parameter σ. This new pre-processing step prescribes to consider image J, in place of image I, where the pixels are defined as follows: J(i, j) = 1/1 + esp(-k (I(I,j) - σ), i = 1,2,…M, j = 1,2,…N, and k, σ > 0 are two given parameters. Note that the procedure goes toward a complete binarization by increasing parameter k, related to sigmoid rectangularization.
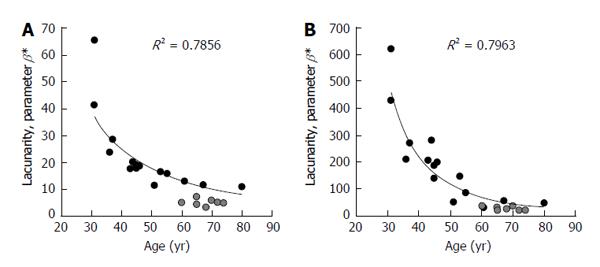
Figure 3 Representation of trabecular bone architecture changes with aging and osteoporosis from lacunarity texture analysis on binary and gray-scale images.
Results are expressed as parameter β calculated on the same set of original images with two different software prototype versions: A: On binary images after a pre-processing step in a different computational environment; B: Directly applied to original gray-scale images. Black circles represent TBA lacunarity in non-osteoporotic subjects of different age. Gray circles represent TBA in osteoporosis (BMD-based diagnosis). Decreasing values of parameter β correspond to increasing lacunarity related to a higher microarchitecture deterioration. TBA: Trabecular bone architecture; BMD: Bone mineral density.
Figure 4 Effect of sample size on trabecular bone architecture changes with aging and osteoporosis.
Results are expressed as parameter β calculated from lacunarity texture analysis with gray-scale version 2 of the method. Larger sample size (B) of 59 subjects comprises the smaller one (A). Black circles represent TBA lacunarity in non-osteoporotic subjects of different age. Gray circles represent TBA in osteoporosis (BMD-based diagnosis). Decreasing values of parameter β correspond to increasing lacunarity related to a higher microarchitecture deterioration. Overlapping of data from osteoporotic and “healthy” subjects (BMD-based diagnosis) stresses that TBA represents a determinant of bone fragility independent on BMD. TBA: Trabecular bone architecture; BMD: Bone mineral density.
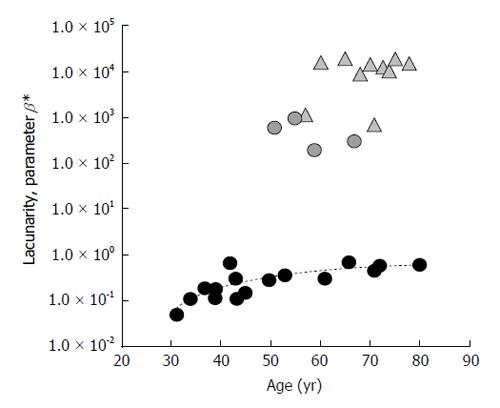
Figure 5 Results from trabecular bone architecture texture lacunarity analysis of magnetic resonance images with version 3 of the method.
Lacunarity of TBA from 30 subjects differing in age and physio-pathologic status is expressed by parameter β. Circles: age-related alteration of TBA in “healthy” subjects; Triangles: pathologic-related changes of TBA in osteoporotic BMD-based diagnosis subjects. Parameter β values directly correlate with fracture risk. TBA: Trabecular bone architecture; BMD: Bone mineral density.
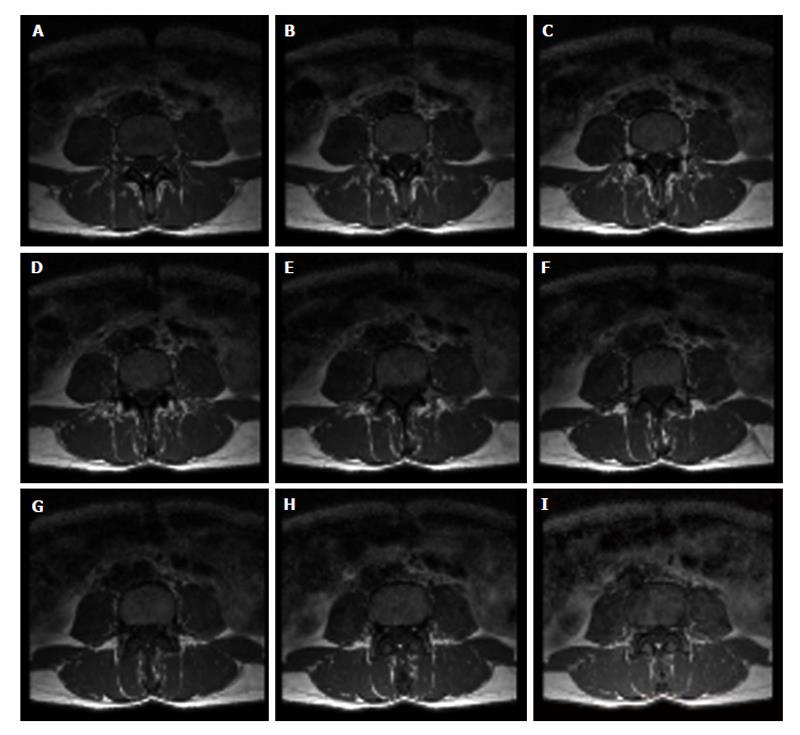
Figure 6 Set of images from magnetic resonance imaging spin-echo.
Nine axial images of the fourth lumbar vertebra obtained by magnetic resonance imaging multislice technique. Acquisition of the set of axial images of vertebral body to visualize the inner trabecular bone portion is performed from bottom (A: lower base) to top (I: upper base).
Figure 7 Schematic representation of the pre-processing step of magnetic resonance images with image J program used in trabecular bone architecture lacunarity analysis method-version1.
Reverse grey-scale display of original images is used to ease visualization of trabecular network, a rectangular ROI is chosen as large as possible to fit the inner perimeter of trabecular bone. The boundary between cortical bone and soft-tissue background is defined by using an automatic contour detection algorithm. Trabecular bone is then extracted from bone marrow by using a Gaussian filter. This scheme generates a binary representation of the trabecular structure in which the dark regions represent bone marrow and the light regions represent bone. The Gaussian filter is applied first to the original ROI image and then to the thresholding one. The two resulting binary images are finally combined. ROI: Region of interest.
Math 1 Math(A1).
Math 2 Math(A1).
Math 3 Math(A1).
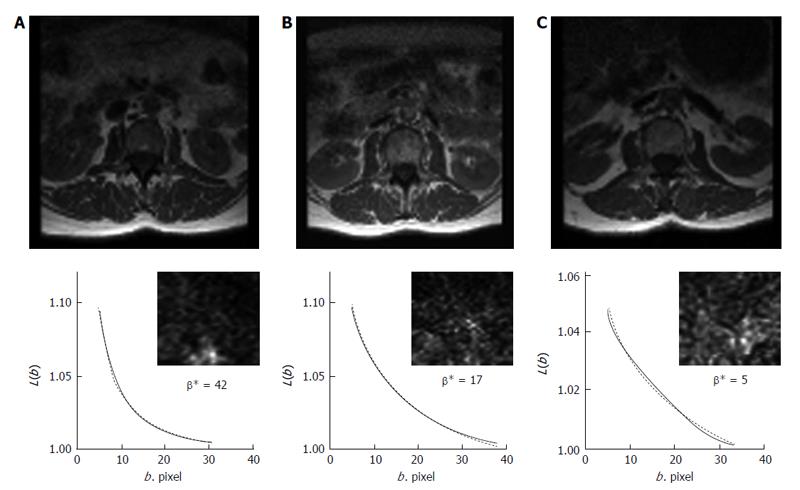
Figure 8 Example of results from lacunarity analysis of three types of trabecular bone different for age and healthy status.
In the related plots, dotted lines represent the fitted hyperbola function. Goodness of the fitting represented by a almost complete overlapping of both theoric and experimental curve indicates that parametric lacunarity analysis by hyperbola model function is a proper choice. A: Young, 39s; B: Menopause, 53s; C: Osteoporosis, 74s.
- Citation: Zaia A. Fractal lacunarity of trabecular bone and magnetic resonance imaging: New perspectives for osteoporotic fracture risk assessment. World J Orthop 2015; 6(2): 221-235
- URL: https://www.wjgnet.com/2218-5836/full/v6/i2/221.htm
- DOI: https://dx.doi.org/10.5312/wjo.v6.i2.221


