Copyright
©The Author(s) 2015.
World J Orthop. Dec 18, 2015; 6(11): 944-953
Published online Dec 18, 2015. doi: 10.5312/wjo.v6.i11.944
Published online Dec 18, 2015. doi: 10.5312/wjo.v6.i11.944
Figure 1 Weight-bearing radiographs [lateral (A), anterior-posterior mortise (B), and 4-cm heel-rise (C) views] showing an osteochondral defect (arrows).
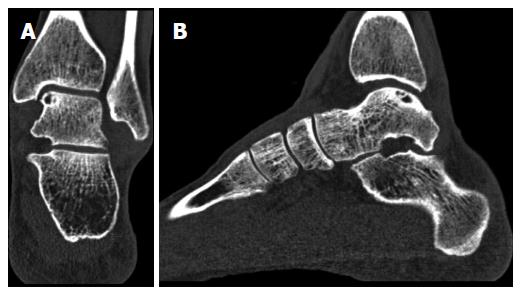
Figure 2 Coronal (A) and sagittal (B) computed tomography scans of a left ankle, showing an osteochondral defect of the posteromedial talar dome.
Note the clear visualization of the cyst with an intact subchondral bone plate.
Figure 3 Magnetic resonance imaging scans of coronal T1 (A) and T2 (B) and bone edema on a T2 image (C).
Coronal T1 (A) and T2 (B) magnetic resonance imaging scans of a right ankle with an osteochondral lesion of the medial talar dome. Note that the extent of the bony defect is difficult to assess precisely due to the bone edema on a T2 image (C).
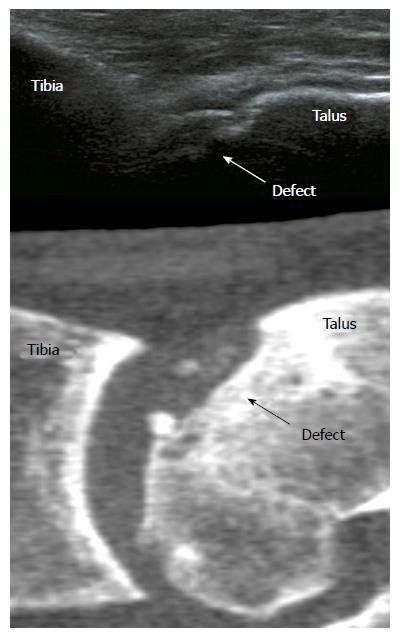
Figure 4 Ultrasound image (top) showing an osteochondral talar defect.
A computed tomography scan (bottom) is shown for comparison.
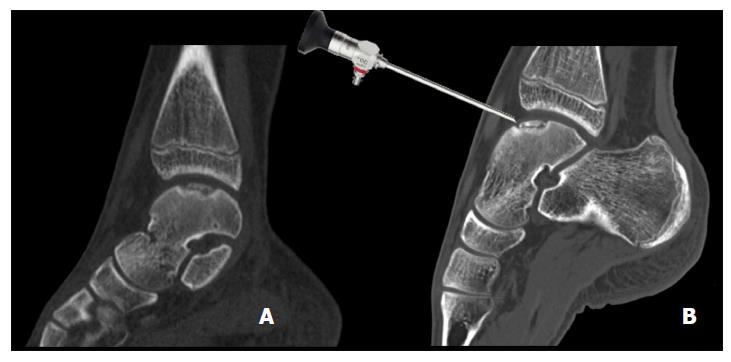
Figure 5 Sagittal computed tomography images of a 14-year-old patient with an osteochondral defect of the medial talar dome.
Normal helical CT (A) and a CT made in full plantar flexion (B) showing arthroscopic accessibility. CT: Computed tomography.
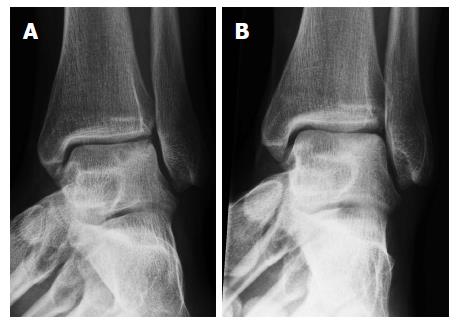
Figure 6 Radiograph of a left ankle with an ostechondral defect in the lateral talar dome, preoperative (A) and postoperative (B).
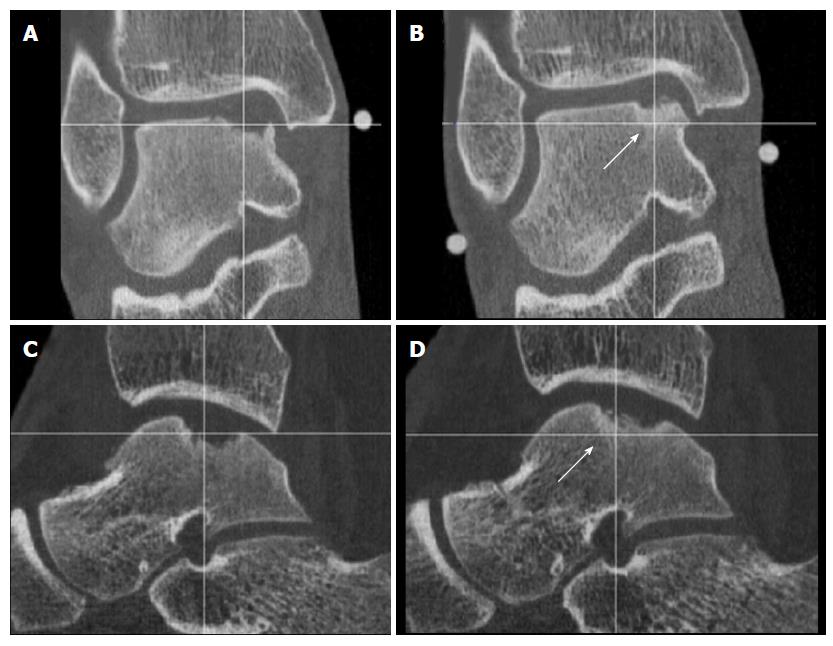
Figure 7 Coronal (A) and Sagittal (C) computed tomography-scans obtained 2 wk postoperatively, showing a medial osteochondral defect of the talus treated with arthroscopic debridement and microfracturing, these can be compared with 1-year postoperative computed tomography scans (B, D).
Note the partial bony ingrowth of the defect.
- Citation: Bergen CJV, Gerards RM, Opdam KT, Terra MP, Kerkhoffs GM. Diagnosing, planning and evaluating osteochondral ankle defects with imaging modalities. World J Orthop 2015; 6(11): 944-953
- URL: https://www.wjgnet.com/2218-5836/full/v6/i11/944.htm
- DOI: https://dx.doi.org/10.5312/wjo.v6.i11.944


