Copyright
©2014 Baishideng Publishing Group Inc.
World J Orthop. Nov 18, 2014; 5(5): 574-584
Published online Nov 18, 2014. doi: 10.5312/wjo.v5.i5.574
Published online Nov 18, 2014. doi: 10.5312/wjo.v5.i5.574
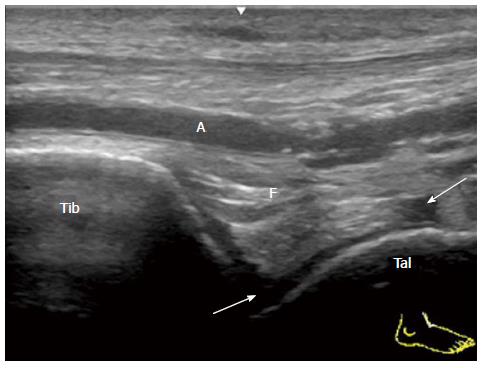
Figure 1 Mild tibiotalar joint synovitis in reactive arthritis.
Sagittal grey-scale sonogram of the anterior recess of the tibiotalar joint shows localized anechoic synovial effusion (arrow). Tib: Tibia; Tal: Talus; F: Fat pad; A: Dorsalis pedis artery.
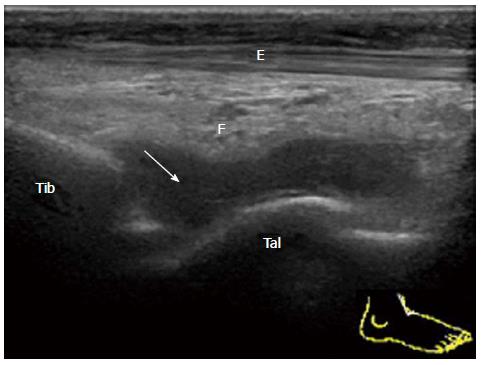
Figure 2 Severe tibiotalar joint synovitis in rheumatoid arthritis.
Sagittal grey-scale sonogram of the anterior recess of the tibiotalar joint shows that a normal hyperechoic anterior fat pad (F) is displaced anteriorly by hypoechoic synovium (arrow). Tib: Tibia; Tal: Talus; F: Fat pad; E: Extensor hallucis longus.
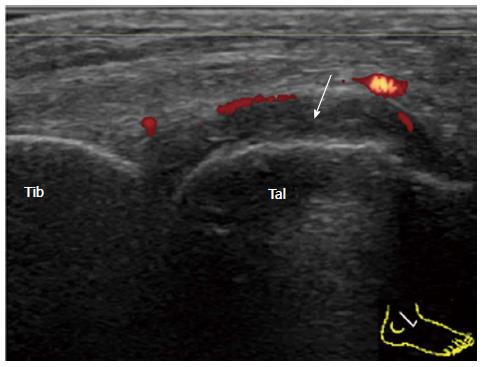
Figure 3 Synovial proliferation in rheumatoid arthritis.
Sagittal power Doppler sonogram of the lateral side of the anterior recess of the tibiotalar joint shows synovial thickening (arrow) with peripheral vascularization. Tib: Tibia; Tal: Talus.
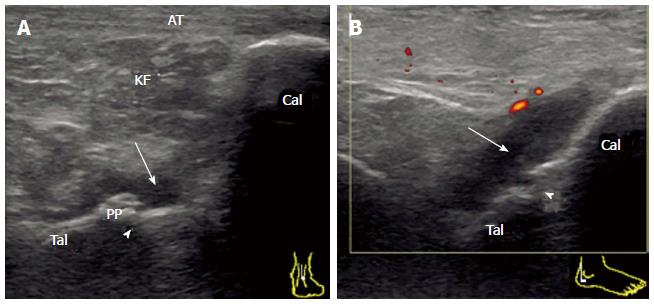
Figure 4 Synovitis of the posterior subtalar joint in rheumatoid arthritis.
A: Sagittal grey-scale sonogram crossing the posterior talar process shows the edge of the distended posterior recess (arrow) of the PSTJ. B: Posterolateral view of the power Doppler sonogram fully depicting the distended posterior recess (arrow) of the PSTJ. Note the close relation of this recess with the superior margin of the calcaneus (Cal). Tib: Tibia; Tal: Talus; KF: Kager’s fat pad; AT: Achilles tendon, arrowhead (joint space); PSTJ: Posterior subtalar joint; PP: Posterior talar process.
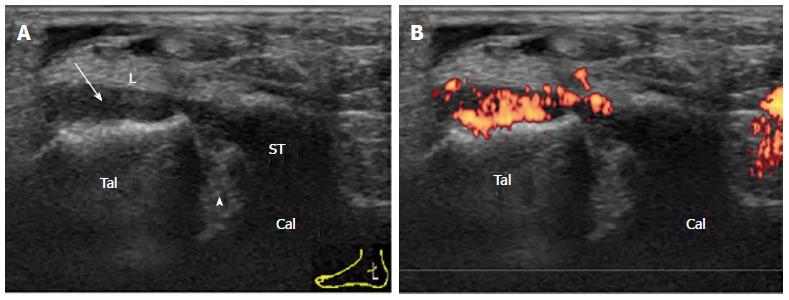
Figure 5 Synovitis of the posterior subtalar joint in rheumatoid arthritis.
Coronal grey-scale (A) and power Doppler (B) sonogram of the medial facet (arrowhead) of the PSTJ. PD-signal-positive proliferated synovium (arrow) of the PSTJ stretches cranially along the tibiocalcaneal ligament (L). Tal: Talus; Cal: Calcaneus; ST: Sustentaculum tali; PSTJ: Posterior subtalar joint.
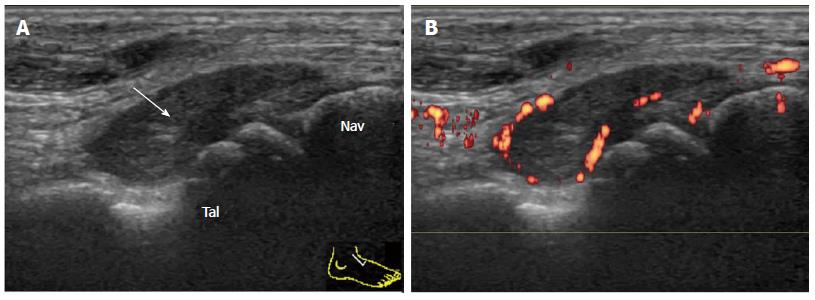
Figure 6 Synovitis of the talonavicular joint in rheumatoid arthritis.
Longitudinal grey-scale (A) and power Doppler (B) sonogram of the dorsal aspect of the TNJ shows marked synovial thickening (arrow) with peripheral vascularization. Tal: Talus; Nav: Navicular; TNJ: Talonavicular joint.
Figure 7 Synovitis of the talonavicular joint in psoriatic arthritis.
Longitudinal power Doppler sonogram of the dorsal aspect of the TNJ shows synovial effusion and marked synovial thickening (arrow) with peripheral vascularization. TNJ: Talonavicular joint; Tal: Talus; Nav: navicular.
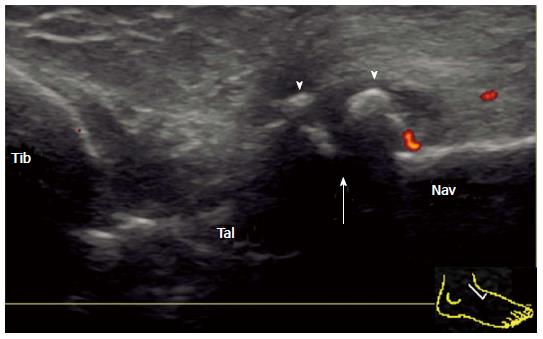
Figure 8 Deformity of the talonavicular joint in rheumatoid arthritis.
Longitudinal power Doppler sonogram of the dorsal aspect of the TNJ shows joint space narrowing (arrow) and osteophyte formation (arrowhead) with minimum flow signal adjacent to an osteophyte. TNJ: Talonavicular joint; Tib: Tibia; Tal: Talus; Nav: Navicular.
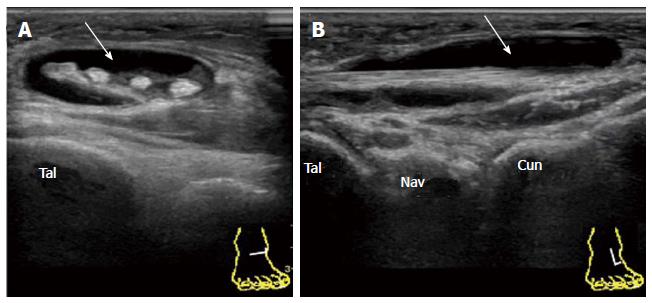
Figure 9 Serous tenosynovitis of the extensor digitorum longus in rheumatoid arthritis.
Transverse (A) and longitudinal (B) grey-scale sonogram of the dorsal aspect of the EDL shows marked expansion of the tendon sheath with anechoic synovial effusion (arrow). Tal: Talus; Nav: Navicular; Cun: Cuneiform; EDL: Extensor digitorum longus.
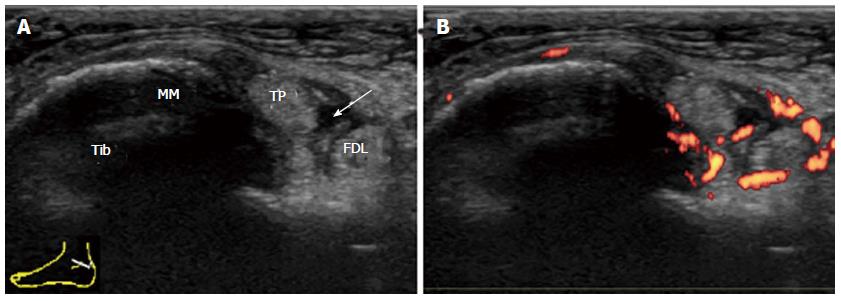
Figure 10 Proliferative tenosynovitis of the tibialis posterior in rheumatoid arthritis.
A: Transverse grey-scale sonogram through the medial ankle at the level of the medial malleolus (MM). Hypoechoicthickened tenosynovium of the TP with anechoic effusion (arrow) within the sheath is depicted; B: Power Doppler sonogram shows hyperemia of the tenosynovium surrounding the TP and the FDL. Tib: Tibia; TP: Tibialis posterior; MM: Medial malleolus; FDL: Flexor digitorum longus.
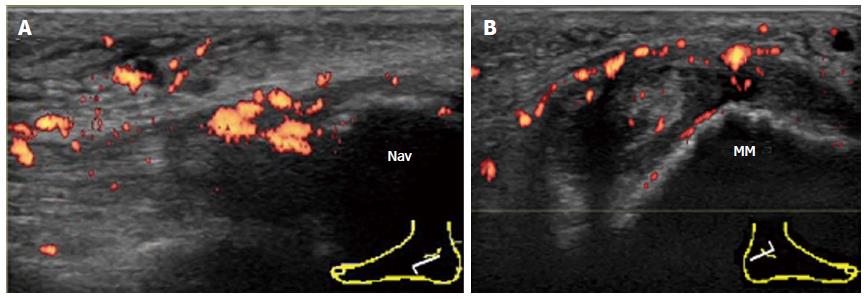
Figure 11 Involvement of the tibialis posterior tendon in psoriatic arthritis.
A: Enthesitis of the TP at the navicular insertion in psoriatic arthritis. Longitudinal power Doppler sonogram of TP shows intratendinous hypoechoic change and loss of the fibrillar echoes with hyperemia adjacent to the insertion into thenavicular bone. Cortical irregularities of the navicular bone at the insertion are also depicted; B: Tenosynovitis of the contralateral TP in the same patient. Transverse power Doppler sonogram at the level of the tip of the medial malleolus shows thickening and hyperemia of both the tendon sheath and the flexor retinaculum. Cortical irregularities of the medial malleolus are also depicted. Nav: Navicular bone; MM: Medial malleolus; TP: Tibialis posterior.
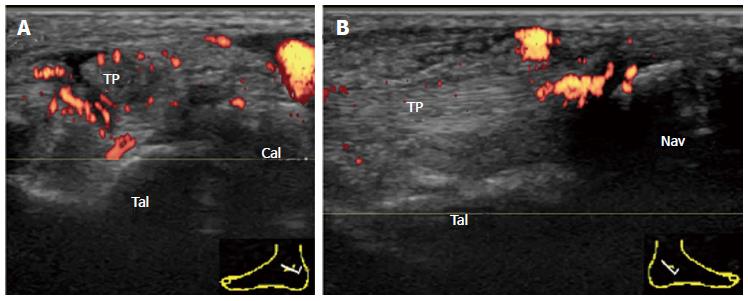
Figure 12 Involvement of the tibialis posterior tendon in systemic lupuserythematosus.
A: Tenosynovitis of the TP in systemic lupus erythematosus. Transverse power Doppler sonogram over the inframalleolar area shows thickening and hyperemia of the tendon sheath with small synovial effusion; B: Enthesitis of the contralateral TP in the same patient. Longitudinal power Doppler sonogram of the TP shows intratendinous hyperemia adjacent to the insertion into the navicular bone. Tal: Talus; Cal: Calcaneus; TP: Tibialis posterior; Nav: Navicular bone.
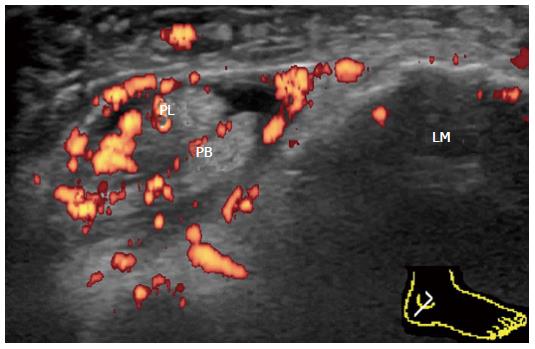
Figure 13 Proliferative tenosynovitis of the peroneus longus and brevis in rheumatoid arthritis.
Transverse power Doppler sonogram through the lateral ankle at the level of the lateral malleolus shows thickening and marked hyperemia of the tenosynovium surrounding the peroneus longus and peroneus brevis. PL: Peroneus longus; PB: Peroneus brevis; LM: Lateral malleolus.
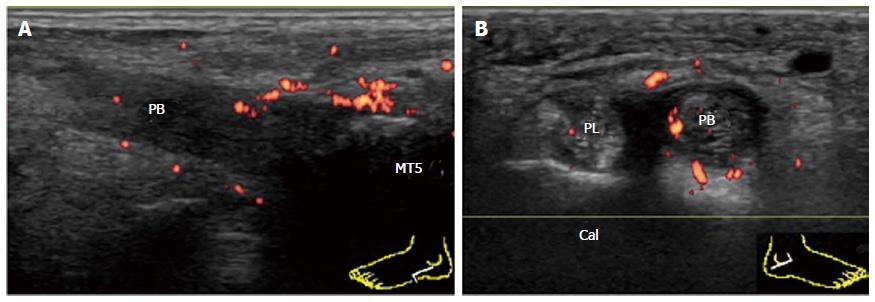
Figure 14 Involvement of peroneal brevis tendon in psoriatic arthritis.
A: Enthesitis of the PB in psoriatic arthritis. Longitudinal power Doppler sonogram of the PB shows intratendinous hypoechoic change and loss of the fibrillar echoes with hyperemia adjacent to the insertion into the base of MT5. Cortical irregularities of the bone at the insertion are also depicted; B: Tenosynovitis of the contralateral PB in the same patient. Transverse power Doppler sonogram at the level of the peroneal tubercle of the Cal shows thickening and hyperemia of the PB tendon sheath. PL: Peroneus longus; PB: Peroneus brevis; MT5: The fifth metatarsal bone; Cal: Calcaneus.
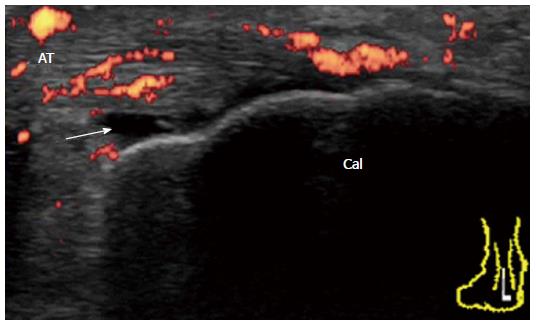
Figure 15 Achilles tendon enthesitis in reactive arthritis.
Longitudinal power Doppler sonogram of the AT shows enthesial and intratendinous hyperemia and a small amount of fluid in retrocalcaneal bursa (arrow) with minimal cortical irregularities and tendinosis. Cal: Calcaneus; AT: Achilles tendon.
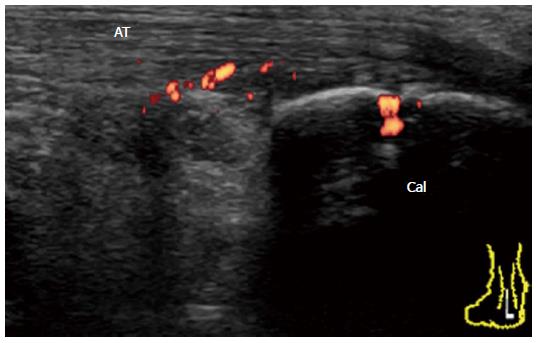
Figure 16 Achilles tendon enthesitis in early undifferentiated spondyloarthritis.
Longitudinal power Doppler sonogram of the AT shows abnormal vascularization at the enthesis insertion into the calcaneal bone with minimal tendinosis. Cal: Calcaneus; AT: Achilles tendon.
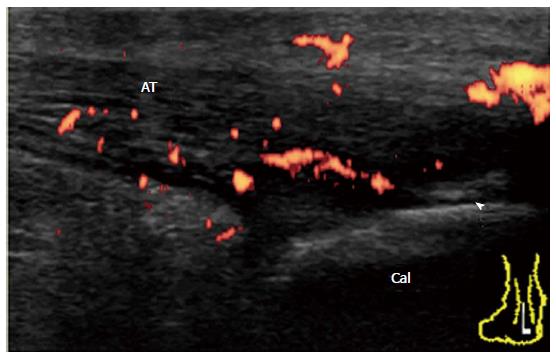
Figure 17 Achilles tendon enthesitis in chronic active psoriatic arthritis.
Longitudinal power Doppler sonogram of AT shows increased thickness, hypoechogenicity, and loss of fibrillar pattern of AT with intratendinous hyperemia adjacent to the enthesis insertion into the calcaneal bone. Calcification (arrowhead) is also depicted. Cal: Calcaneus; AT: Achilles tendon.
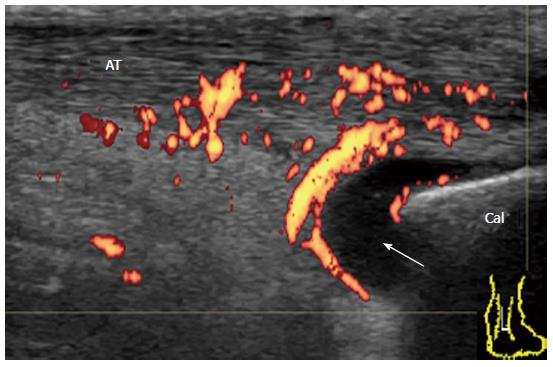
Figure 18 Retrocalcaneal bursitis in rheumatoid arthritis.
Longitudinal power Doppler sonogram of the AT shows distended retrocalcaneal bursa (arrow) associated with peribursal hyperemia. Increased thickness of the AT with intratendinous hyperemia adjacent to the bursa is also depicted. Cal: Calcaneus; AT: Achilles tendon.
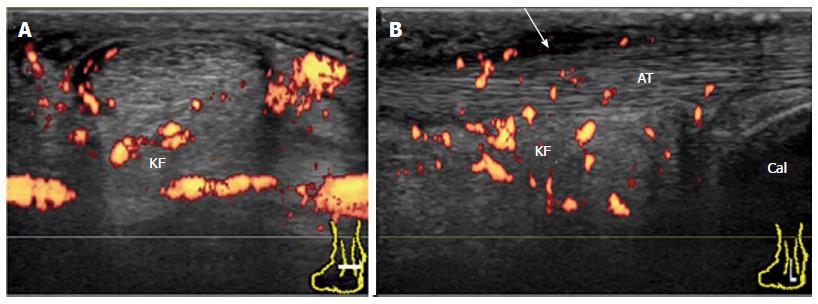
Figure 19 Achilles paratenonitis in early rheumatoid arthritis.
Transverse (A) and longitudinal (B) power Doppler sonogram of the AT shows thickened, hypoechoic, and hyperemic paratenon (arrow) at the level of the KF with minimal tendinopathy. Hyperemia in the KF is also depicted. AT: Achilles tendon; KF: Kager’s fat pad; Cal: Calcaneus.
- Citation: Suzuki T. Power Doppler ultrasonographic assessment of the ankle in patients with inflammatory rheumatic diseases. World J Orthop 2014; 5(5): 574-584
- URL: https://www.wjgnet.com/2218-5836/full/v5/i5/574.htm
- DOI: https://dx.doi.org/10.5312/wjo.v5.i5.574


