Copyright
©2014 Baishideng Publishing Group Inc.
World J Orthop. Jul 18, 2014; 5(3): 386-391
Published online Jul 18, 2014. doi: 10.5312/wjo.v5.i3.386
Published online Jul 18, 2014. doi: 10.5312/wjo.v5.i3.386
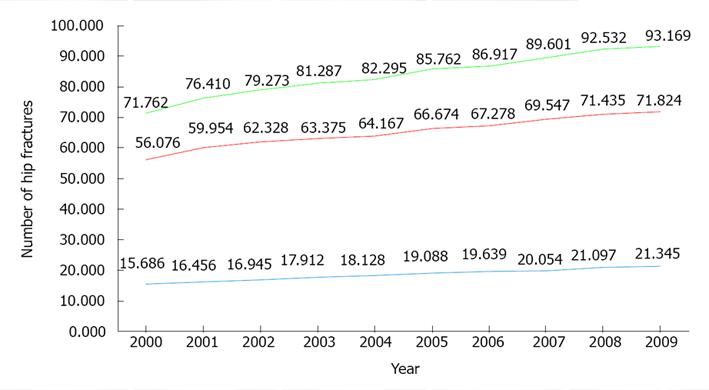
Figure 1 Total number of hip fractures.
Number of hospitalizations following hip fractures in Italy in women (red line), men (blue line) and all patients (green line) ≥ 65 years old, years 2000-2009 (Italian National Hospitalizations Records).
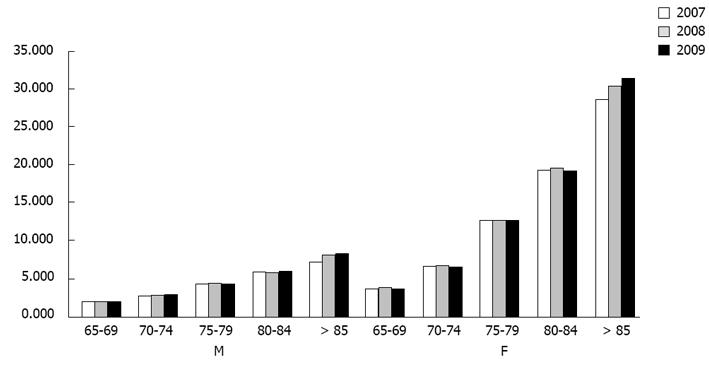
Figure 2 Number of hip fractures per age group.
Hospitalizations following hip fractures in Italy in patients ≥ 65 years old, presented by five-year age groups and sex between 2007 and 2009 (Italian National Hospitalizations Records).
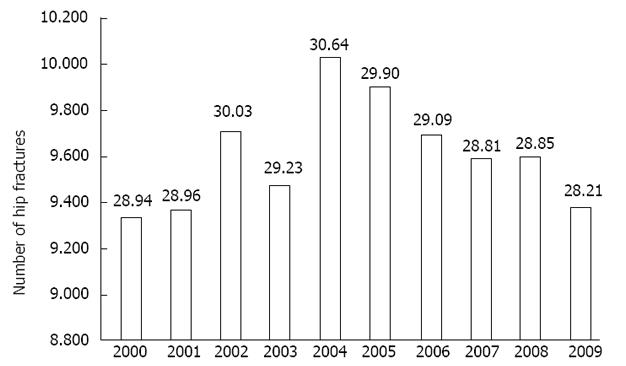
Figure 3 Trend of hip fractures.
Decreasing trend in number of hospitalizations following hip fractures and in their incidence per 10000 in women 65-74 years old, years 2000-2009 (Italian National Hospitalizations Records).
- Citation: Piscitelli P, Feola M, Rao C, Celi M, Gasbarra E, Neglia C, Quarta G, Liuni FM, Parri S, Iolascon G, Brandi ML, Distante A, Tarantino U. Ten years of hip fractures in Italy: For the first time a decreasing trend in elderly women. World J Orthop 2014; 5(3): 386-391
- URL: https://www.wjgnet.com/2218-5836/full/v5/i3/386.htm
- DOI: https://dx.doi.org/10.5312/wjo.v5.i3.386


