Copyright
©2014 Baishideng Publishing Group Co.
World J Orthop. Apr 18, 2014; 5(2): 134-145
Published online Apr 18, 2014. doi: 10.5312/wjo.v5.i2.134
Published online Apr 18, 2014. doi: 10.5312/wjo.v5.i2.134
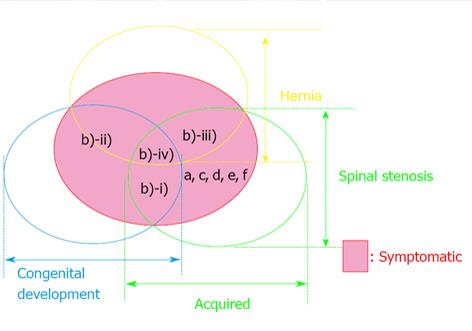
Figure 1 Schematic drawing illustrating the international classification of lumbar canal stenosis.
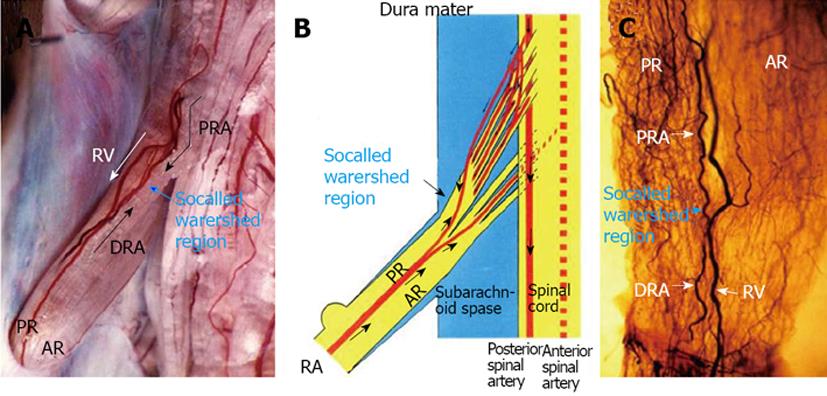
Figure 2 Circulatory dynamics of the radicular artery for the lumbar nerve root in a dog.
A: After 3 mL of India ink was injected quickly through a catheter fixed in the aortic arch, seriograhy was performed using a motor-driven camera and repeating flash to observe the flow of India ink into vessels supplying the nerve root. After injection of India ink, at first the proximal radicular arteries (PRA) running along each root filament filled with India ink in a downward direction (↓). Next, the distal radicular arteries (DRA) filled with India ink in an upward direction (↑). A watershed region of blood flow was observed in a radicular vessel (blue arrow). At last, the radicular vein (RV) filled with India ink in the downward direction (white arrows); B: A watershed region was noted in the radicular artery, and in this region the velocity of both blood streams showed a decrease; C: A clear specimen of the nerve root from the same subject as shown in A. An abundant vascular network was noted in the root near the watershed area of the radicular artery observed by seriography. AR: Anterior root. Reproduced with permission from Kobayashi et al[28].
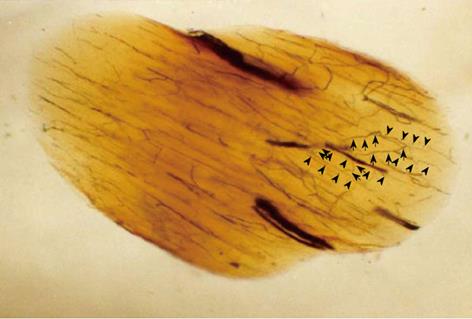
Figure 3 Oblique cleared section of the lumbar nerve root in a dog.
There are many longitudinal (arrow head) and transverse (arrow) microvessels in the nerve root. Intraradicular vessels are abundant throughout the nerve root, and their flow is in various directions. Intraradicular vessels arising from the radicular artery as T-shaped branches rarely were affected by the direction of blood flow in the nerve root, suggesting the presence of a mechanism that maintains the blood supply to the intrinsic vessels.
Figure 4 Changes of intraradicular blood flow, partial oxygen pressure and conduction velocity after Aorta (A) or inferior vena cava (B) clamp.
Immediately after Aorta clamping, blood pressure in the femoral artery dropped to 26-40 mmHg and meantime, central venous pressure was slightly elevated. When the vena cava was clamped, central venous pressure increased to about 4 times of the pressure before clamping and blood pressure in the femoral artery was reduced by half. The blood flow in the seventh posterior nerve root due to Aorta and vena cava clamping fall to 50% to 60% of the blood flow before clamping in the ischemic model (aP < 0.05) and to about 20% in the congestion model (aP < 0.05). The changes of partial oxygen pressure (PO2) in the nerve root indicated a similar tendency to blood flow, 50% to 60% drop in the ischemic model (aP < 0.05) and 20% to 40% drop in the congestion model. Conduction velocity of the nerve root diminished by 40% to 50% in the ischemia model (aP < 0.05) and 10% to 20% in the congestion model. After release of clamping, both arterial and venous pressures quickly returned to the pressure before clamping. The intraradicular blood flow in the congestion model was restored within 1 h. The intraradicular blood flow in the ischemic model, however, did not recover and stayed at the reduced level (aP < 0.05). Intraradicular PO2 recovered completely in both models. The drop of conduction velocity returned almost completely within one hour after release of clamping. Reproduced with permission from Kobayashi et al[42].
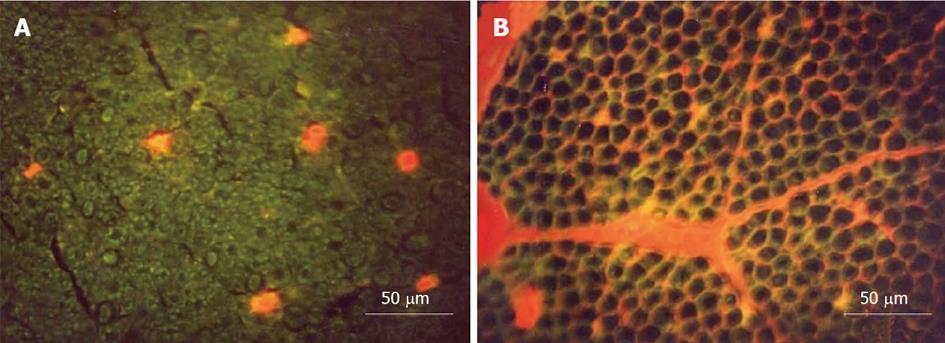
Figure 5 Transverse sections of the nerve root seen under a fluorescence microscope.
A: Ischemia model. Evans blue albumin (EBA) emits a bright red fluorescence in clear contrast to the green fluorescence of the nerve tissue. After intravenous injection of EBA, EBA was limited inside the blood vessels, and the blood-nerve barrier was maintained; B: Congestion model. EBA emits a bright red fluorescence, which leaked outside the blood vessels, and intraradicular edema was seen under a fluorescent microscope. Reproduced with permission from Kobayashi et al[42].
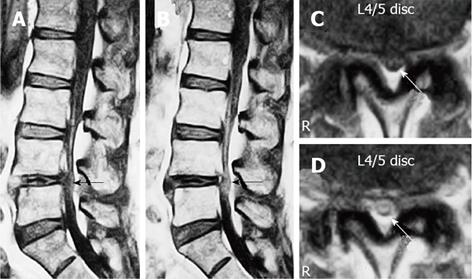
Figure 6 Gadolinium-enhanced magnetic resonance imaging of the cauda equina edema in lumbar canal stenosis.
A 73-year-old man complained of weakness and numbness of the lower extremities after walking about 300 m, but no obvious sensory loss and muscle weakness was noted. Precontrast T1-weighted (500/35) sagittal (A) and axial (C) conventional spin echo MR image indicated a diagnosis of LCS at L4/5 disc level (arrows). T1-weighted (500/35) sagittal (B) and axial (D) Magnetic resonance image acquired at L4/5 disc level obtained after 0.1 mmol/kg intravenous Gd-DTPA administration showing the generalized central canal stenosis as well as punctuate areas of intrathecal enhancement (arrows) indicating a breakdown in the blood-nerve barrier. Reproduced with permission from Kobayashi et al[46].
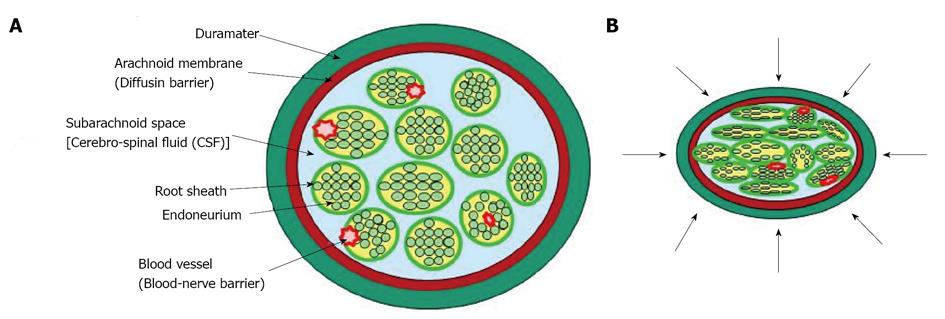
Figure 7 Diagram that illustrates possible mechanical effects on cauda equine.
A: Normal state; B: Lumbar canal stenosis. The pressure is applied to the cauda equina with many nerve roots in a circumferential manner.
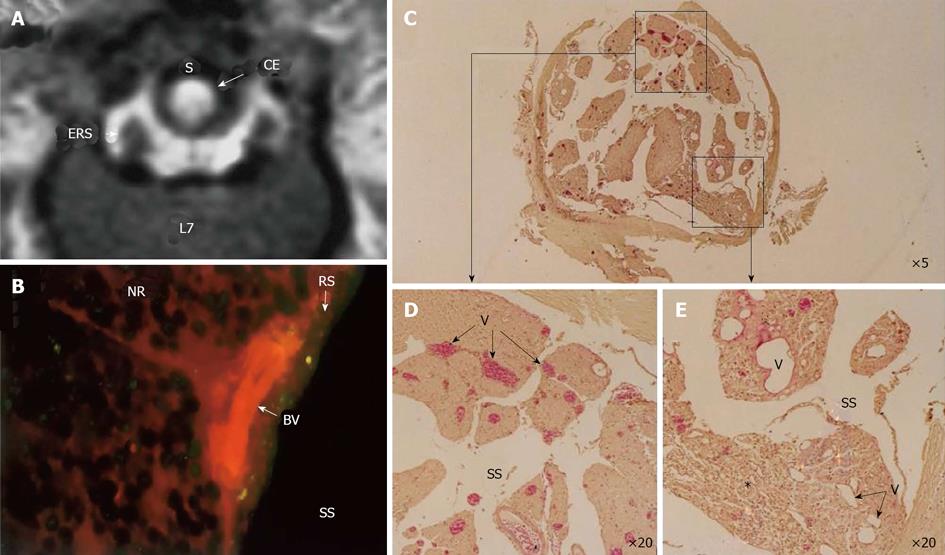
Figure 8 Circumferential compression of the dog cauda equine.
The cauda equina was constricted outside the dura mater using a silicone tube (S), which caused 30% constriction of the diameter of the dura mater using a silicone tube at L6/7 disc level. After 3 wk constriction, clear enhancement was seen inside the cauda equina constricted by a silicon tube (S) as seen on gadolinium-enhanced magnetic resonance (MR) image [T1-weighted spin-echo (SE) image, 600/25 (TR/TE)] (A). No enhancement of epidural root sleeves (ERS) was found on this image. In the cauda equina, where enhancement was found on MR imaging, Evans blue albumin emits a bright red fluorescence which leaked outside the blood vessels, and intraradicular edema was seen under a fluorescent microscope (B). Light microscopy revealed congestion and dilation of the radicular veins (C-E) inside the cauda equina, inflammatory cells infiltration, and Wallerian degeneration (E, asterisk) was observed in the entrapped region. This situation was reflected as breakdown of blood–nerve barrier on fluorescent microscopy and high intensity on gadolinium- enhanced MR imaging. BV: Blood vessel; CE: Cauda equina; ENS: Epidural root sleeves; NR: Nerve root; RS: Root sheath; S: Silicon tube; SS: Subarachnoid space.
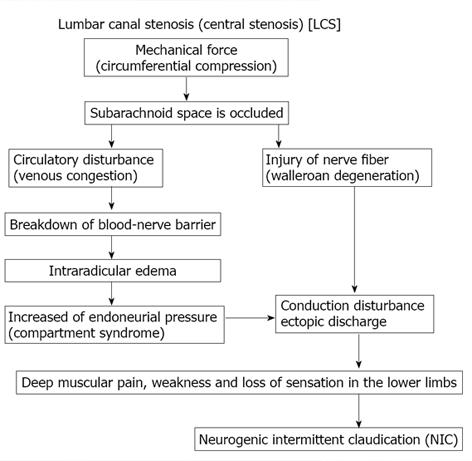
Figure 9 Pathogenesis of neurogenic intermittent claudication in lumbar canal stenosis.
Figure 10 Effect of prostaglandin E1 on normal (A-C) and compressed nerve root (D-F).
The seventh lumbar nerve root was clamped with a clip for 3 wk using dogs. After release of clipping, the intraradicular blood flow was measured before and after intravenous injection of lipo-prostaglandin E1 (PGE1) (D-F). As the control group, animals were evaluated at 3 wk after laminectomy. The nerve root was only exposed and wasn’t clamped with a clip (A-C). In the control (A) group, the mean blood pressure fell immediately after intravenous injection of lipo-PGE1 due to the peripheral vasodilation, but then gradually increased and recovered after 20 min. The changes of blood pressure in the nerve root compression group were the same as those seen in the control group (D). Intravenous injection of lipo-PGE1 also resulted in marked increase of blood flow in the normal nerve roots (B), but caused minimal enhancement of blood flow at the sites of nerve root compression exhibiting Wallerian degeneration (E). Histological examination revealed no degeneration of the nerve fibers in the control group (C). However, marked Wallerian degeneration was seen in the nerve root compression group (D). The relative number of small diameter axons increased in the compression group at 3 wk after operation compared with the control group (HE stain, original magnification X 50).
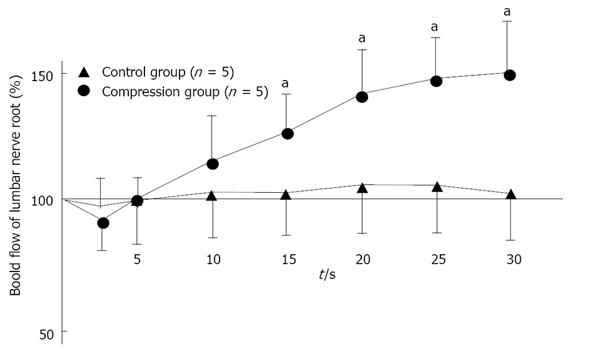
Figure 11 Changes in intraradicular blood flow after intravenous injection of lipo-prostaglandin E1.
In normal (control) nerve roots (n = 5), intraradicular blood flow fell immediately after intravenous injection of lipo-Prostaglandin E1 (PGE1), but gradually increased (aP < 0.05). After 30 min, the mean blood flow was 49% higher than before lipo-PGE1 injection. However, the changes of intraradicular blood flow in the nerve root compression group (n = 5) were not as marked as in the control group, with the mean value after 30 min being only 5% higher than pretreatment value. Reproduced with permission from Kobayashi et al[81].
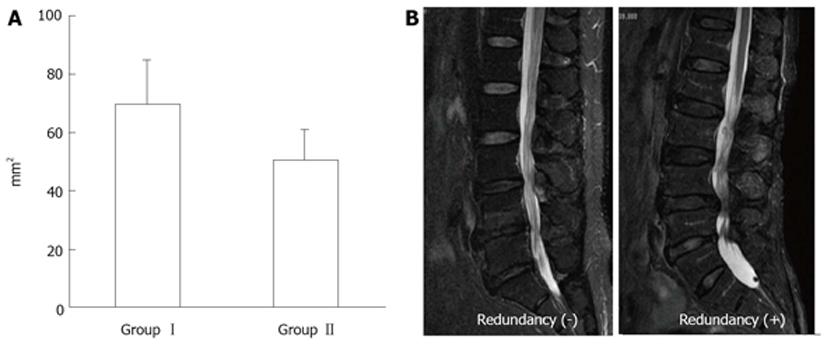
Figure 12 Magnetic resonance imaging of lumbar canal stenosis patients with neurogenic intermittent claudication.
A: Cross-sectional area of dural sac (T1-w) at the site of maximal canal stenosis; B: Magnetic resonance imaging of redundunt nerve root (T2-w).
- Citation: Kobayashi S. Pathophysiology, diagnosis and treatment of intermittent claudication in patients with lumbar canal stenosis. World J Orthop 2014; 5(2): 134-145
- URL: https://www.wjgnet.com/2218-5836/full/v5/i2/134.htm
- DOI: https://dx.doi.org/10.5312/wjo.v5.i2.134


