Copyright
©2013 Baishideng Publishing Group Co.
World J Orthop. Oct 18, 2013; 4(4): 267-278
Published online Oct 18, 2013. doi: 10.5312/wjo.v4.i4.267
Published online Oct 18, 2013. doi: 10.5312/wjo.v4.i4.267
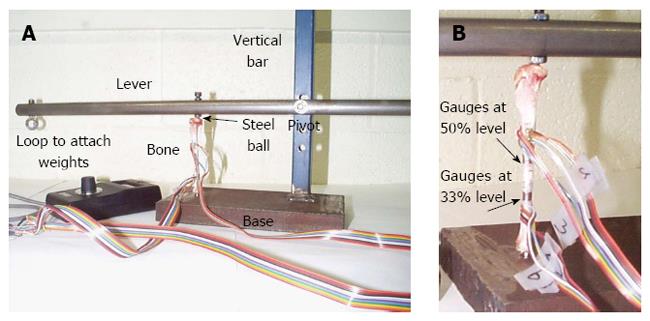
Figure 1 Testing apparatus used for the rabbit experiments.
A: The full rig; B: The strain gauge positions.
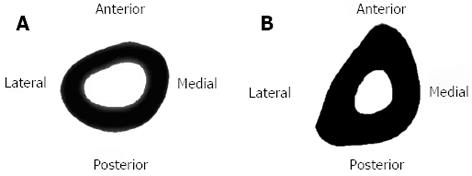
Figure 2 Rabbit cross-section of the right tibia showing the position of the gauges.
A: At the 33% level; B: At the 50% level.
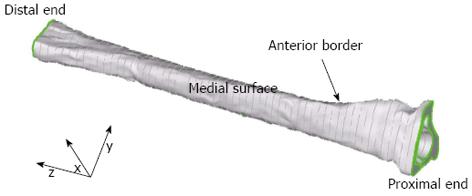
Figure 3 The full rabbit tibial finite element model illustrating the cross-sections and the surface geometry.
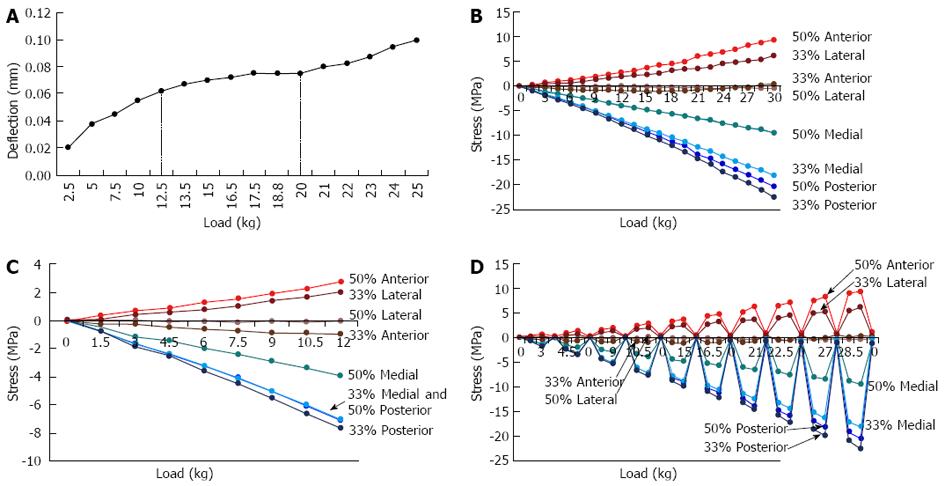
Figure 4 Results for the rabbit bone experiments.
A: Elastic buckling test. Loads < 12.5 kg were linear, whereas there was non-linear behaviour for loads > 12.5 kg. However, the non-linear region also demonstrated some linear behaviour (i.e., from 20-25 kg); B: Strain gauge test. Gauges were attached in eight locations on the bone. Tension is positive and compression is negative; C: The segment of the rabbit tibial strain gauge test from 0 to 12 kg; D: Hysteresis test. The results show that the bone exhibits predominately elastic behaviour.
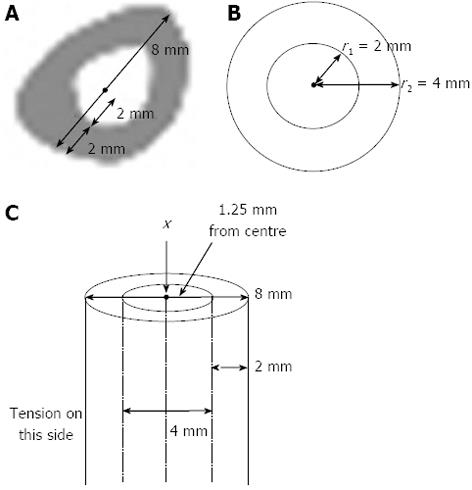
Figure 5 For tension to be produced in a typical beam a similar size to the rabbit tibia, a compressive load needs to be offset from the centroid in the opposite direction by only 1.
25 mm. A: Dimensions from the midshaft of a rabbit’s tibial cross-section: AP width (8 mm), cortical width (2 mm) and medullary half-width (2 mm); B: The rabbit midshaft cross-section represented as a section from a beam; C: The beam showing an axial load through the centroid (x) and the offset.
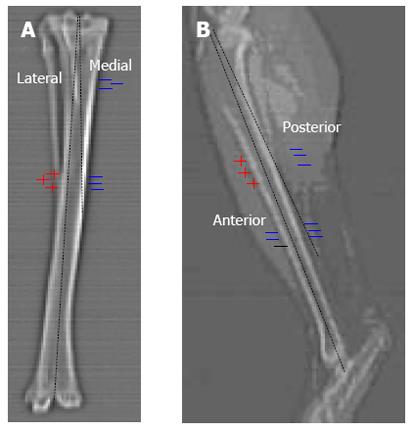
Figure 6 As demonstrated by these radiographs, a compressive load through the centroidal axis of the rabbit tibia will result in a similar stress pattern as when applying an offset axial load to a straight bone.
A: Anterior view; B: Lateral view.
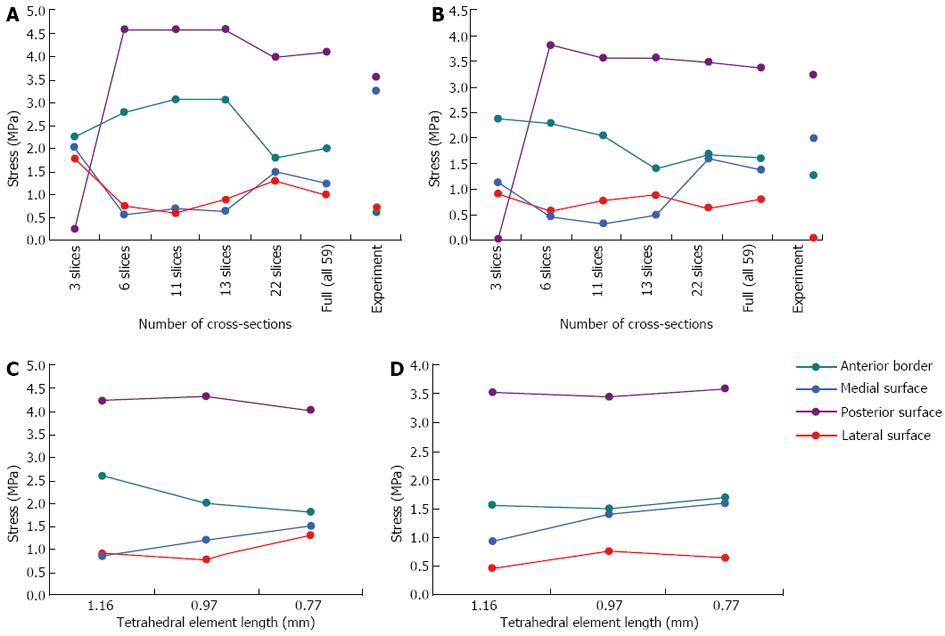
Figure 7 Convergence test results on the finite element model.
A: Geometric convergence tests at the 33% level; B: Geometric convergence tests at the 50% level; C: Mesh convergence tests at the 33% level; D: Mesh convergence tests at the 50% level.
Figure 8 Theoretical and experimental stresses in the rabbit tibiae.
A: The 33% level; B: The 50% level.
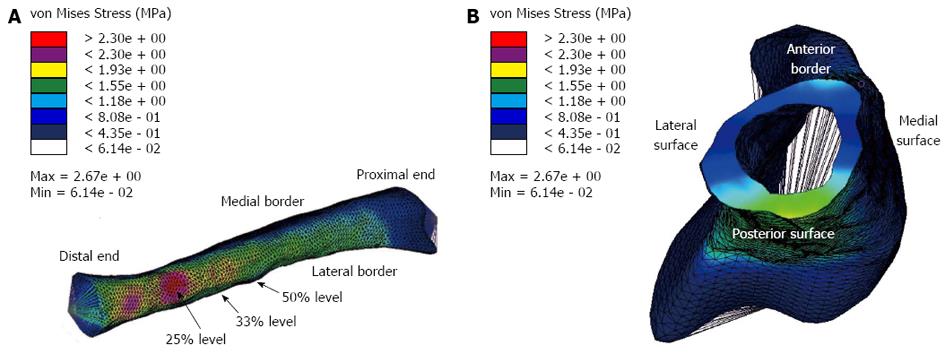
Figure 9 Rabbit finite element model showing the von Mises stresses.
A: Posterior view: High stresses were found along the posterior surface; these were most prominent around 25% level, which is shown in red; B: A section through the 50% level. The highest stress (which is compressive) is on the posterior surface, which is consistent with the stress results presented in Figure 8B.
Figure 10 Geometric properties of the rabbit cross-sections: every third section is calculated numerically using a Fortran computer program.
NB: Not all sections are shown, there are 71 sections in total. A: The principal moments: the lowest moments are between cross-sections 18 and 21, which represent the 25% to 29% of the model and correspond to the high stress region in the finite element model; B: The cross-sectional areas: the lowest areas are for cross-sections 18 and 21, which correspond to the 25% to 29% levels respectively.
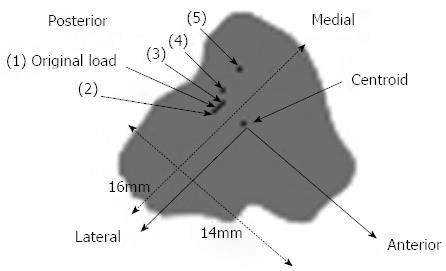
Figure 11 Load positions for the sensitivity tests.
Figure 12 Beam theory results against strain gauge (experimental) and finite element model (Loads 1-5).
The load positions applied to the model were previously shown in Figure 11 (Load 1 is the original load position on the model). A: Results for the 33% level; B: Results for the 50% level.
- Citation: Franklyn M, Field B. Experimental and finite element analysis of tibial stress fractures using a rabbit model. World J Orthop 2013; 4(4): 267-278
- URL: https://www.wjgnet.com/2218-5836/full/v4/i4/267.htm
- DOI: https://dx.doi.org/10.5312/wjo.v4.i4.267


