Copyright
©The Author(s) 2025.
World J Orthop. May 18, 2025; 16(5): 106183
Published online May 18, 2025. doi: 10.5312/wjo.v16.i5.106183
Published online May 18, 2025. doi: 10.5312/wjo.v16.i5.106183
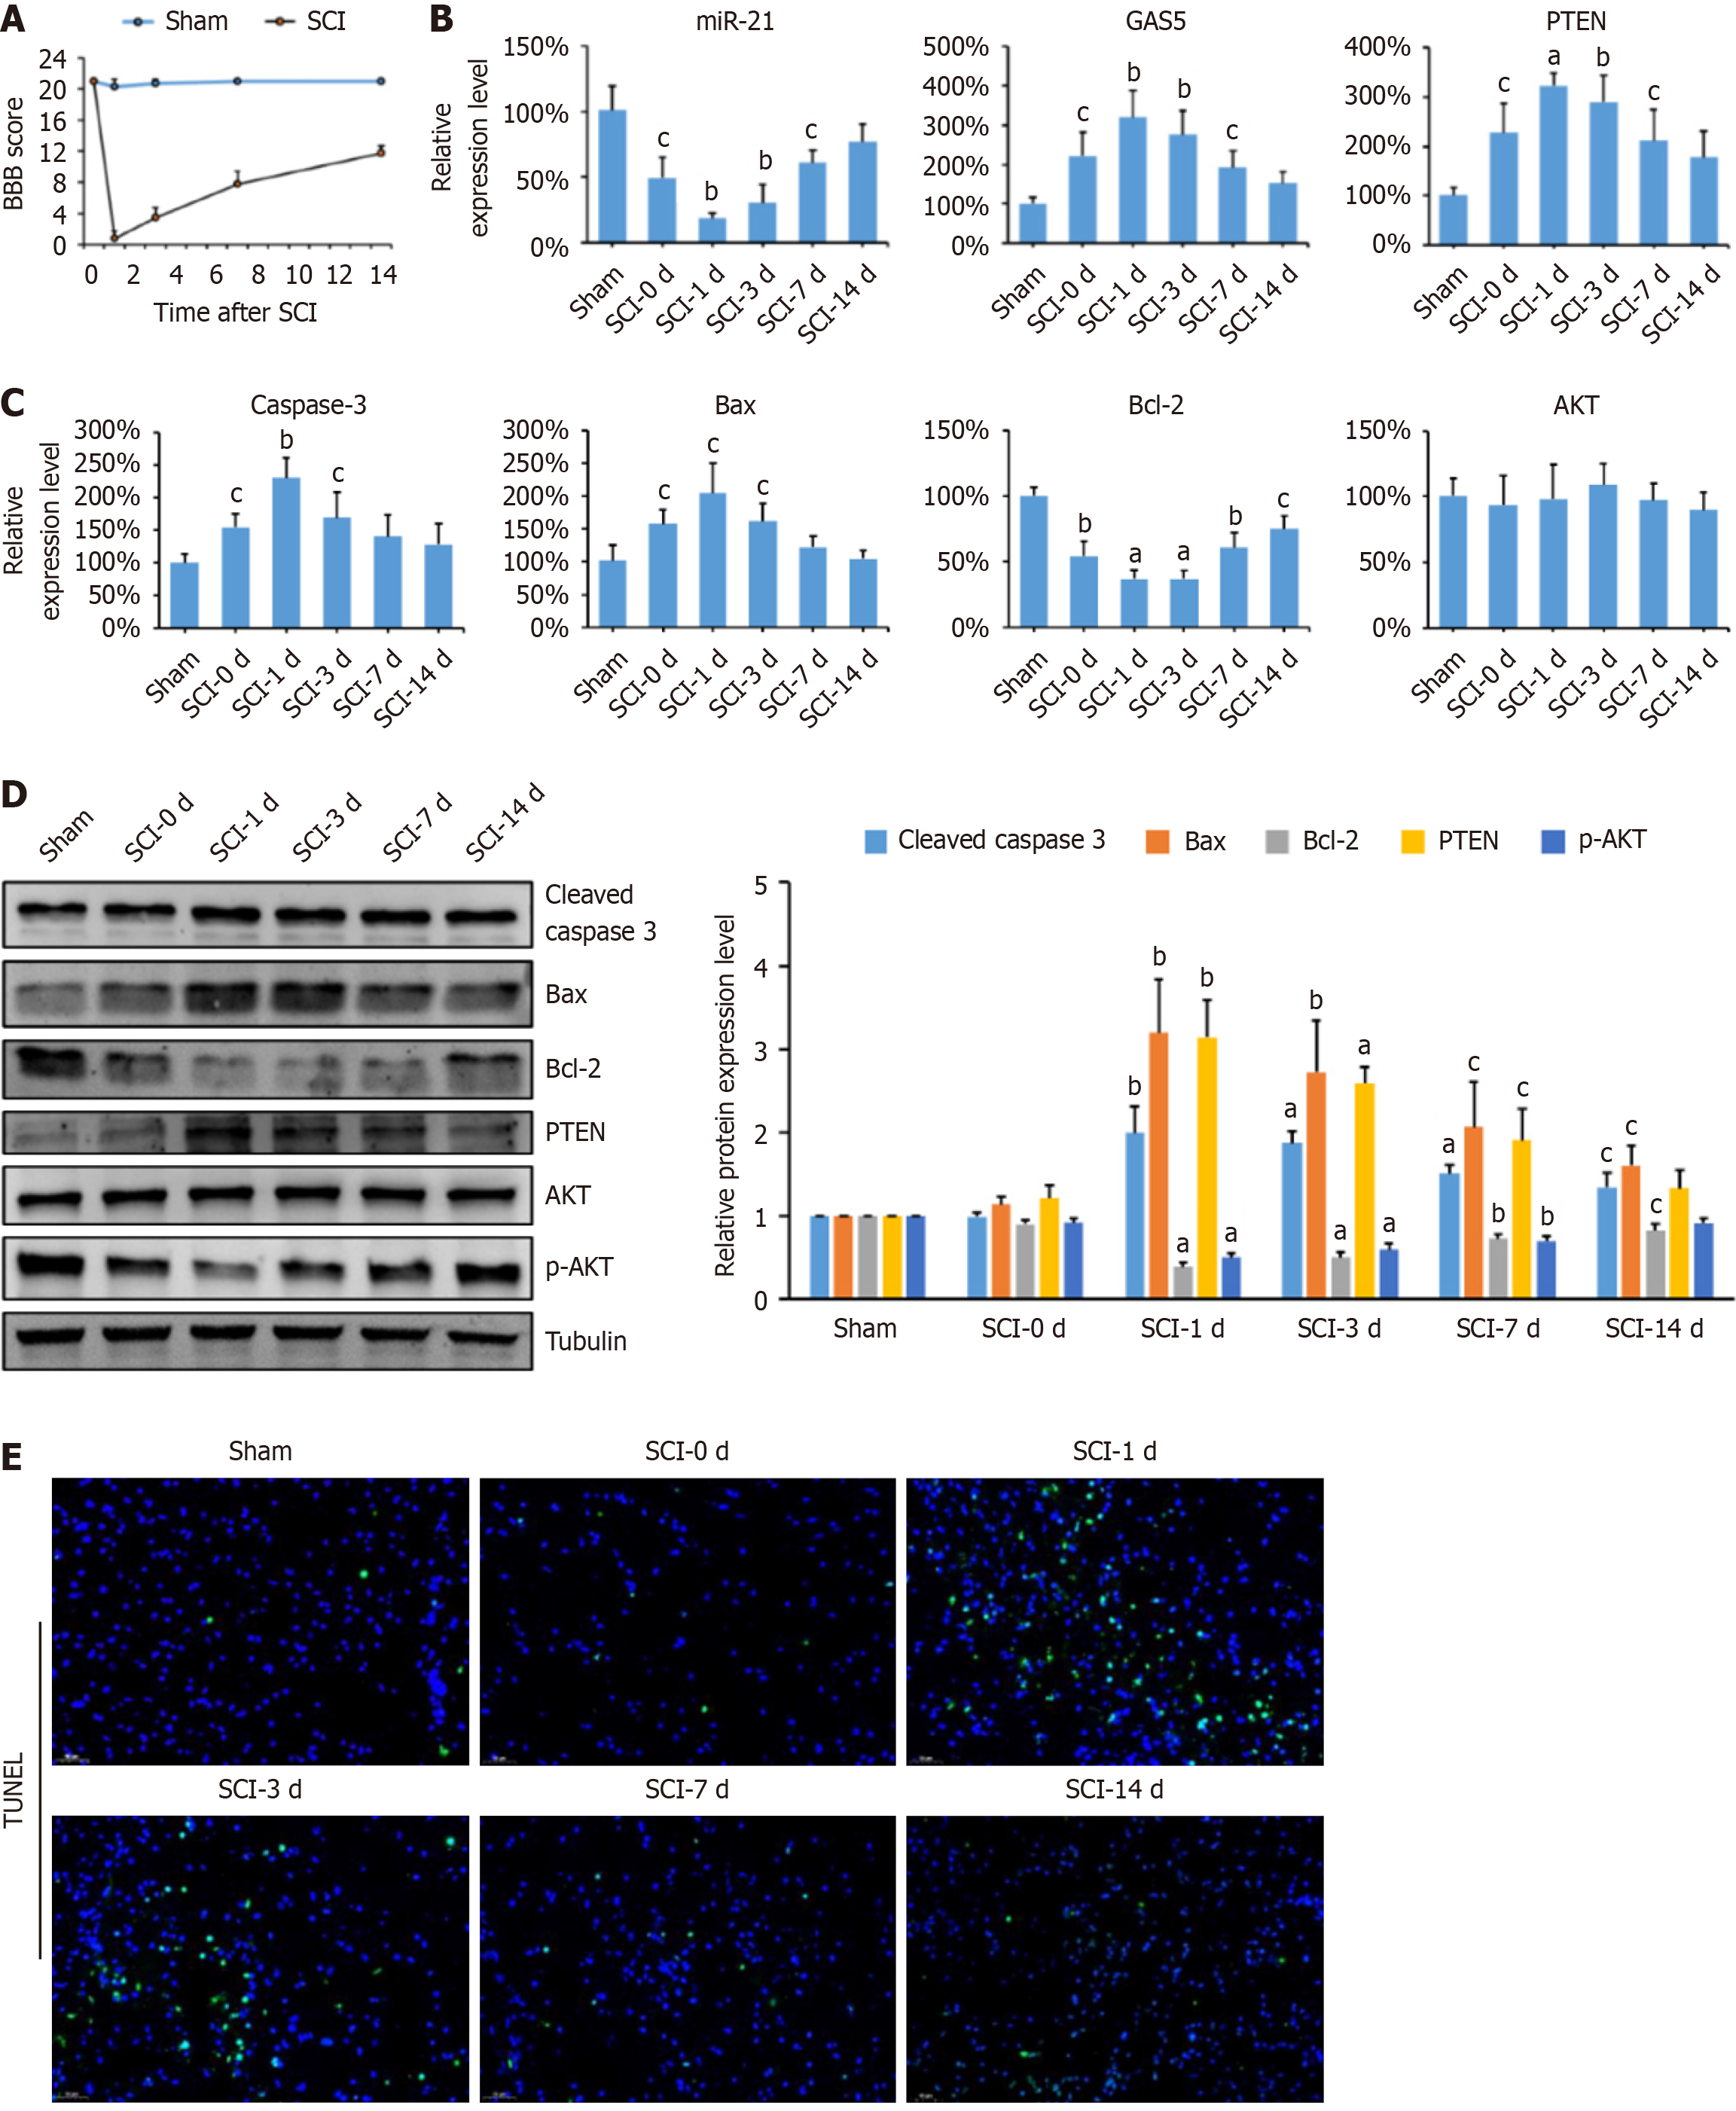
Figure 1 Upregulation of growth arrest-specific transcript 5 in spinal cord injury rats.
A: Basso, Beattie, and Bresnahan (BBB) scores for both the spinal cord injury (SCI) group and the sham group (n = 6 per group); B: Relative expression levels of microRNA (miR)-21, growth arrest-specific transcript 5, and phosphatase and tensin homolog (PTEN) in the spinal cord tissue of rats in the sham group and the SCI model group at different time points (n = 6 per group); C: Relative mRNA expression levels of caspase-3, B-cell lymphoma 2 (Bcl-2), Bcl-2-associated X protein (Bax), and AKT in the spinal cord tissue of rats in the sham group and the SCI model group (n = 6 per group); D: Protein expression of cleaved caspase-3, Bcl-2, Bax, PTEN, AKT, and phosphorylated AKT (p-AKT) in rat spinal cord tissues detected by western blotting, and protein bands were subjected to grayscale analysis using ImageJ followed by statistical analysis using GraphPad Prism 9.0. The endogenous control utilized was tubulin (n = 6 per group); E: TUNEL assay was used to identify apoptotic cells in rat spinal cord tissue. Data are presented as the mean ± SD. aP < 0.001, bP < 0.01, and cP < 0.05 compared to the sham group.
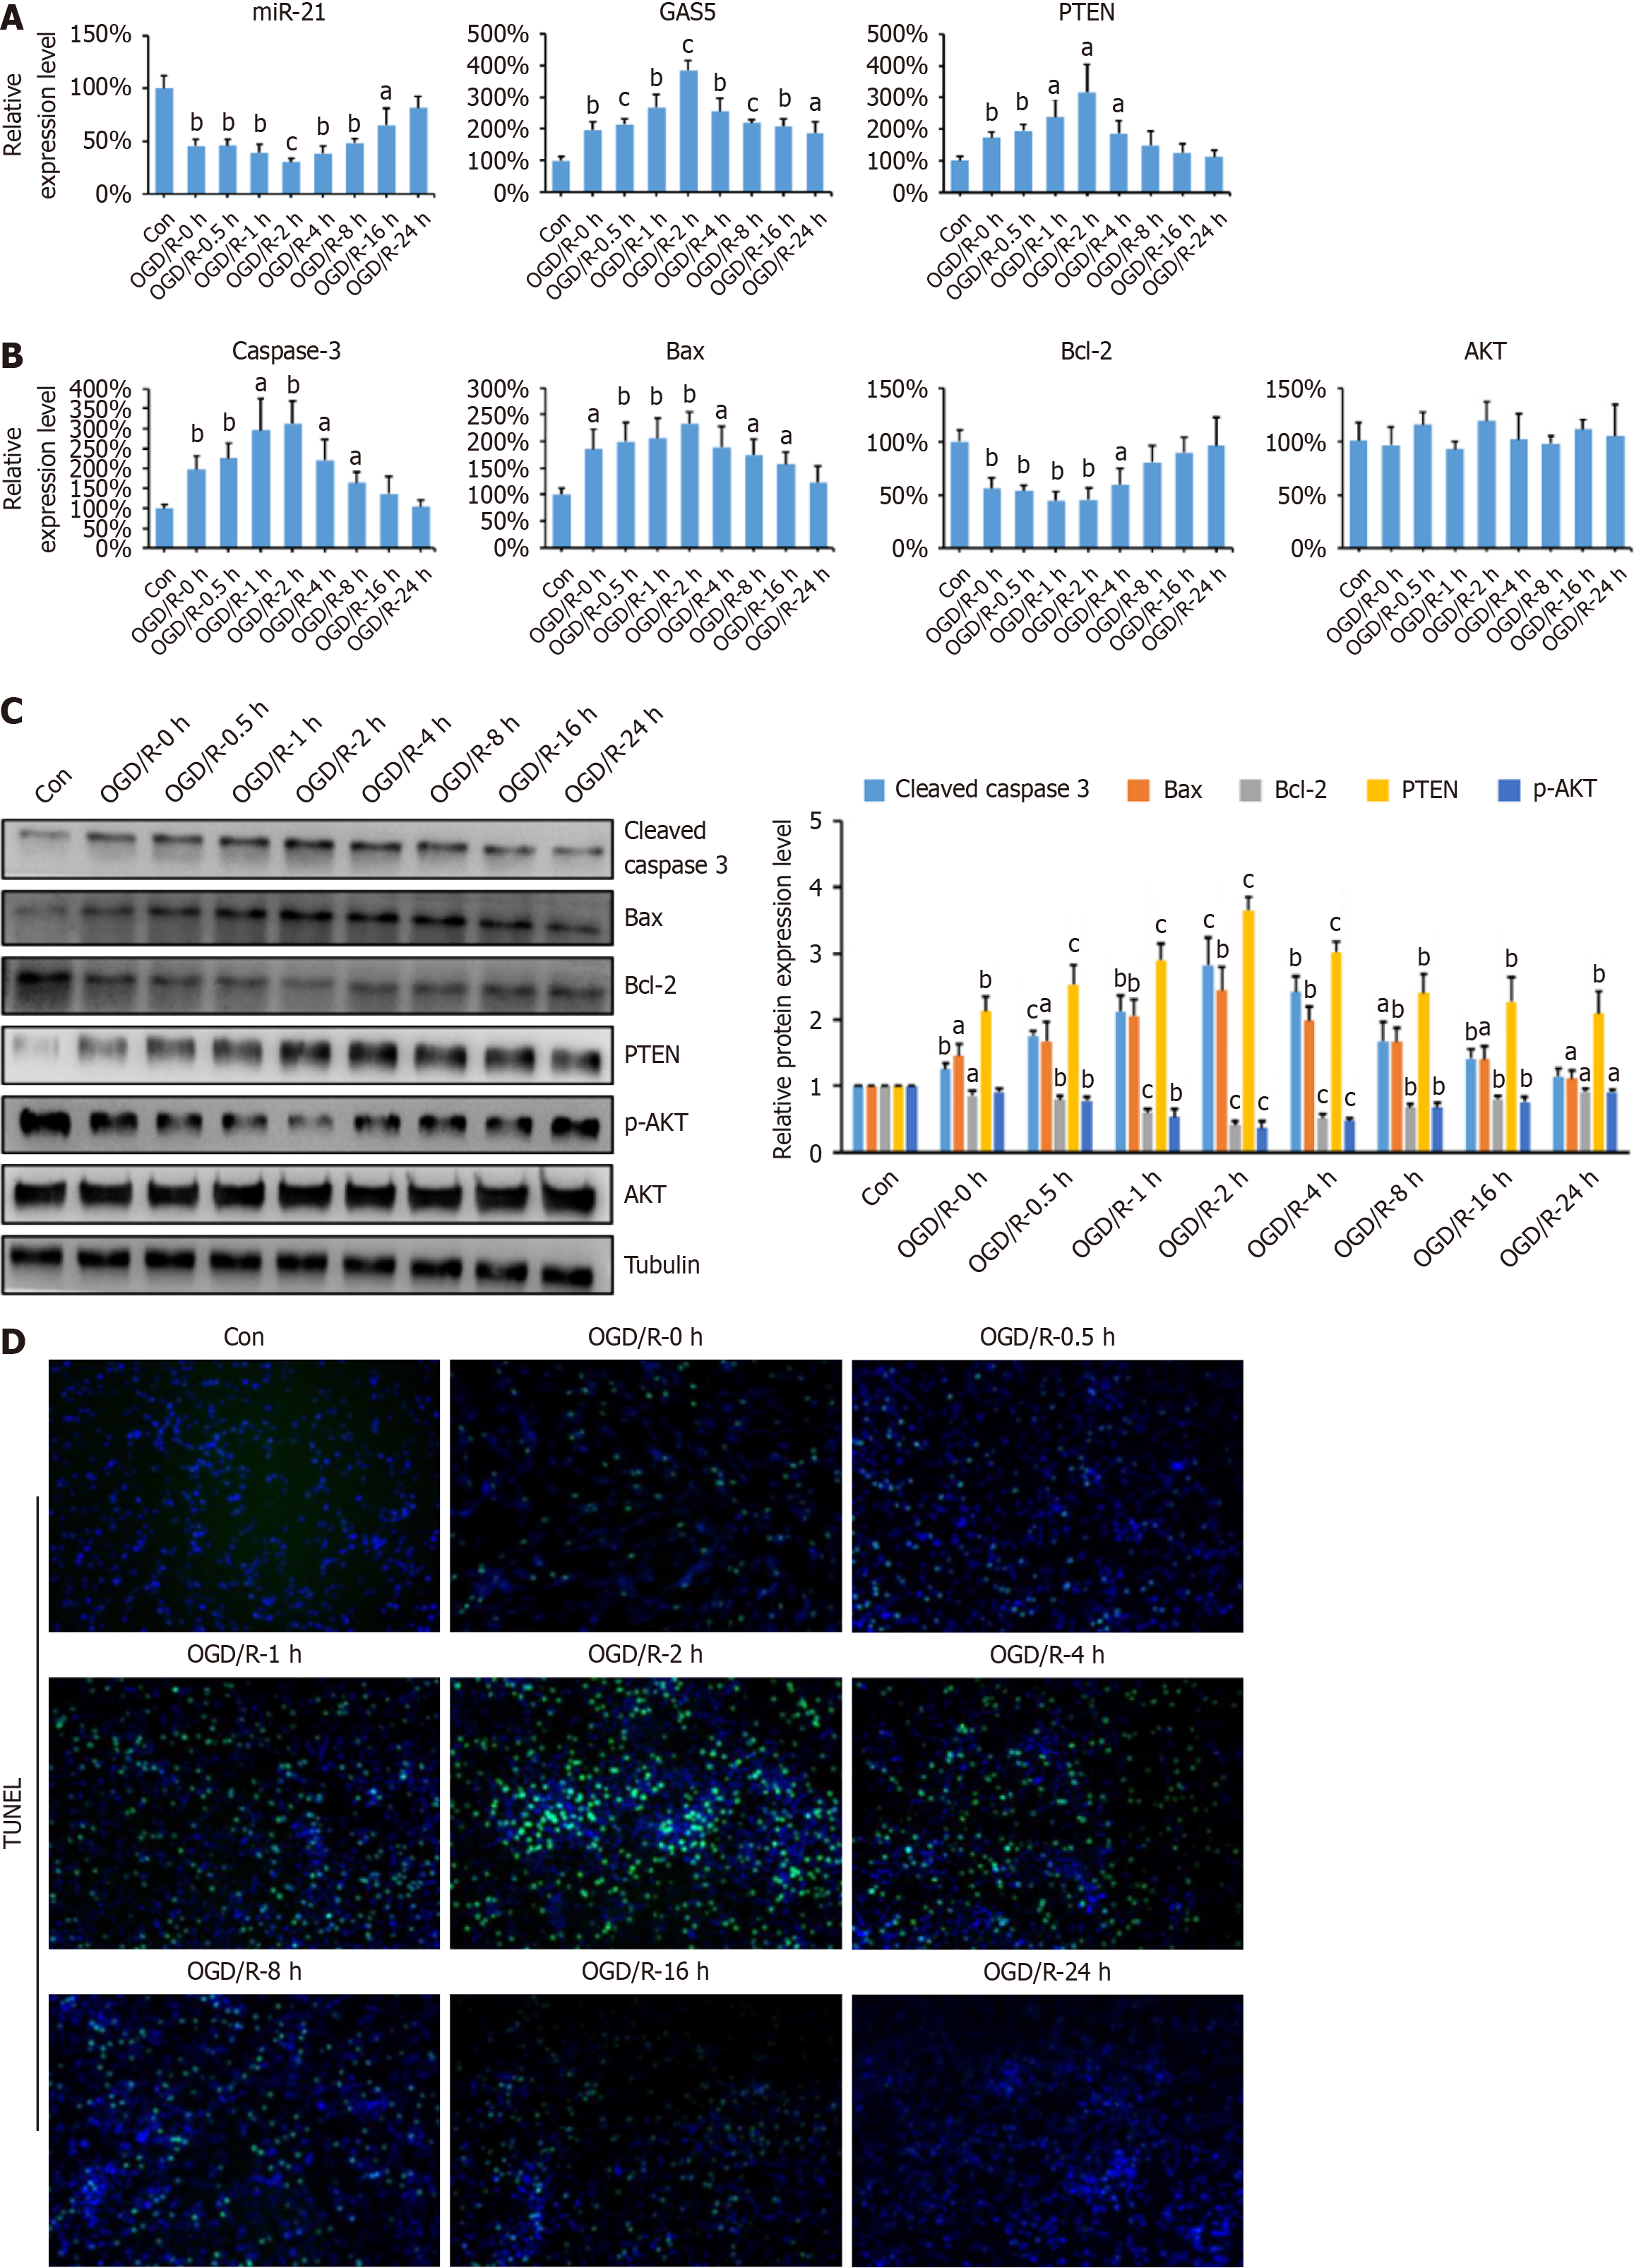
Figure 2 Growth arrest-specific transcript 5 promoted neuronal apoptosis in the PC12 oxygen-glucose deprivation/reoxygenation model.
A: Relative expression levels of microRNA (miR)-21, growth arrest-specific transcript 5, and phosphatase and tensin homolog (PTEN) in PC12 cells subjected to oxygen-glucose deprivation/reoxygenation (OGD/R) treatment, compared to controls (n = 3 per group); B: mRNA relative expression levels of caspase-3, B-cell lymphoma 2 (Bcl-2), Bcl-2-associated X protein (Bax), and AKT in PC-12 cells after OGD/R treatment (n = 3 per group); C: Protein expression of cleaved caspase-3, Bcl-2, Bax, PTEN, AKT, and phosphorylated AKT (p-AKT) in PC-12 cells detected by western blotting. The bar graph represents the relative expression levels of the aforementioned proteins. The endogenous control utilized was tubulin (n = 3 per group); D: TUNEL staining of PC12 cells after OGD/R treatment. The data are presented as the mean ± SD. aP < 0.05, bP < 0.01, and cP < 0.001 vs control group.
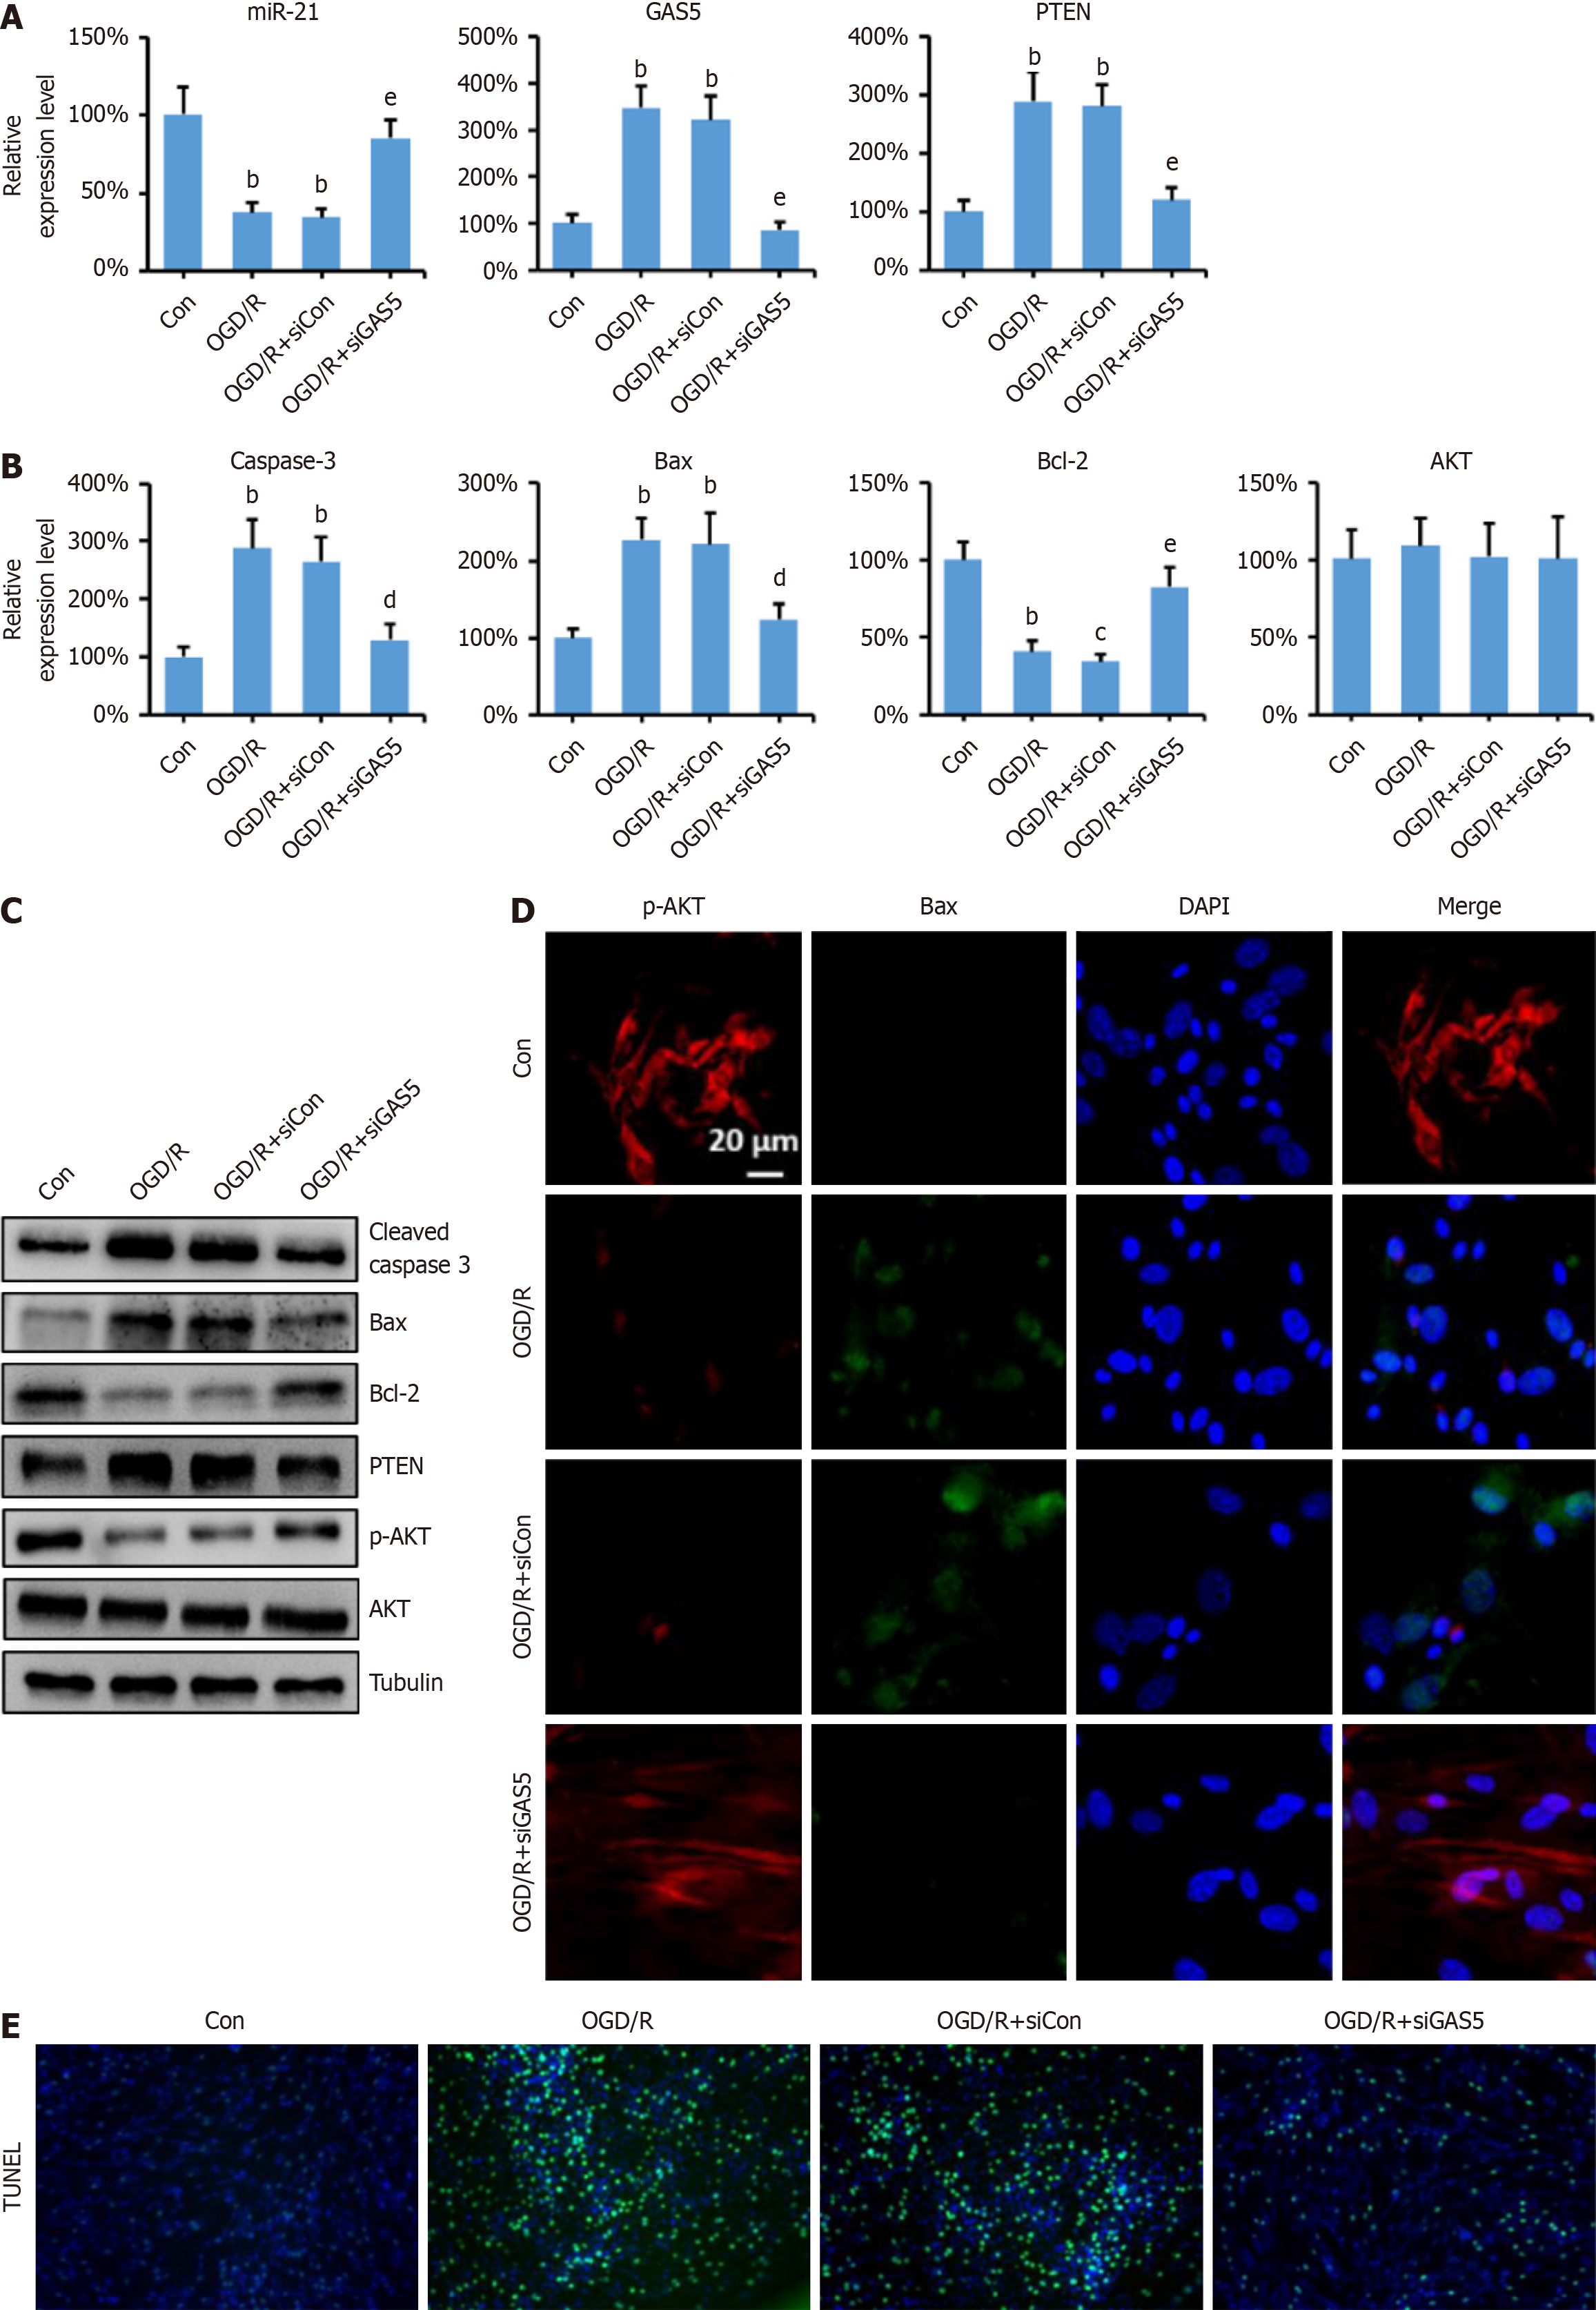
Figure 3 Silence growth arrest-specific transcript 5 inhibits neuronal apoptosis in vitro.
A: Relative expression levels of miR-21, growth arrest-specific transcript 5 (GAS5), and phosphatase and tensin homolog (PTEN) in PC-12 cells after oxygen-glucose deprivation/reoxygenation treatment with GAS5 knockdown (n = 3 per group); B: Relative mRNA expression levels of caspase-3, B-cell lymphoma 2 (Bcl-2), Bcl-2-associated X protein (Bax), and AKT with GAS5 knockdown (n = 3 per group); C: Protein expression of cleaved caspase-3, Bcl-2, Bax, PTEN, AKT, and phosphorylated AKT (p-AKT) in PC12 cells with GAS5 knockdown, detected by western blotting (n = 3 per group); D: Immunofluorescence staining for p-AKT and Bax in PC12 cells with GAS5 knockdown; E: TUNEL staining of PC12 cells with GAS5 knockdown. Data are presented as the mean ± SD. aP < 0.05, bP < 0.01, and cP < 0.001 vs control group; dP < 0.05, eP < 0.01 and fP < 0.001 vs oxygen-glucose deprivation/reoxygenation + siCon group.
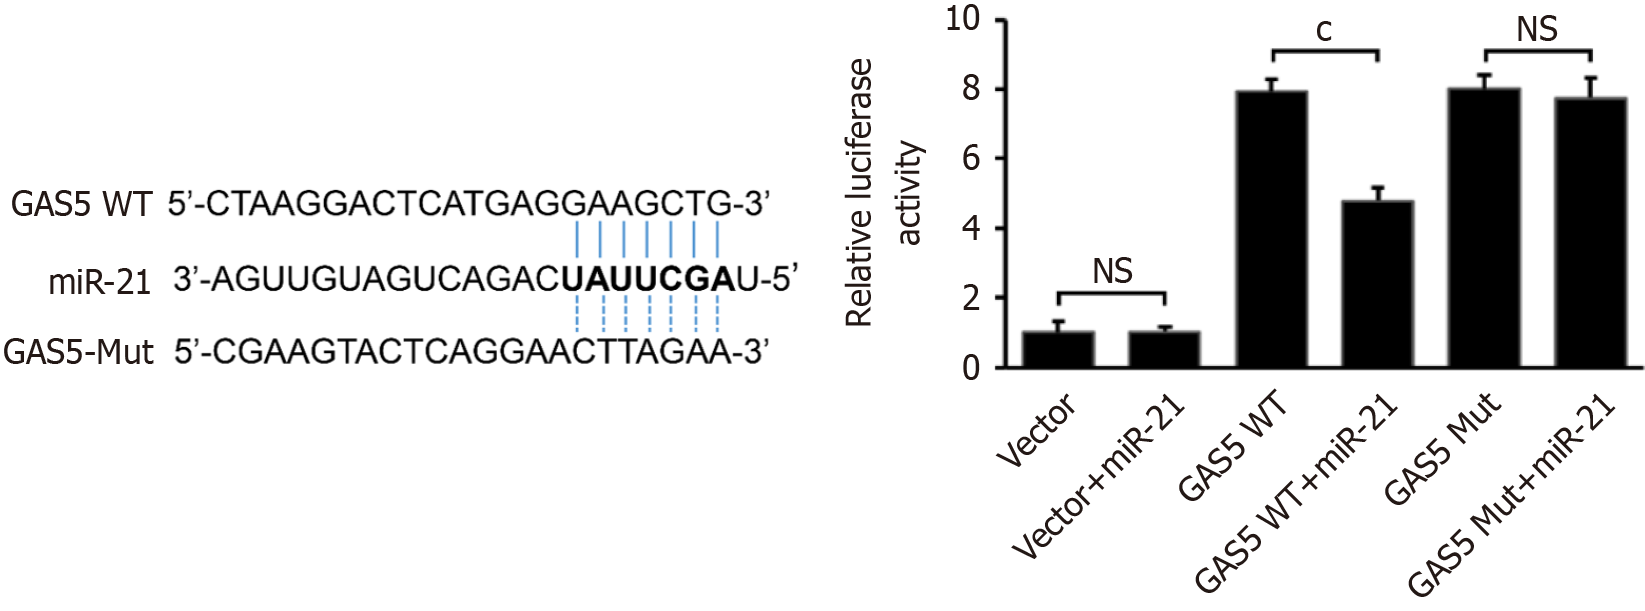
Figure 4 Growth arrest-specific transcript 5 acts as a molecular sponge for microRNA 21.
Dual-luciferase reporter assay showing the relative luciferase activity in PC12 cells co-transfected with microRNA (miR)-21 and wild-type (WT) (growth arrest-specific transcript 5 [GAS5] WT) or mutant (Mut) (GAS5 mutant Mut) GAS5 plasmids (n = 3 per group). P < 0.001 vs GAS5 WT group.
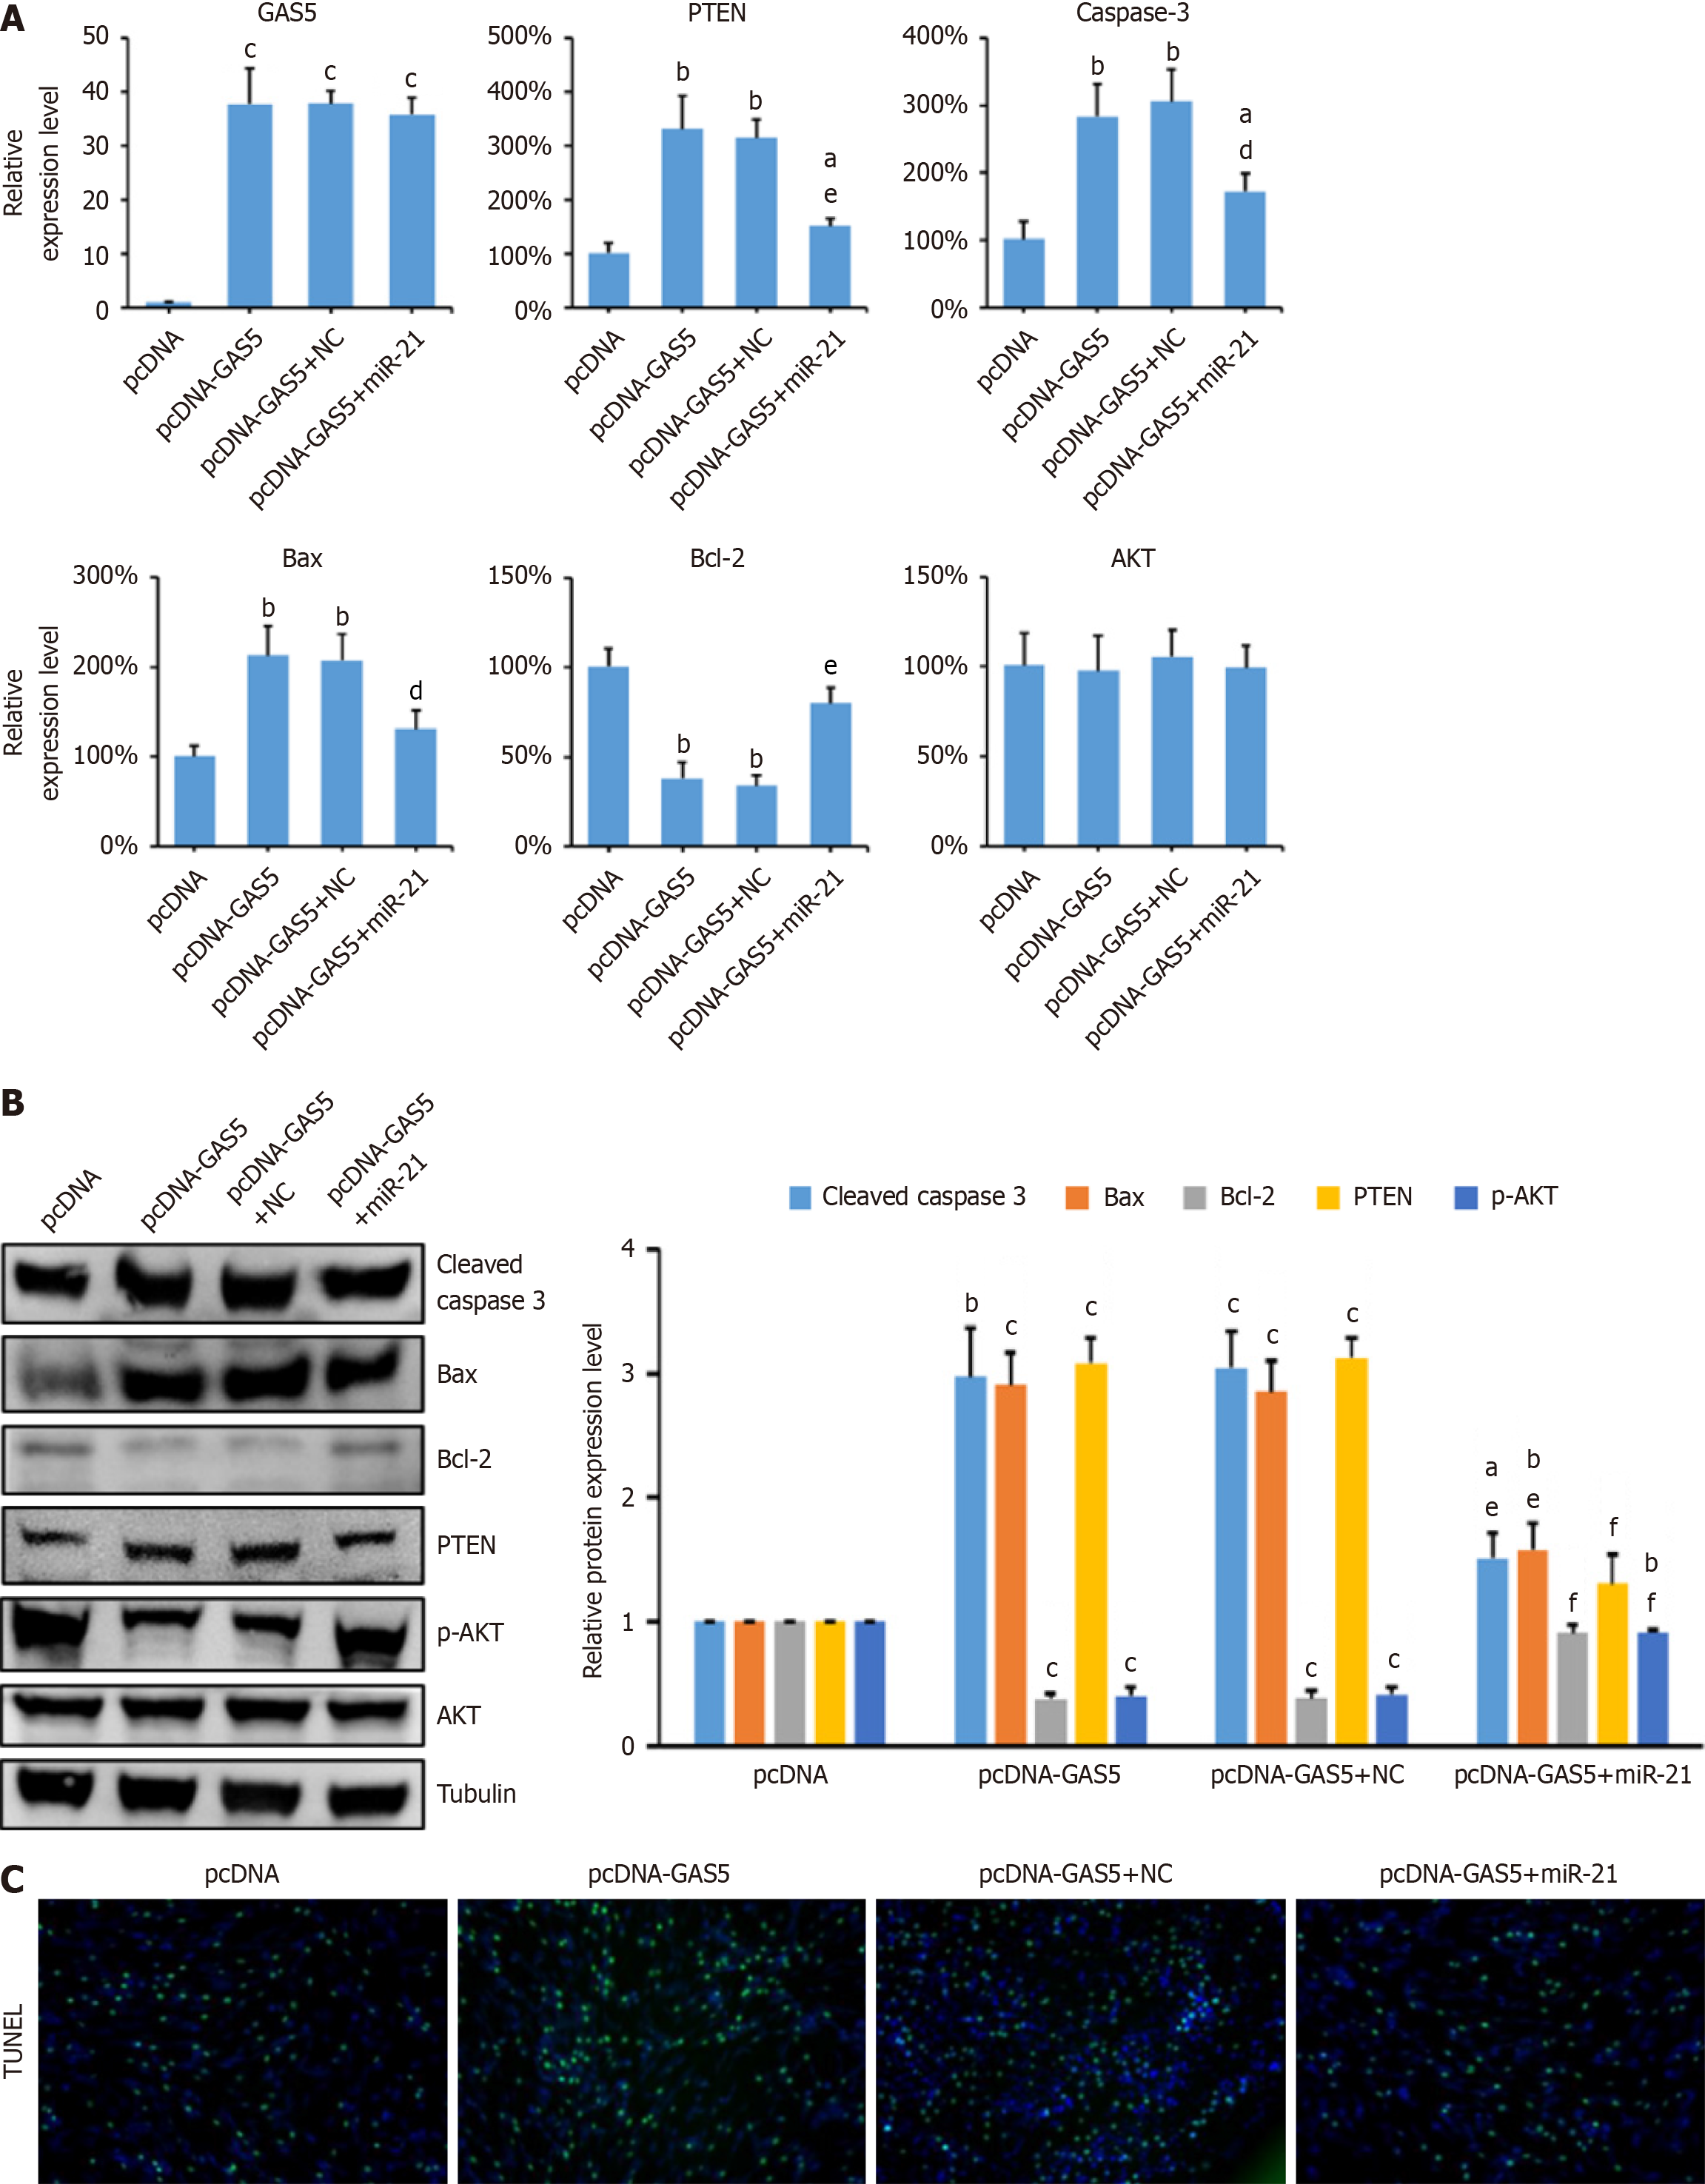
Figure 5 Growth arrest-specific transcript 5 activates the PTEN/AKT pathway via microRNA 21.
A: Relative expression levels of growth arrest-specific transcript 5 (GAS5), phosphatase and tensin homolog (PTEN), cleaved caspase-3, B-cell lymphoma 2 (Bcl-2), Bcl-2-associated X protein (Bax), AKT, and phosphorylated AKT (p-AKT) in PC12 cells transfected with GAS5 and microRNA (miR)-21 mimics (n = 3 per group); B: Relative protein expression levels of PTEN, cleaved caspase-3, Bcl-2, Bax, AKT, and p-AKT in PC12 cells transfected with GAS5 and miR-21 mimics (n = 3 per group); C: TUNEL staining of PC12 cells transfected with GAS5 and miR-21 mimics. Data are presented as the mean ± SD. aP < 0.05, bP < 0.01, and cP < 0.001 vs pcDNA group; dP < 0.05, eP < 0.01 and fP < 0.001 vs pcDNA-GAS5 + negative control group.
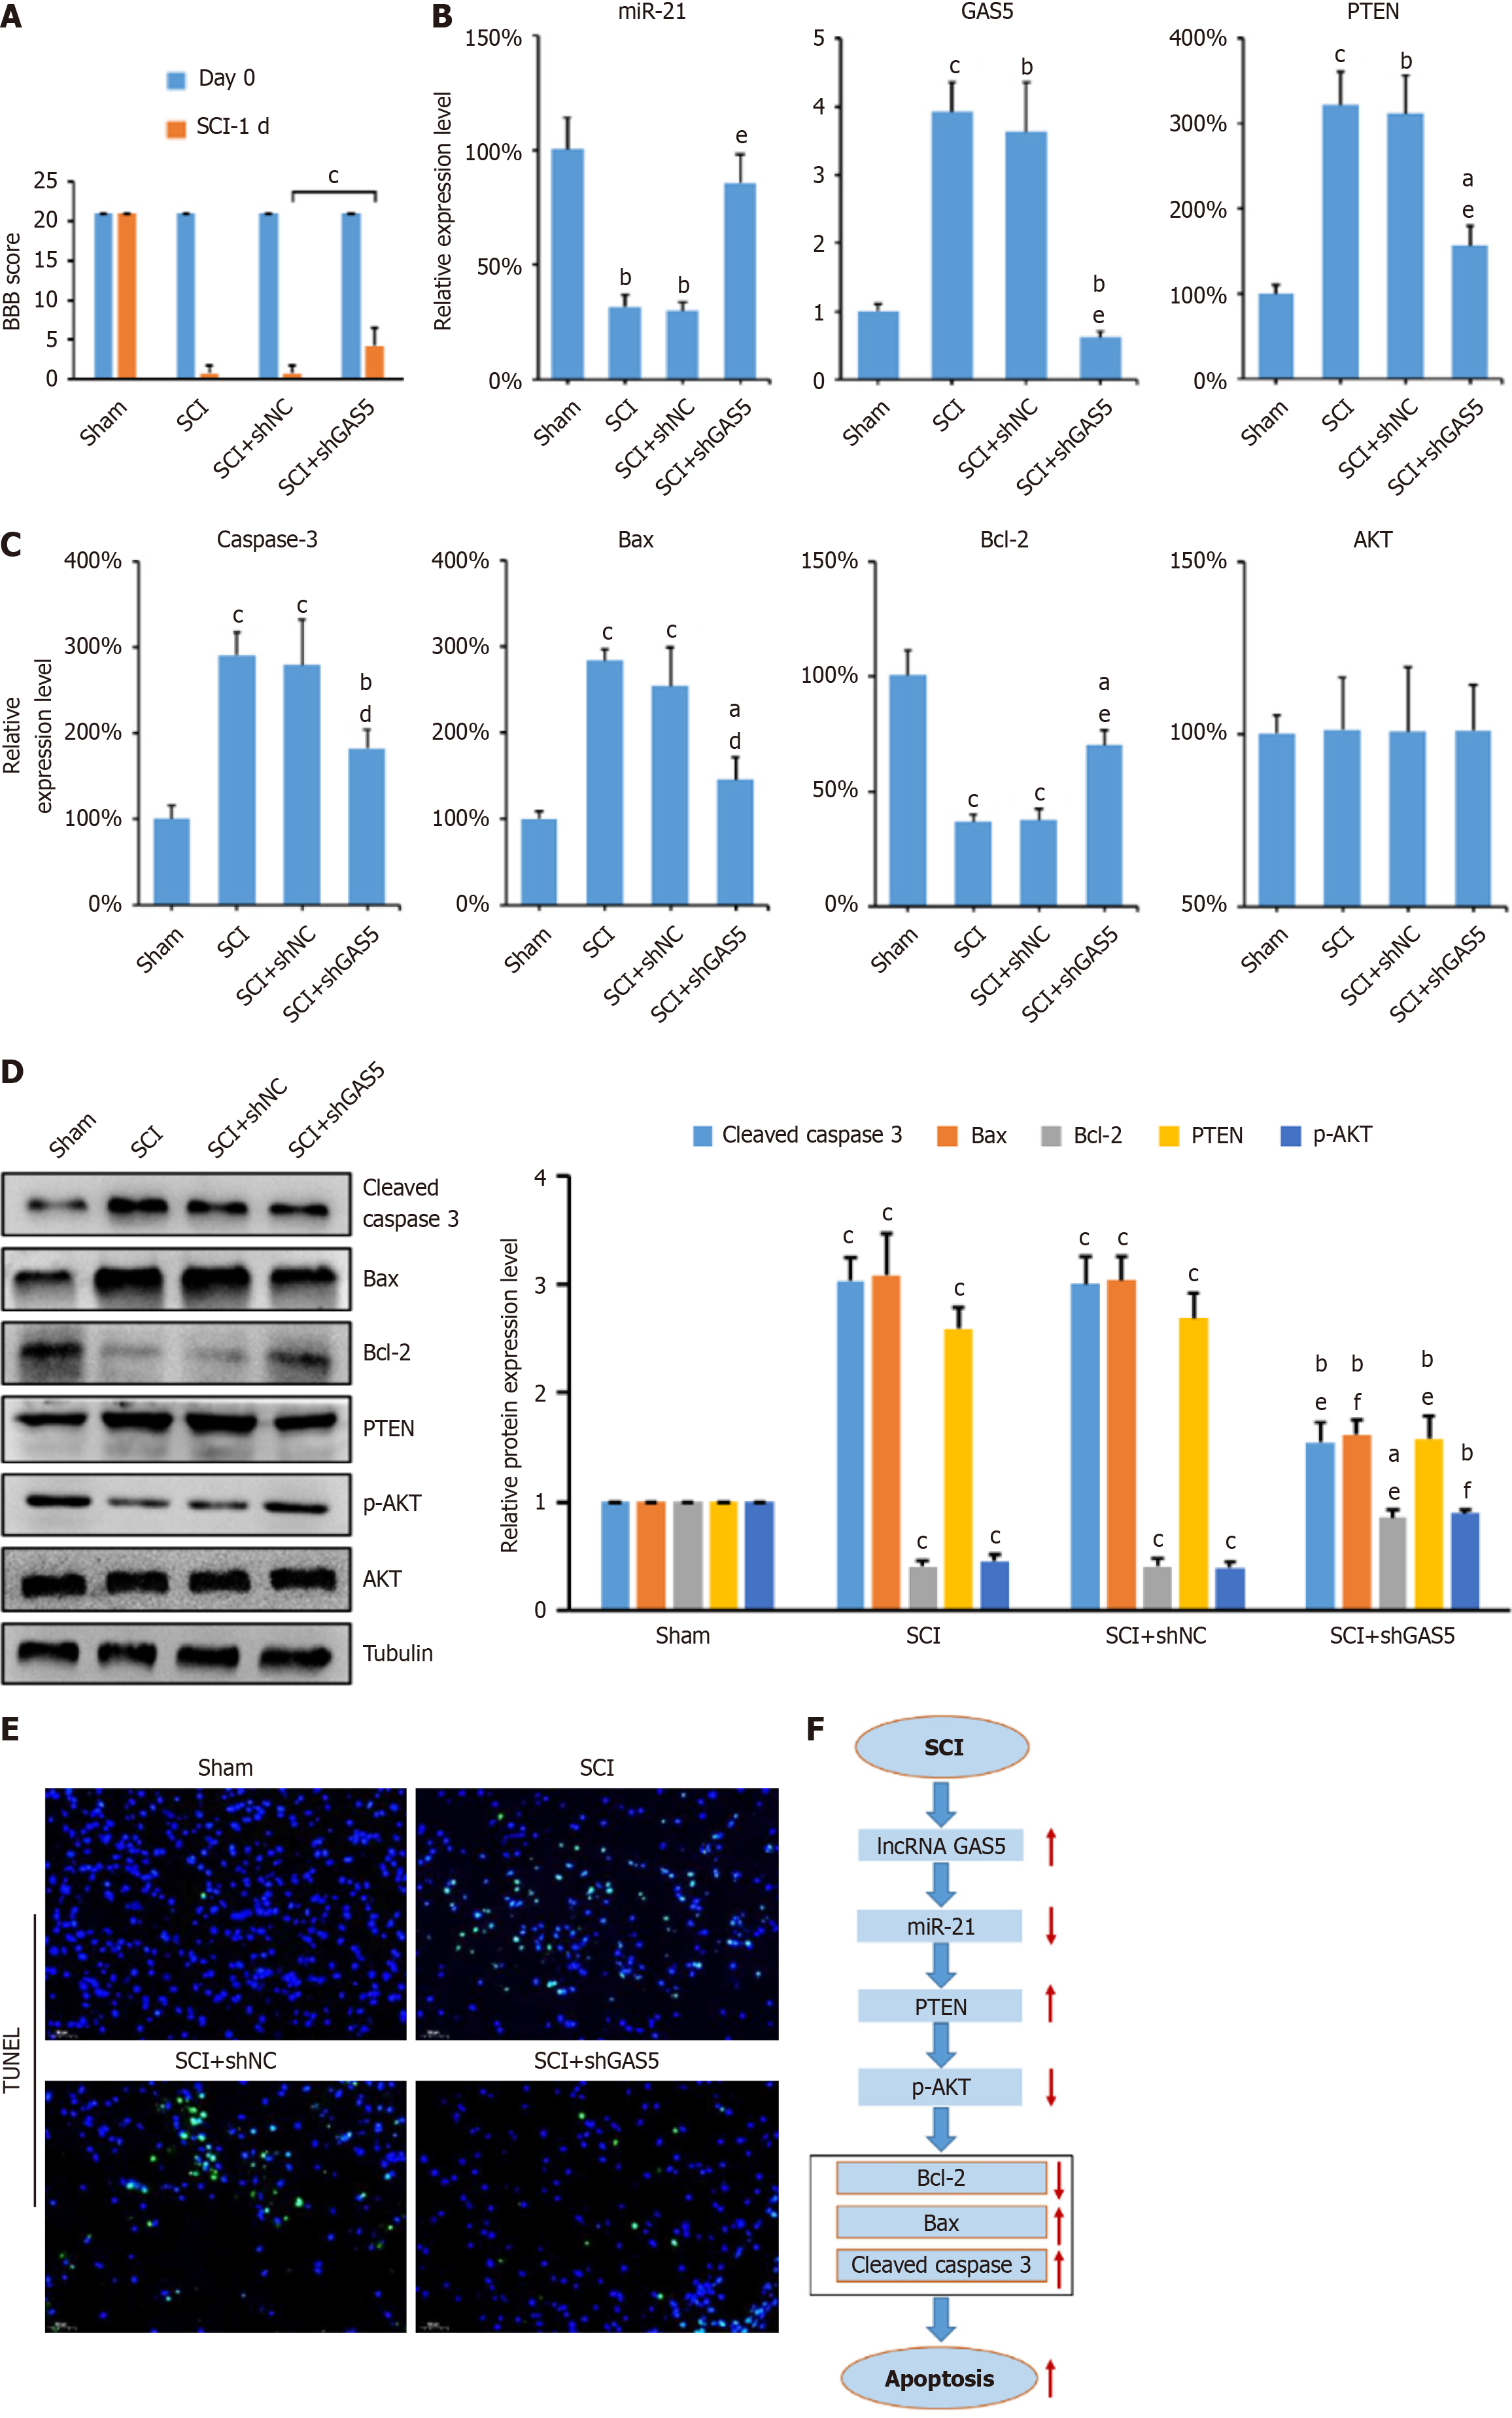
Figure 6 Downregulation of growth arrest-specific transcript 5 attenuates neuronal apoptosis in the spinal cord of spinal cord injury rats via the microRNA 21/phosphatase and tensin homolog axis.
A: Basso, Beattie, and Bresnahan (BBB) locomotor scores for spinal cord injury (SCI) rats treated with short hairpin growth arrest-specific transcript 5 (shGAS5) or short hairpin negative control (shNC) lentivirus (n = 6 per group); B and C: Relative expression levels of microRNA (miR)-21, GAS5, PTEN, caspase-3, B-cell lymphoma 2 (Bcl-2), Bcl-2-associated X protein (Bax), and AKT in spinal cord tissues from SCI rats treated with shGAS5 or shNC lentivirus (n = 6 per group); D: Protein expression levels of cleaved caspase-3, Bcl-2, Bax, PTEN, AKT, and phosphorylated AKT (p-AKT) in spinal cord tissues, analyzed by Western blotting (n = 6 per group); E: TUNEL staining of spinal cord tissues from SCI rats treated with shGAS5 or shNC lentivirus; F: Schematic diagram illustrating the mechanism of GAS5 in SCI-induced neuronal apoptosis. Data are presented as the mean ± SD. aP < 0.05, bP < 0.01, and cP < 0.001 vs sham group; eP < 0.05, fP < 0.01 and gP < 0.001 vs SCI + shNC group.
- Citation: Wang YJ, Zhi ZZ, Liu T, Kang J, Xu GH. Long non-coding RNA GAS5 promotes neuronal apoptosis in spinal cord injury via the miR-21/PTEN axis. World J Orthop 2025; 16(5): 106183
- URL: https://www.wjgnet.com/2218-5836/full/v16/i5/106183.htm
- DOI: https://dx.doi.org/10.5312/wjo.v16.i5.106183


