Copyright
©The Author(s) 2025.
World J Orthop. Feb 18, 2025; 16(2): 102856
Published online Feb 18, 2025. doi: 10.5312/wjo.v16.i2.102856
Published online Feb 18, 2025. doi: 10.5312/wjo.v16.i2.102856
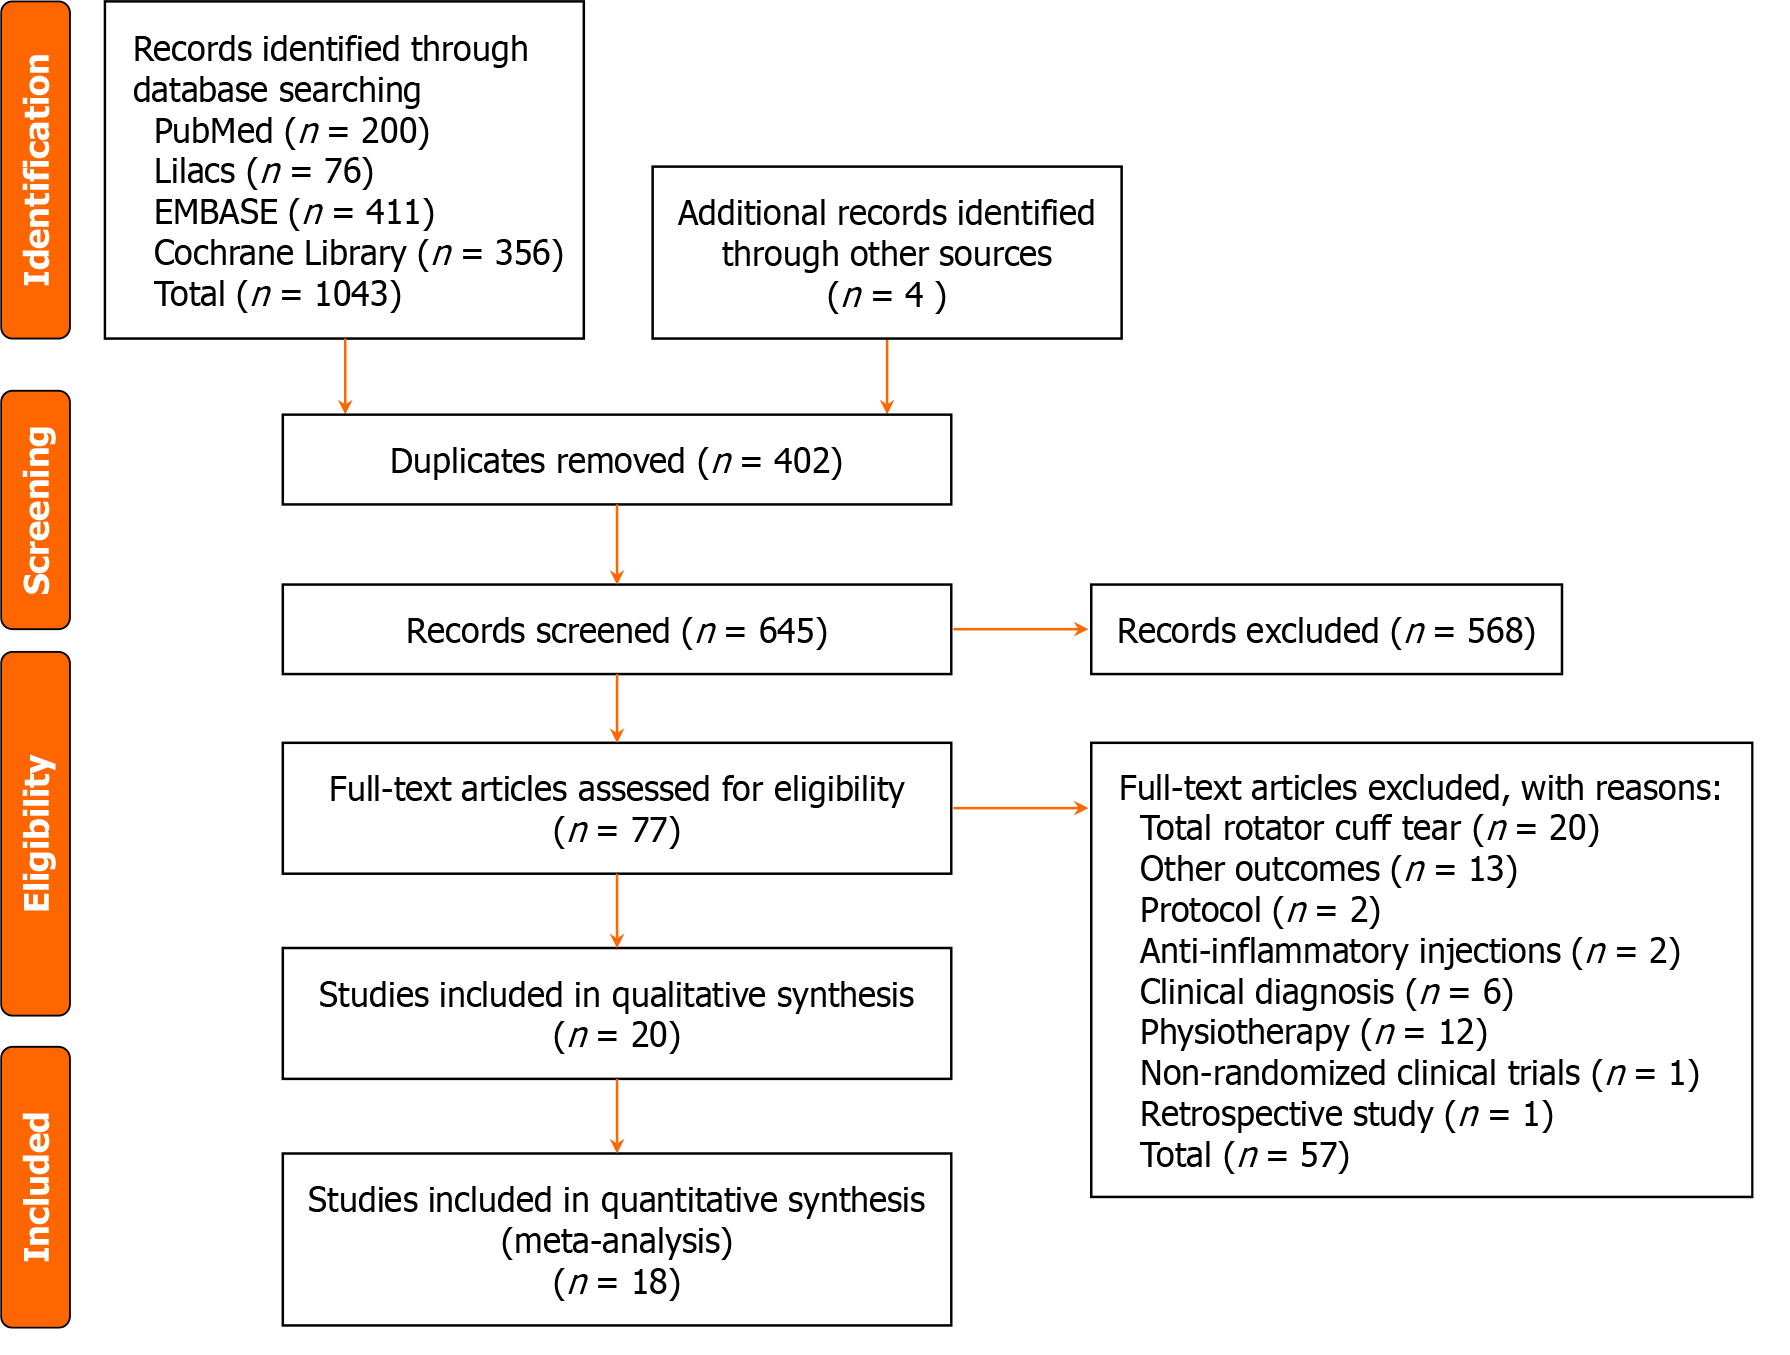
Figure 1
PRISMA flowchart shows the number of articles (n) in the different selection stages of the selection process.
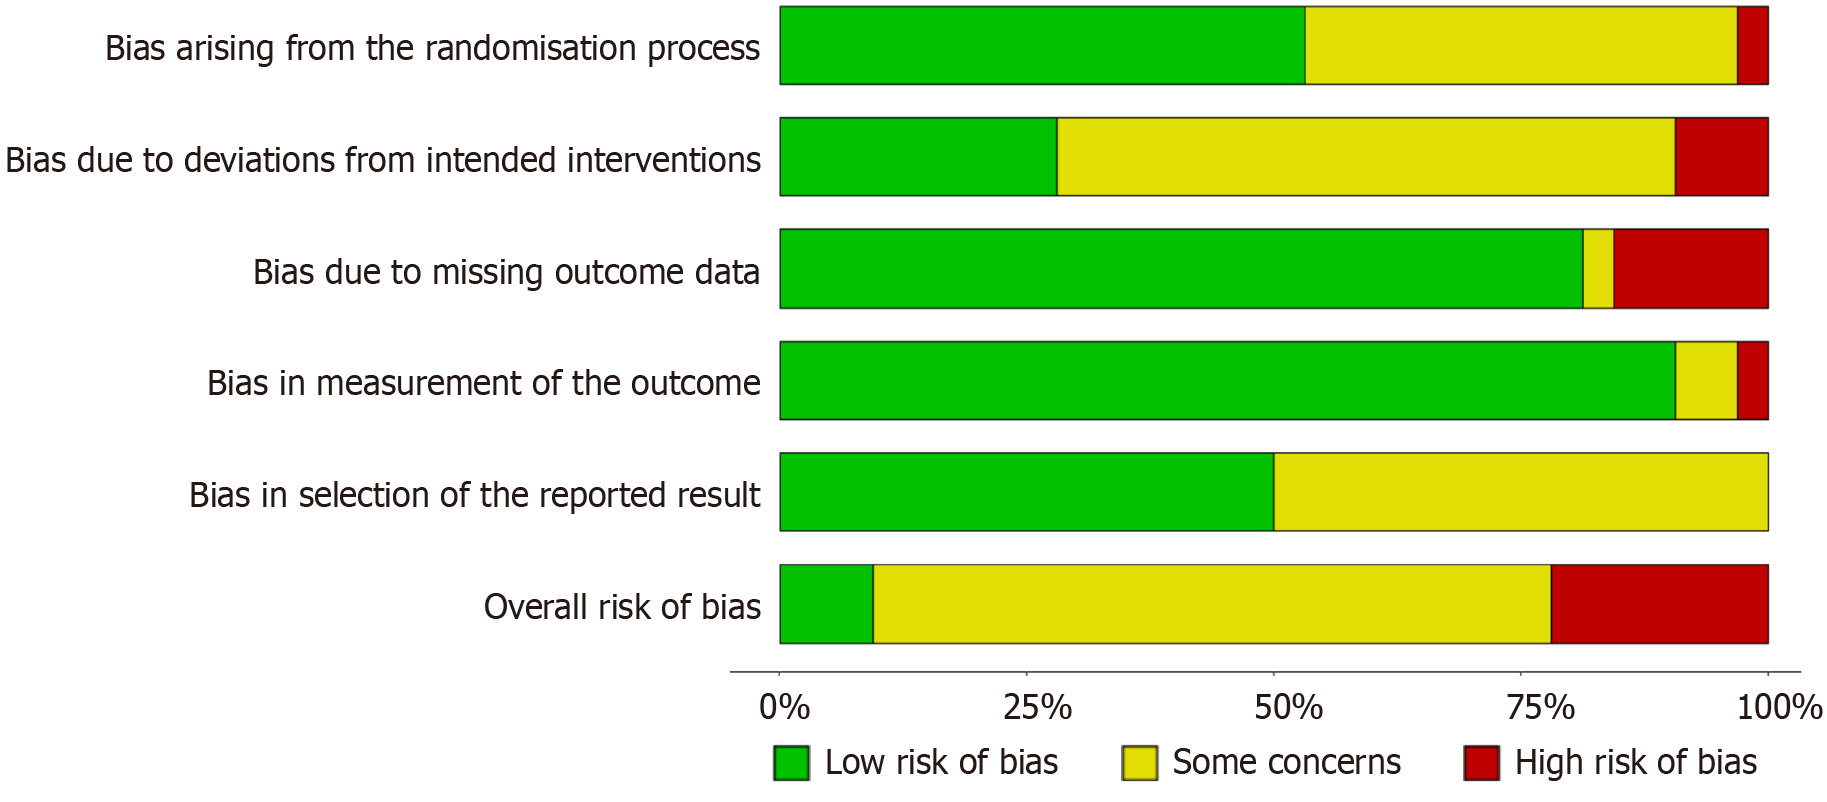
Figure 2
The general risk of bias.
Figure 3
The detailed risk of bias for each study.
- Citation: Goulart LT, Matsunaga FT, Belloti JC, Netto NA, Paim TS, Tamaoki MJS. Effectiveness of sub-acromial injections in rotator cuff injuries: A systematic review and meta-analysis. World J Orthop 2025; 16(2): 102856
- URL: https://www.wjgnet.com/2218-5836/full/v16/i2/102856.htm
- DOI: https://dx.doi.org/10.5312/wjo.v16.i2.102856


