Copyright
©The Author(s) 2025.
World J Orthop. Feb 18, 2025; 16(2): 102483
Published online Feb 18, 2025. doi: 10.5312/wjo.v16.i2.102483
Published online Feb 18, 2025. doi: 10.5312/wjo.v16.i2.102483
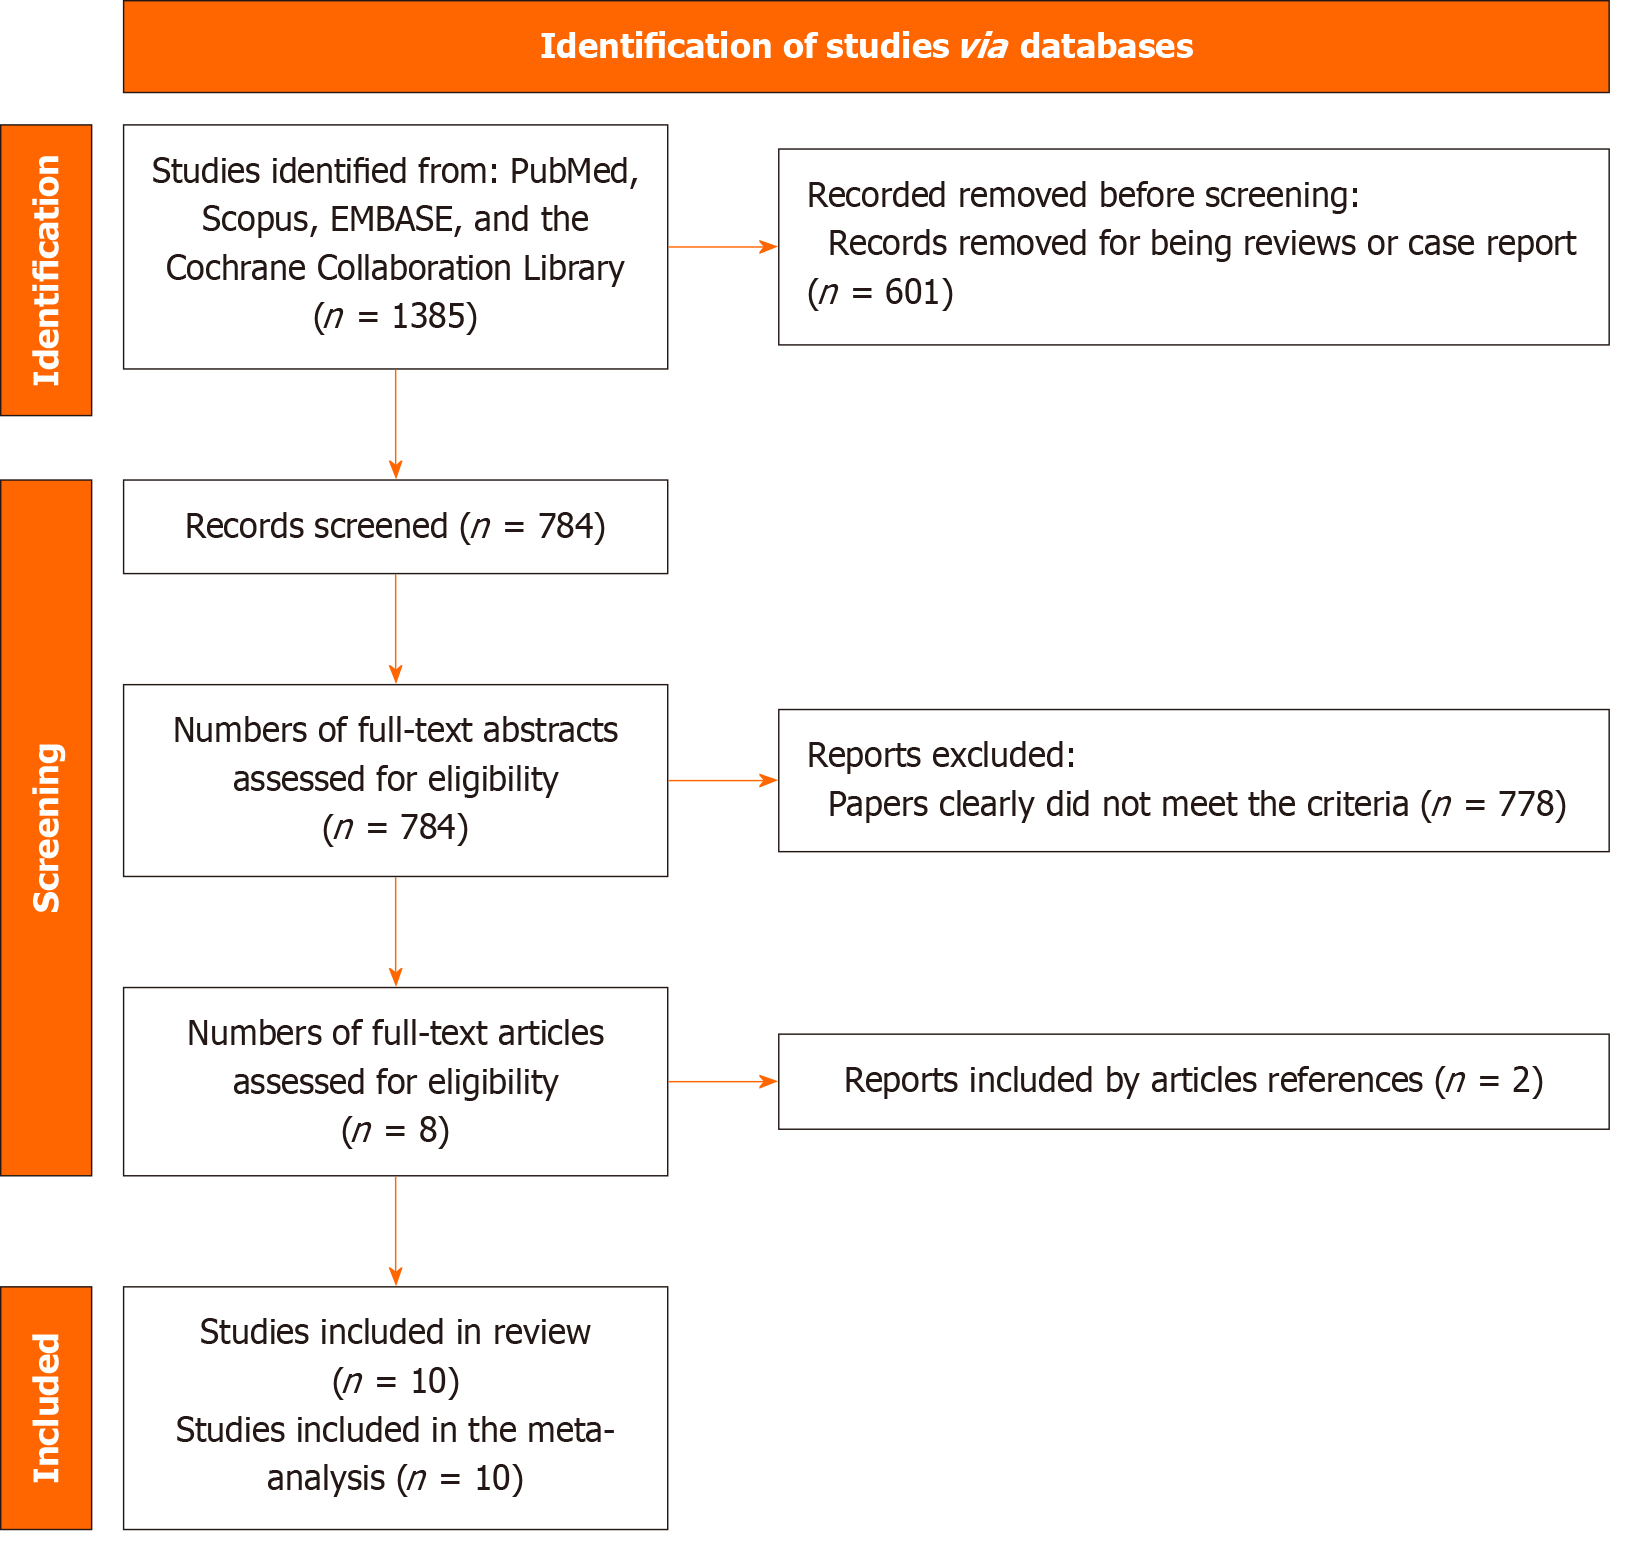
Figure 1 Study selection flow diagram.
This flow diagram illustrates the study selection process according to the Preferred Reporting Items for Systematic reviews and Meta-Analyses guidelines. It depicts the number of records identified through database searching, the number of records screened, the number of full-text articles assessed for eligibility, the number of studies included in the meta-analysis, and the reasons for exclusion at each stage.
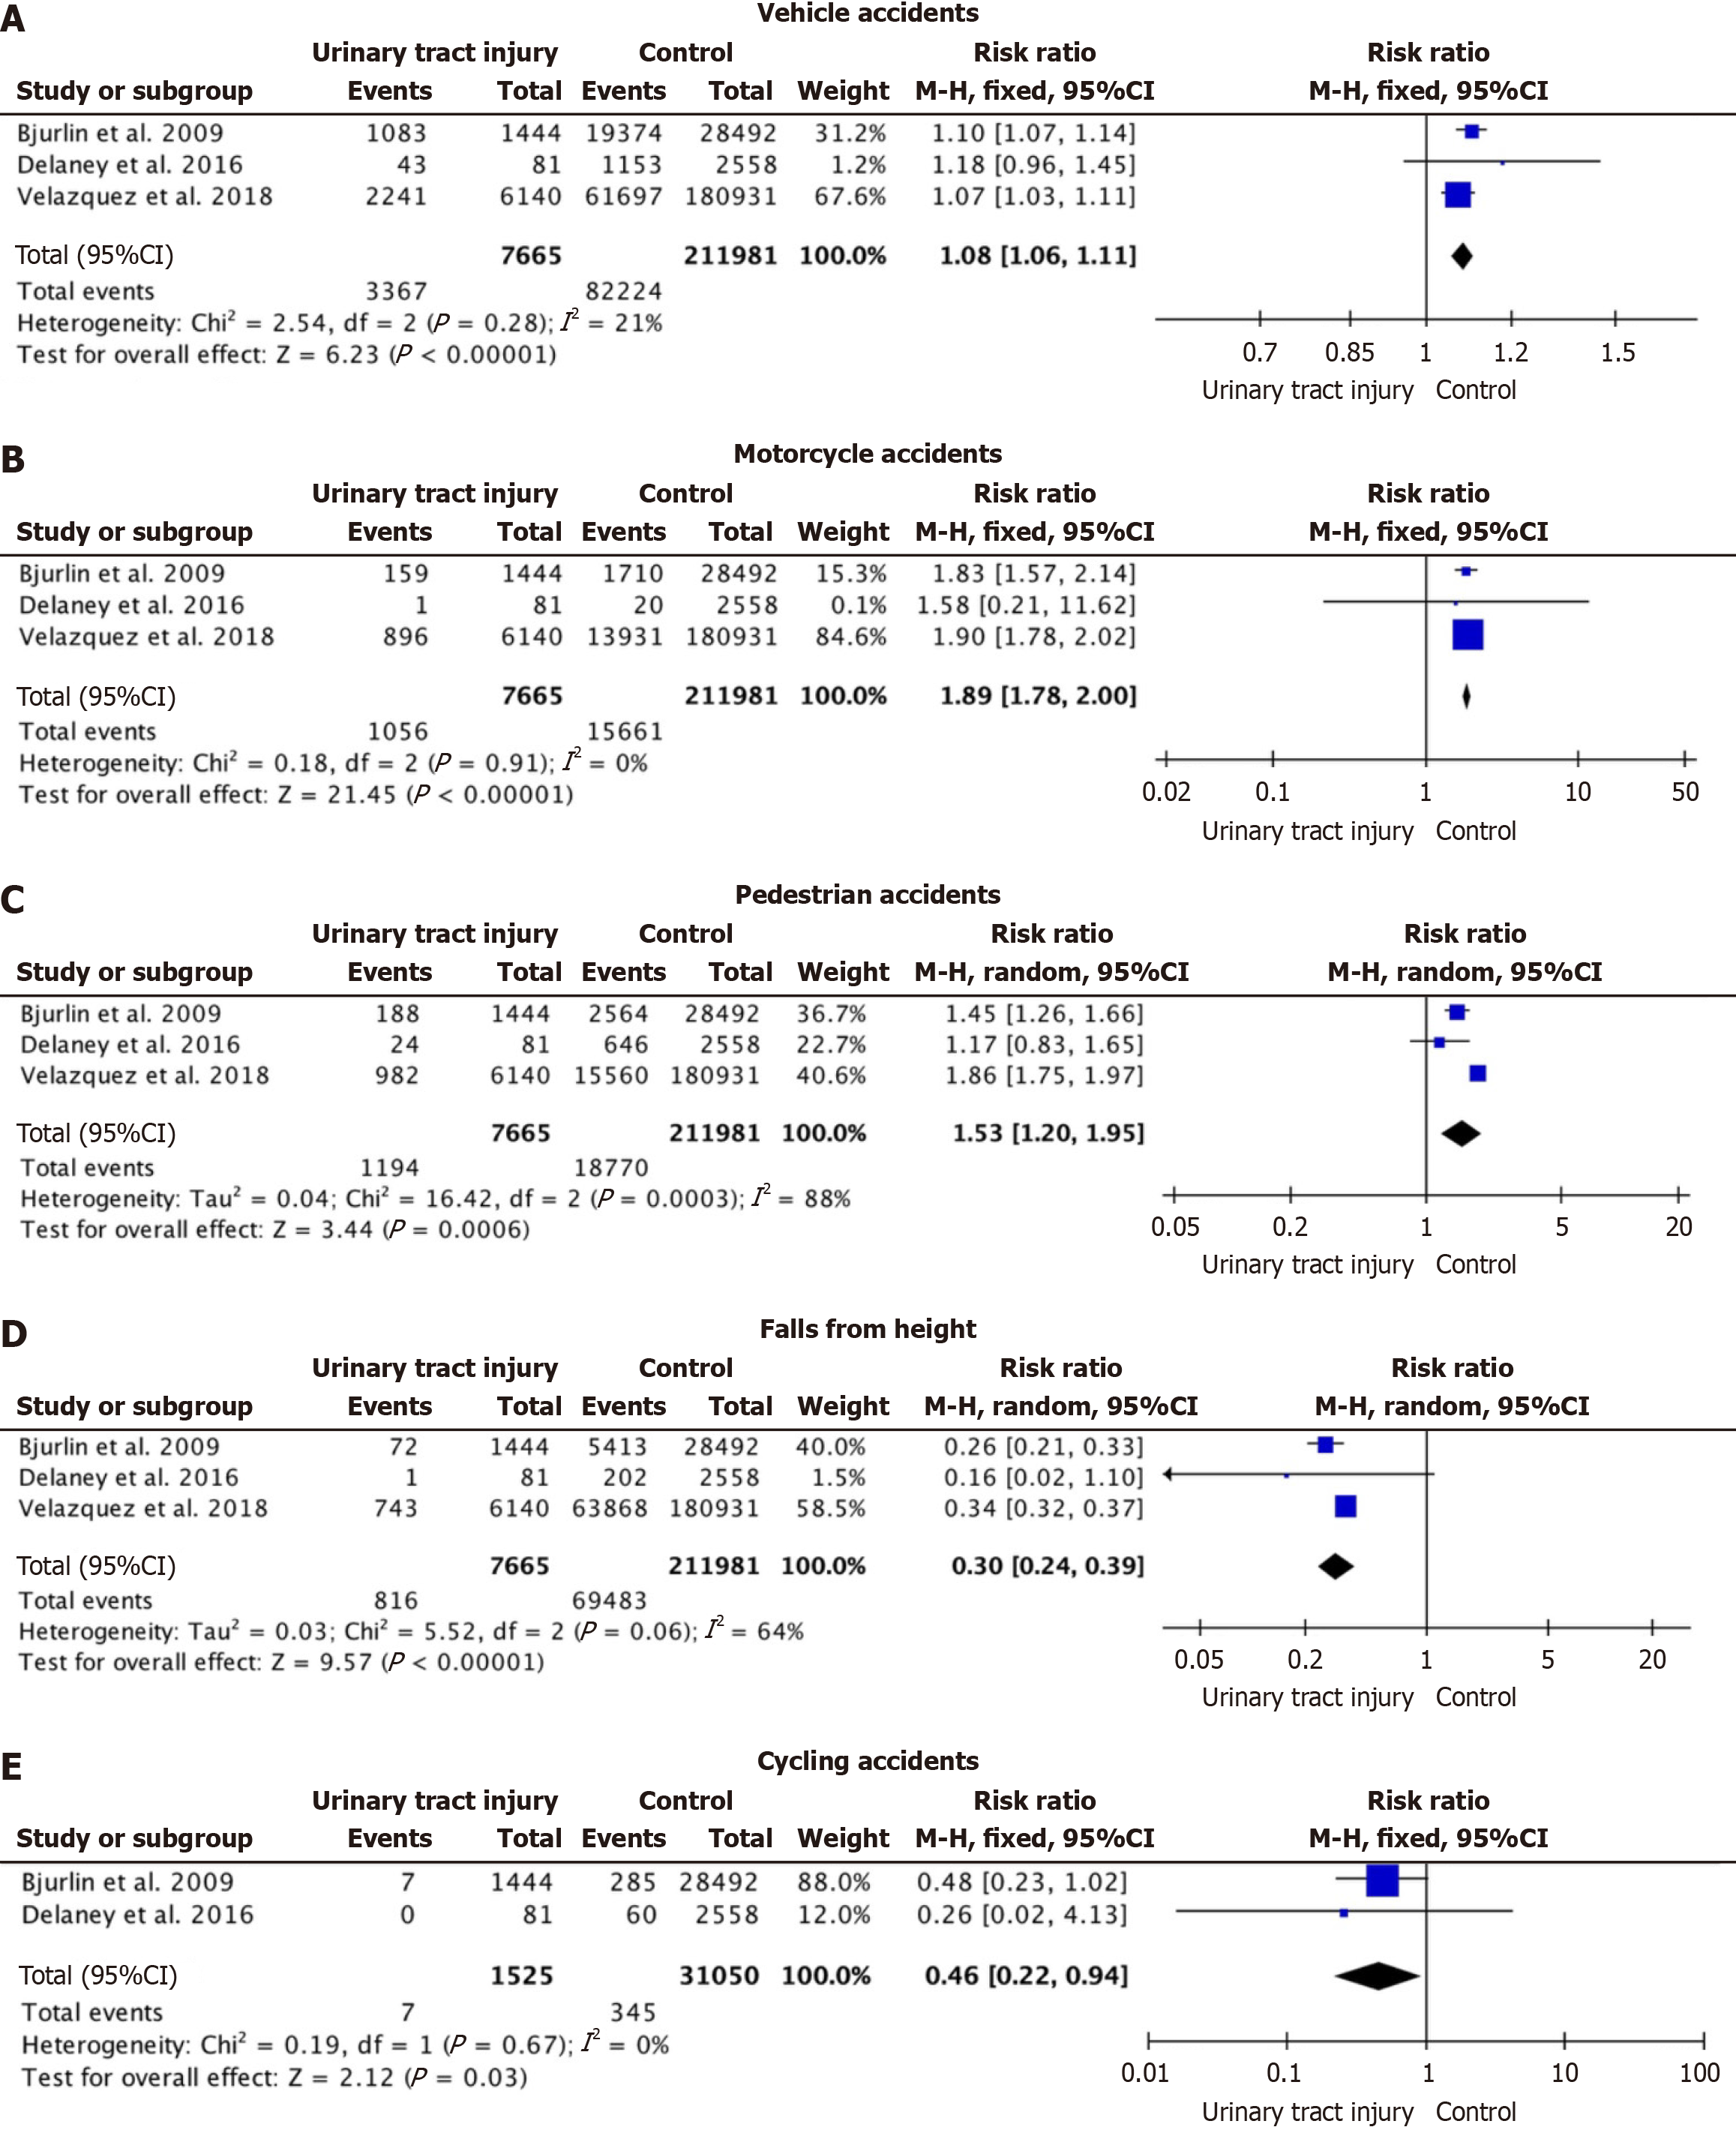
Figure 2 Forest plots showing the association between mechanism of injury and urinary tract injury in patients with pelvic fractures.
The forest plots display the relative risk (RR) of urinary tract injury for different mechanisms of injury. A: Vehicle accidents; B: Motorcycle accidents; C: Pedestrian accidents; D: Falls from height; E: Cycling accidents. The squares represent the point estimate of the RR for each study, with the size of the square proportional to the study's weight in the meta-analysis. The horizontal lines represent the 95%CI. The diamond represents the pooled RR, with its width representing the 95%CI.
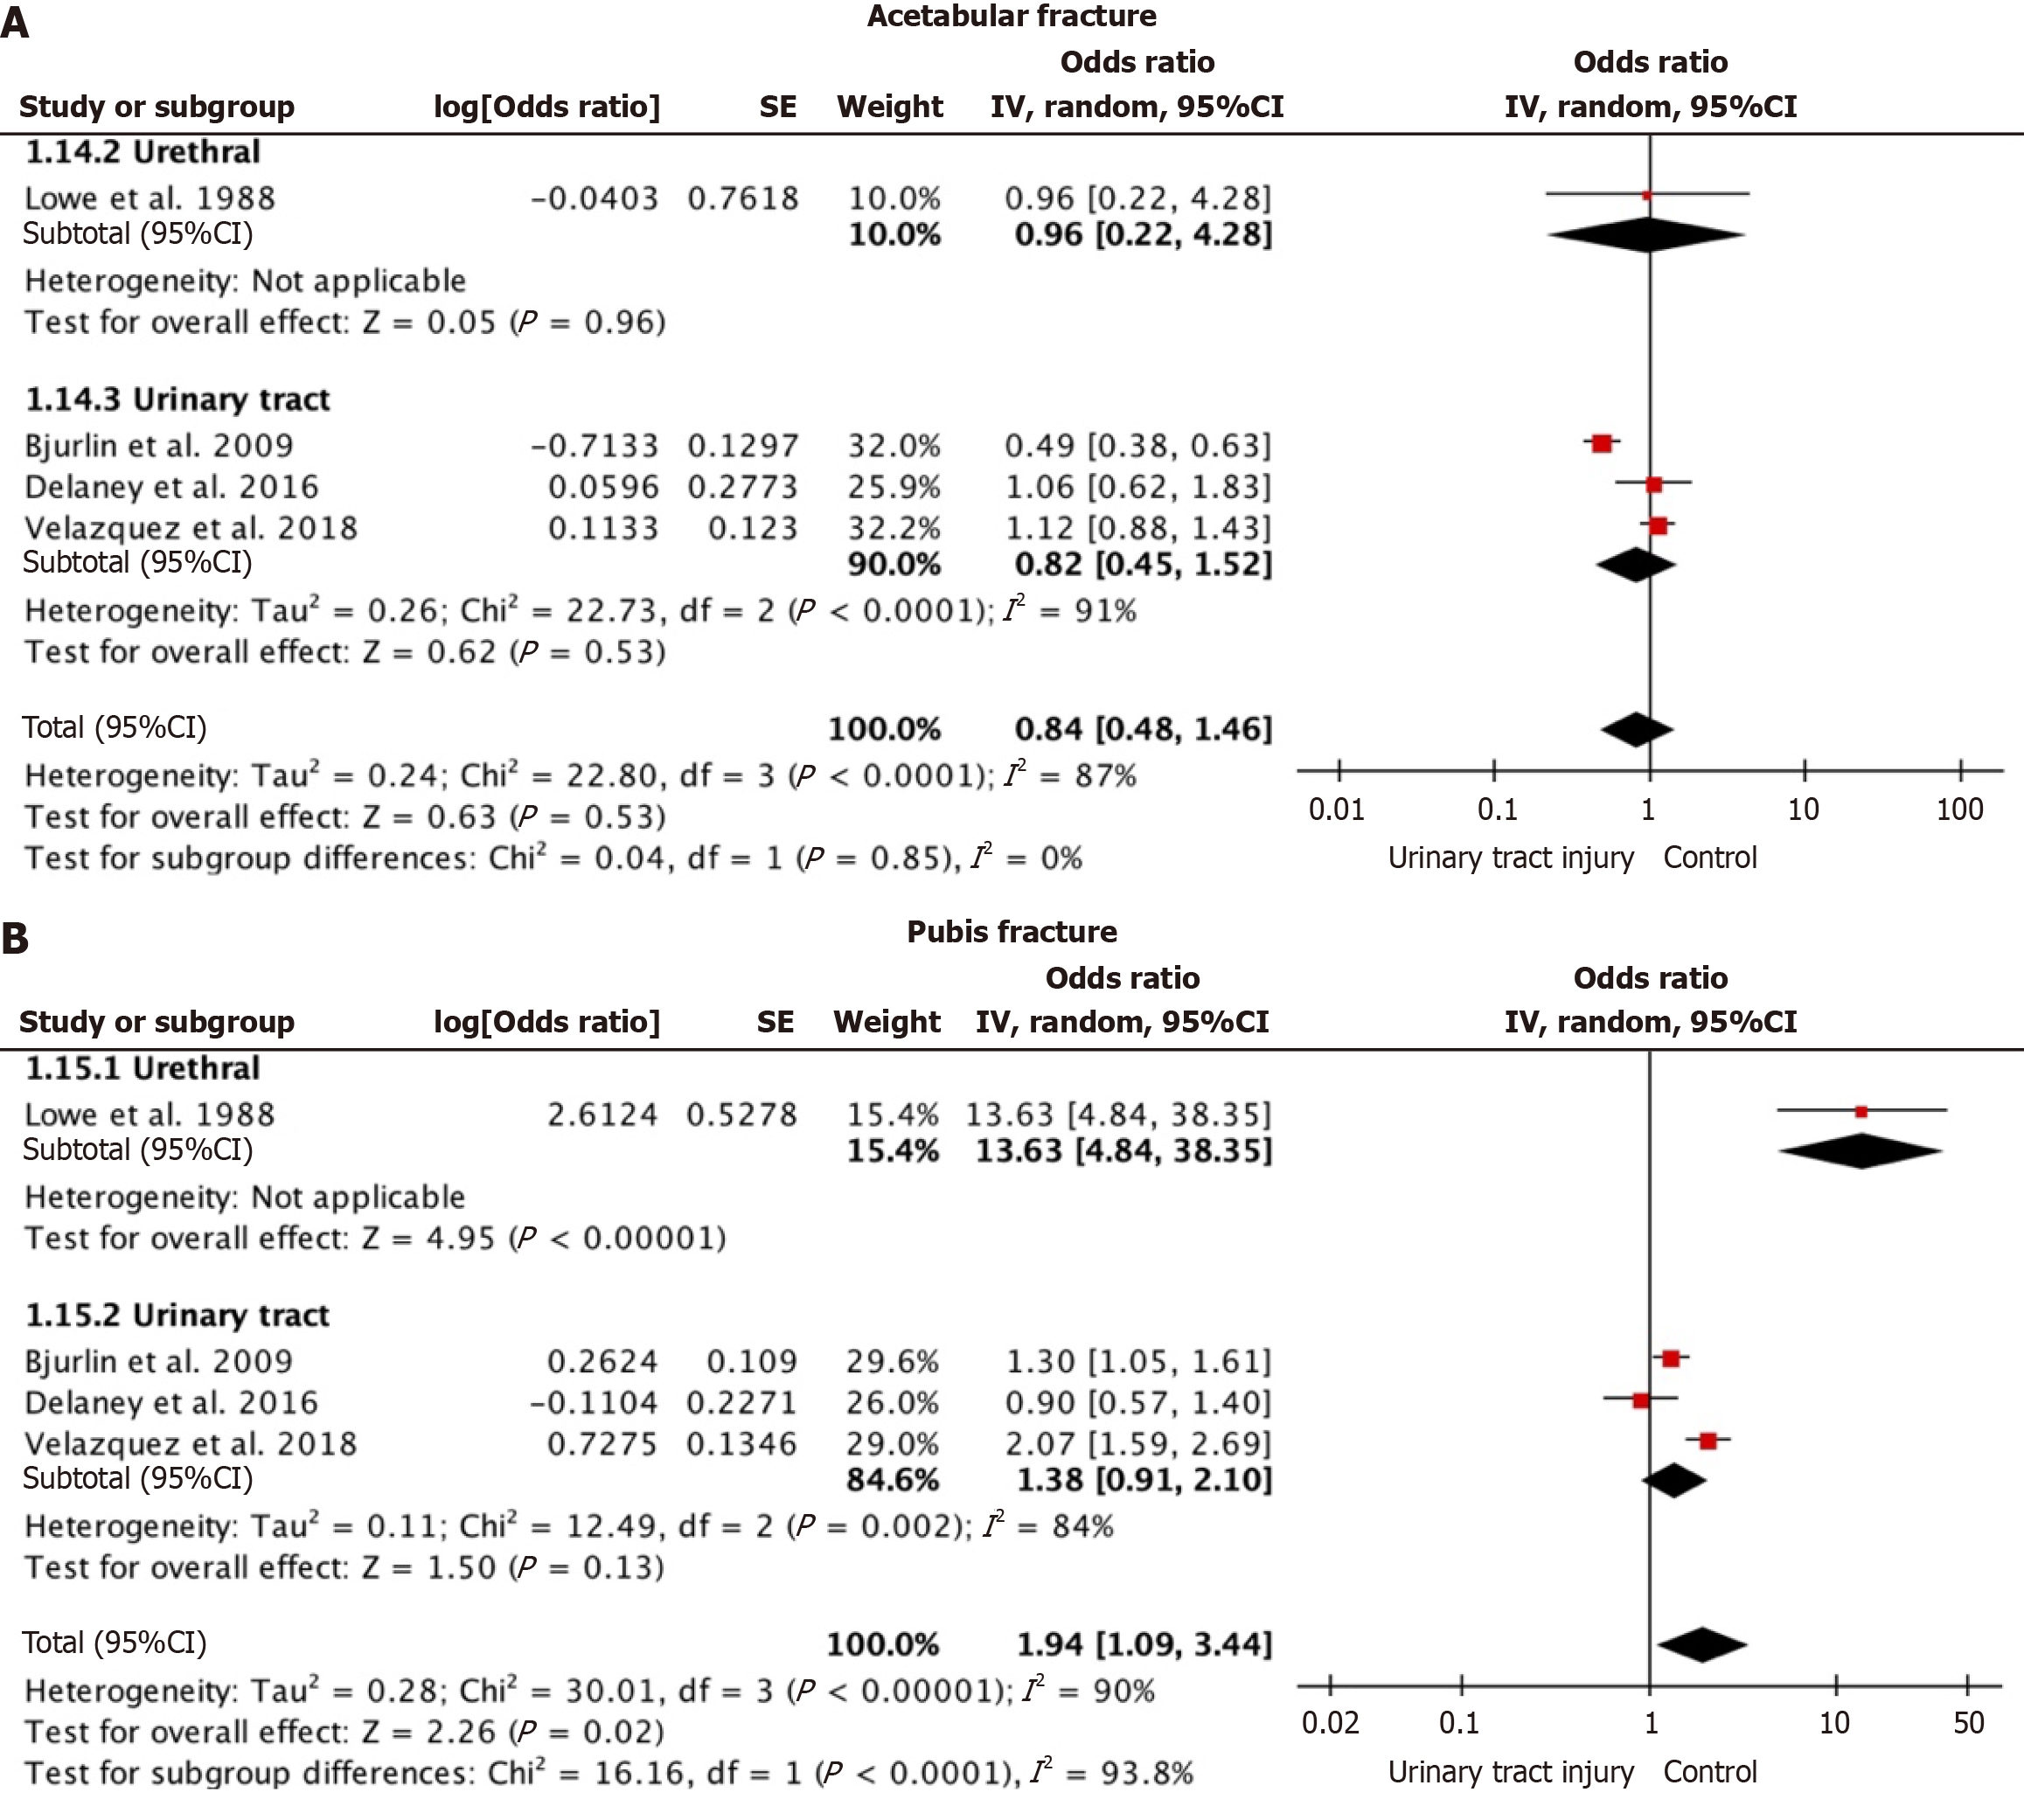
Figure 3 Forest plots showing the association between fracture type and urinary tract injury in patients with pelvic fractures.
A: Acetabulum fracture; B: Pubic fracture. The squares represent the point estimate of the odds ratio (OR) for each study, with the size of the square proportional to the study's weight in the meta-analysis. The horizontal lines represent the 95%CI. The diamond represents the pooled OR, with its width representing the 95%CI. Pubic fracture analysis includes a subgroup analysis for urethral injury.
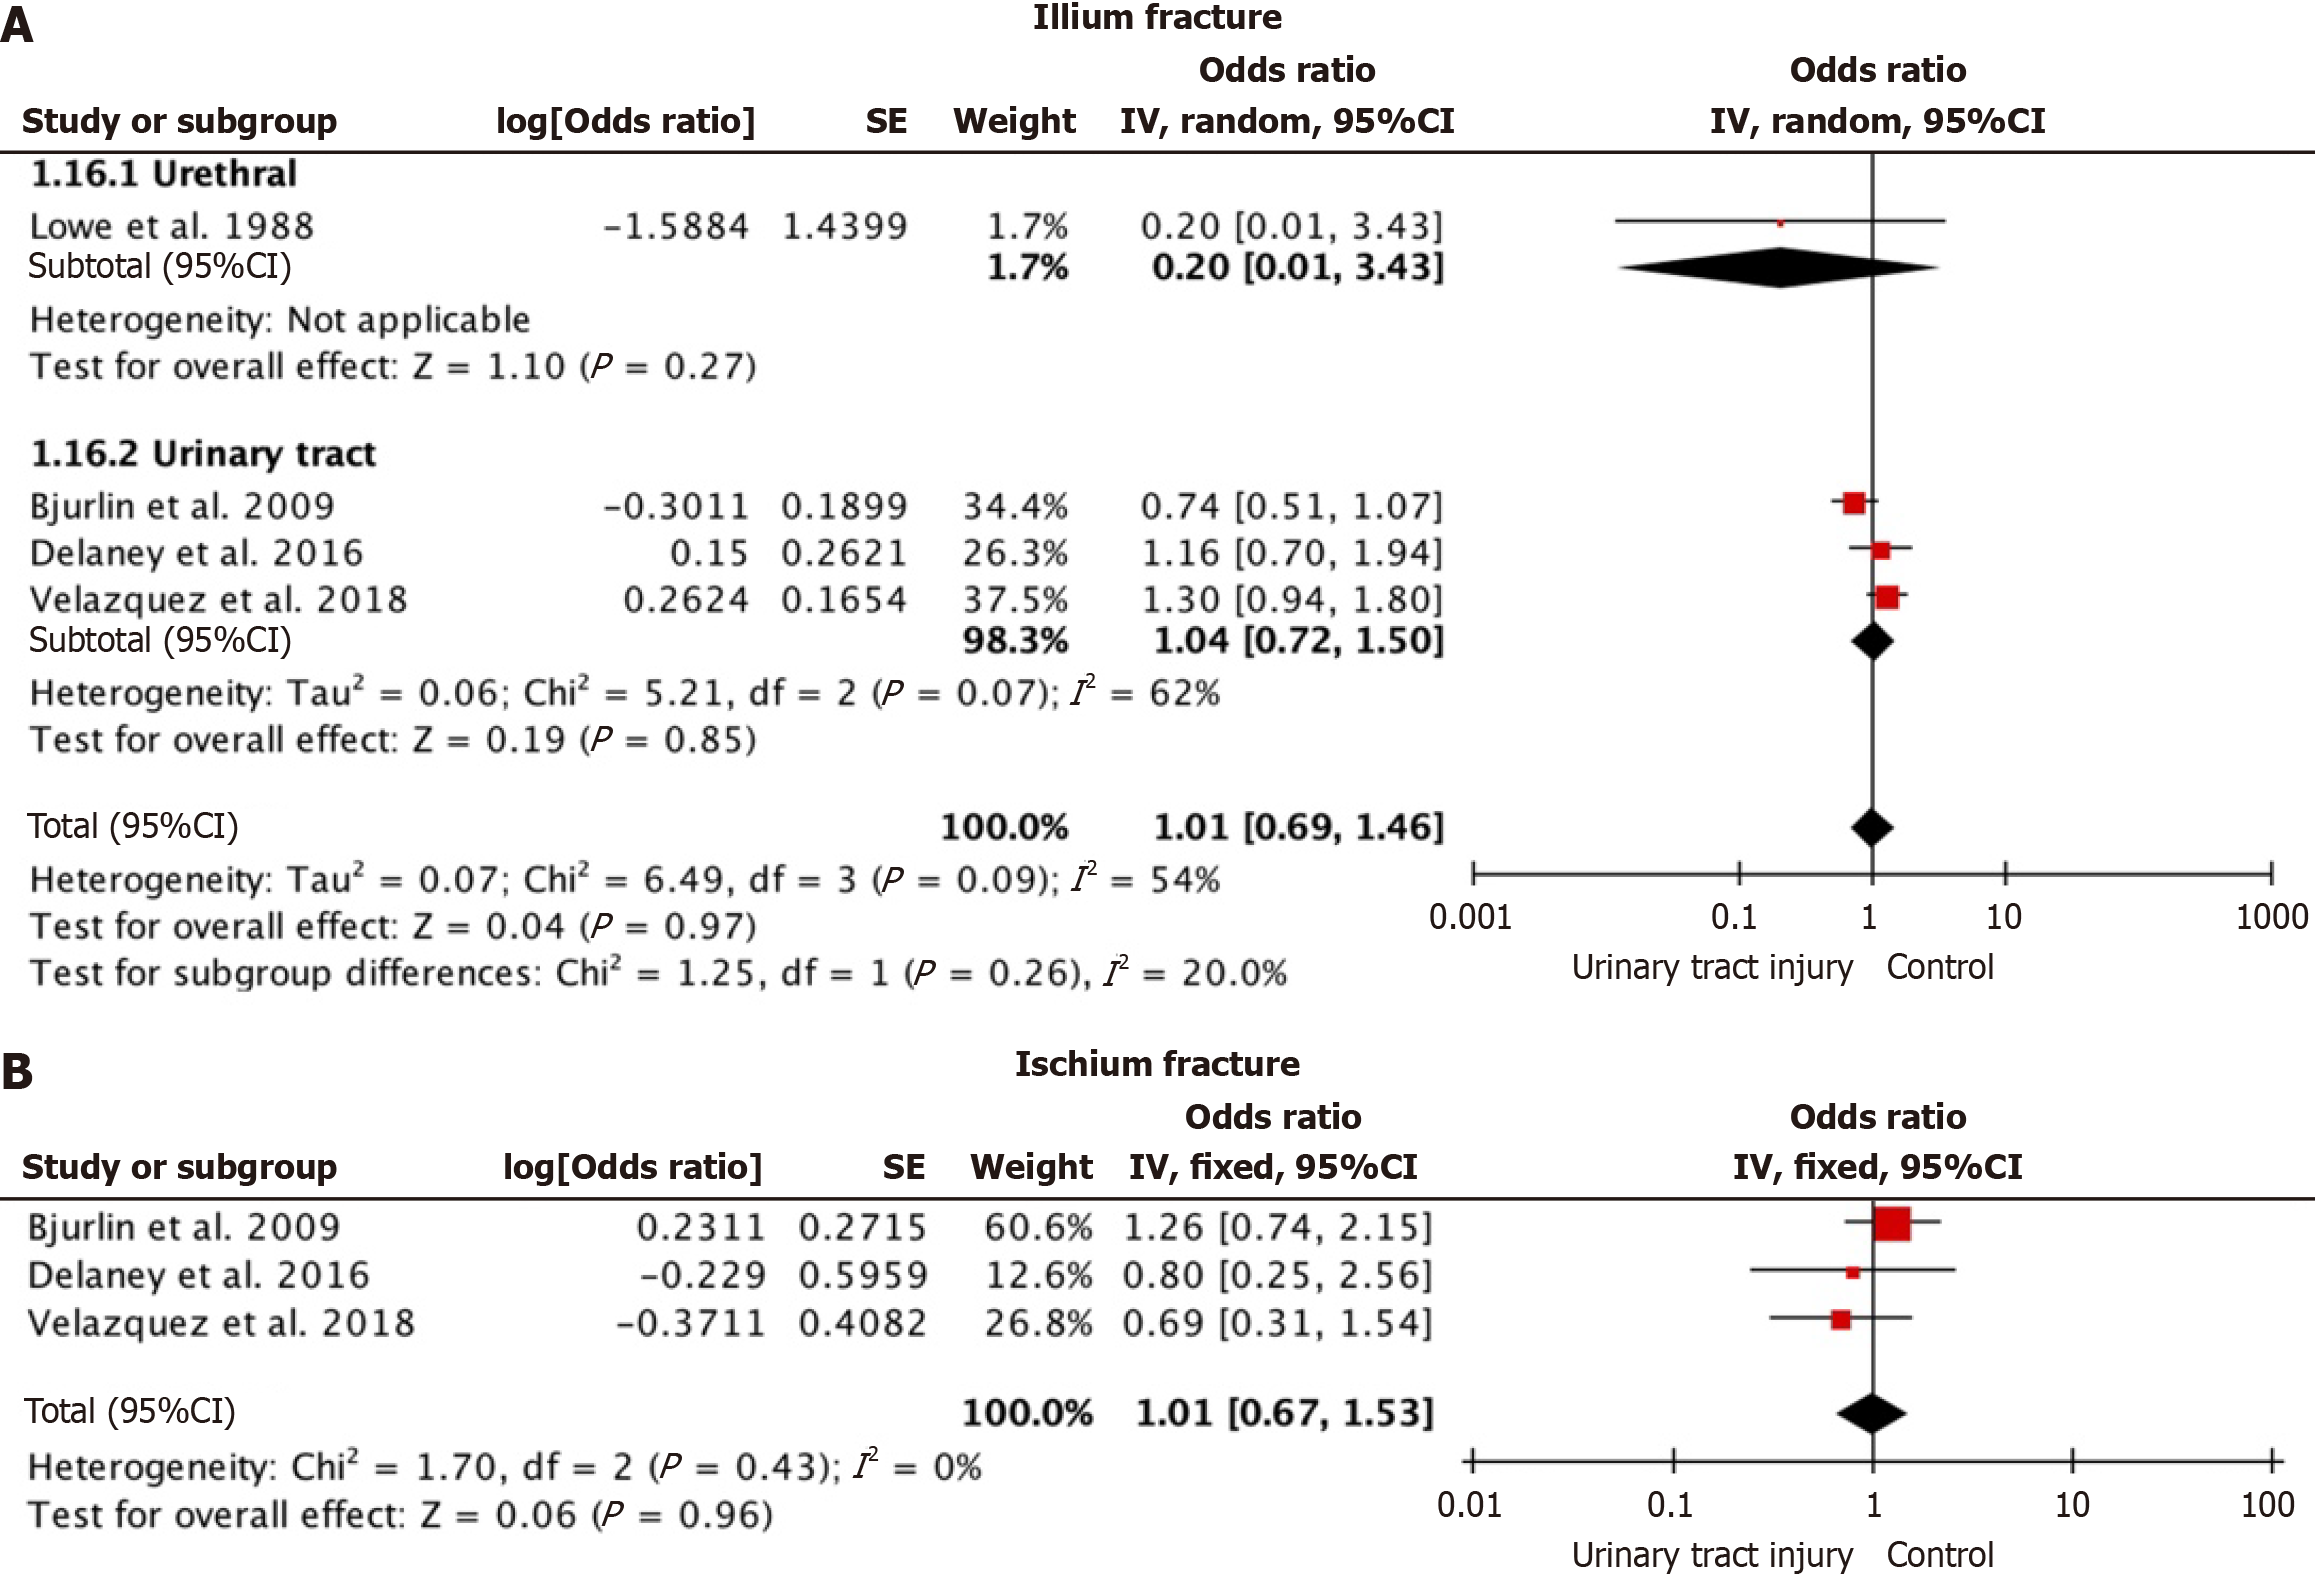
Figure 4 Forest plots showing the association between fracture type and urinary tract injury in patients with pelvic fractures.
A: Ilium fracture; B: Ischium fracture. The squares represent the point estimate of the odds ratio (OR) for each study, with the size of the square proportional to the study's weight in the meta-analysis. The horizontal lines represent the 95%CI. The diamond represents the pooled OR, with its width representing the 95%CI.
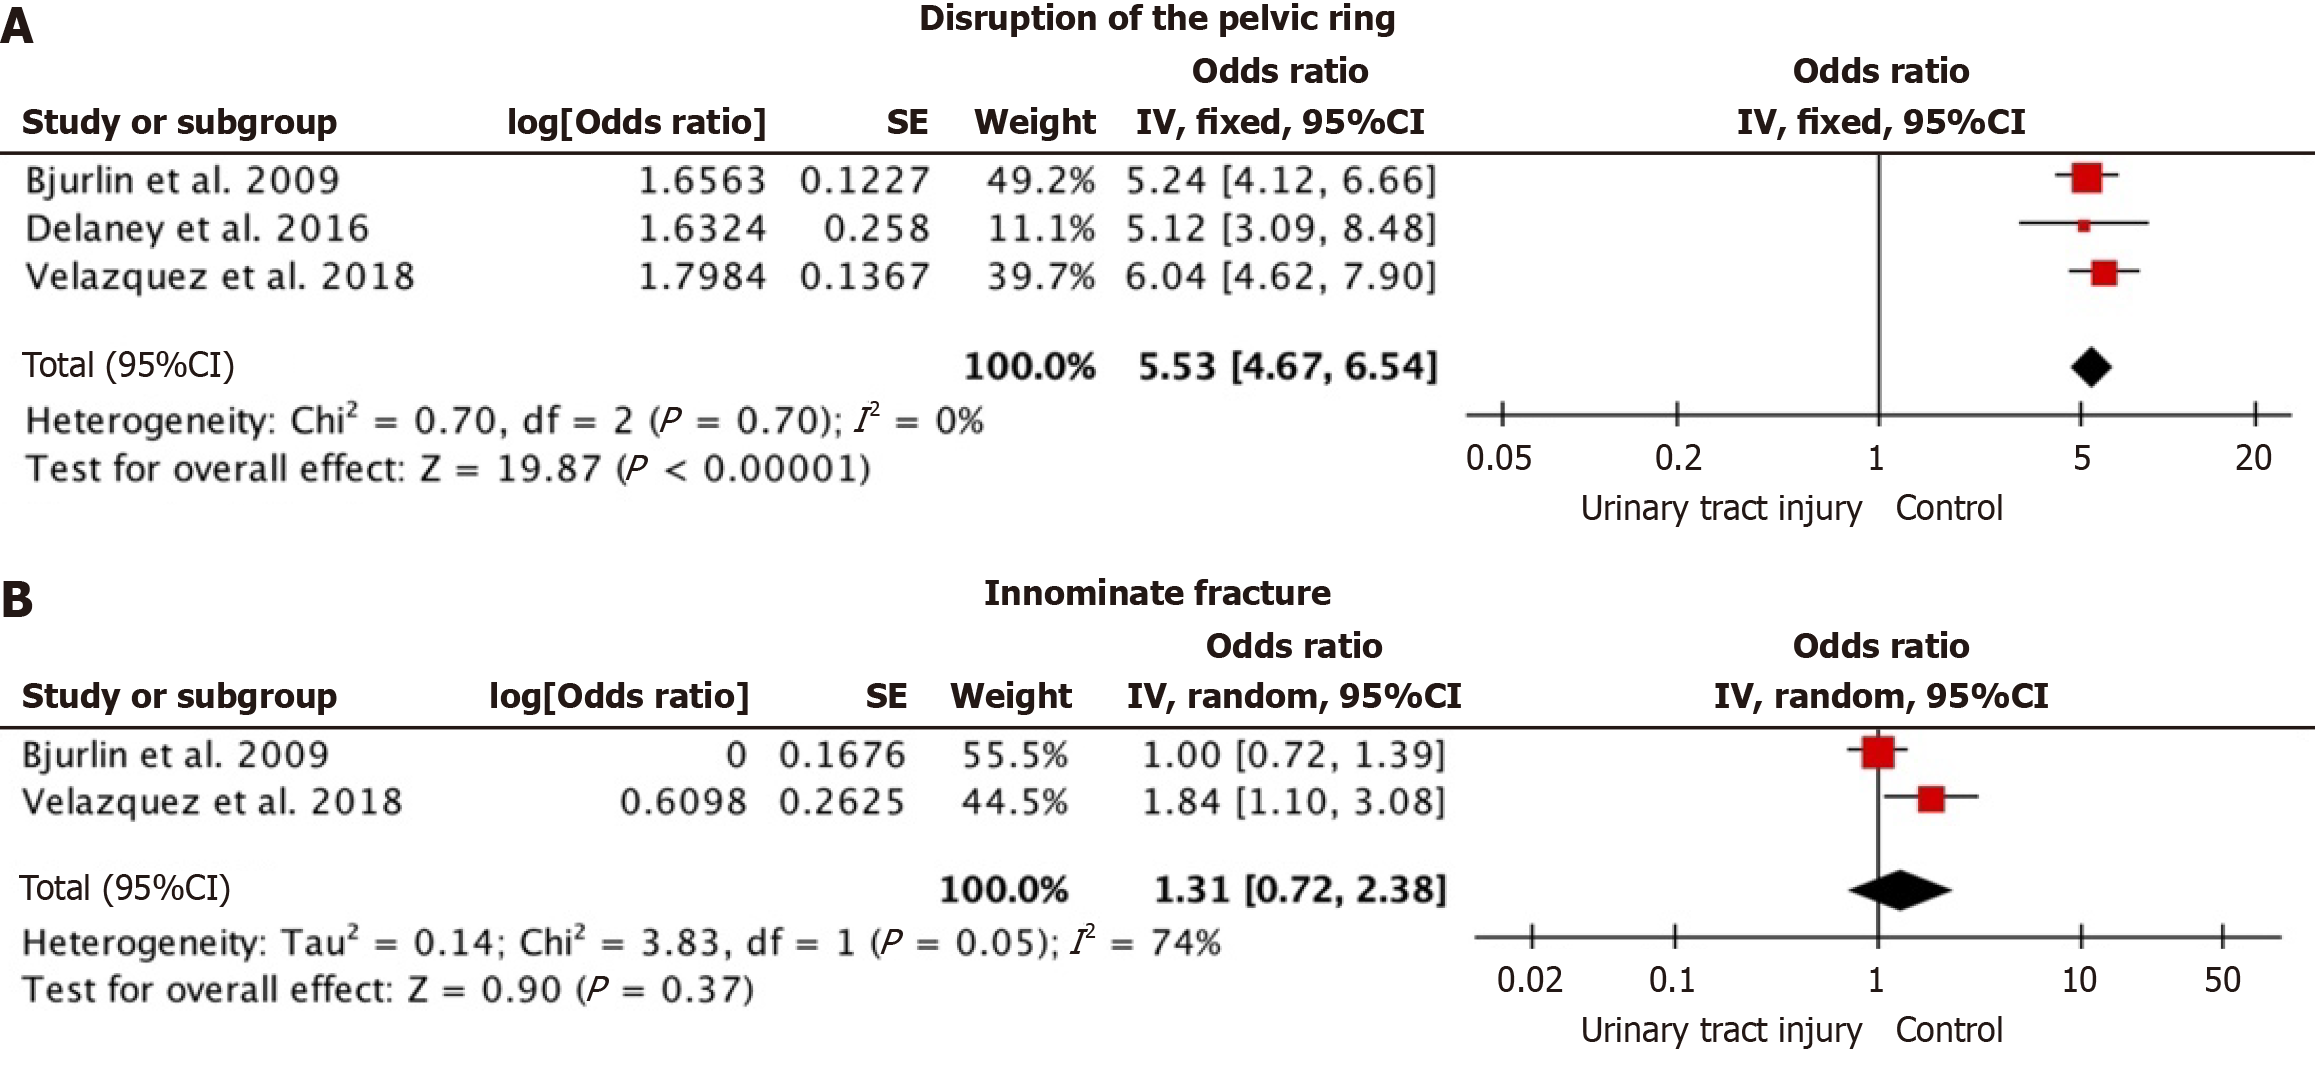
Figure 5 Forest plots showing the association between fracture type and urinary tract injury in patients with pelvic fractures.
A: Pelvic ring disruption; B: Innominate/pelvic rim fracture. The squares represent the point estimate of the odds ratio (OR) for each study, with the size of the square proportional to the study's weight in the meta-analysis. The horizontal lines represent the 95%CI. The diamond represents the pooled OR, with its width representing the 95%CI.
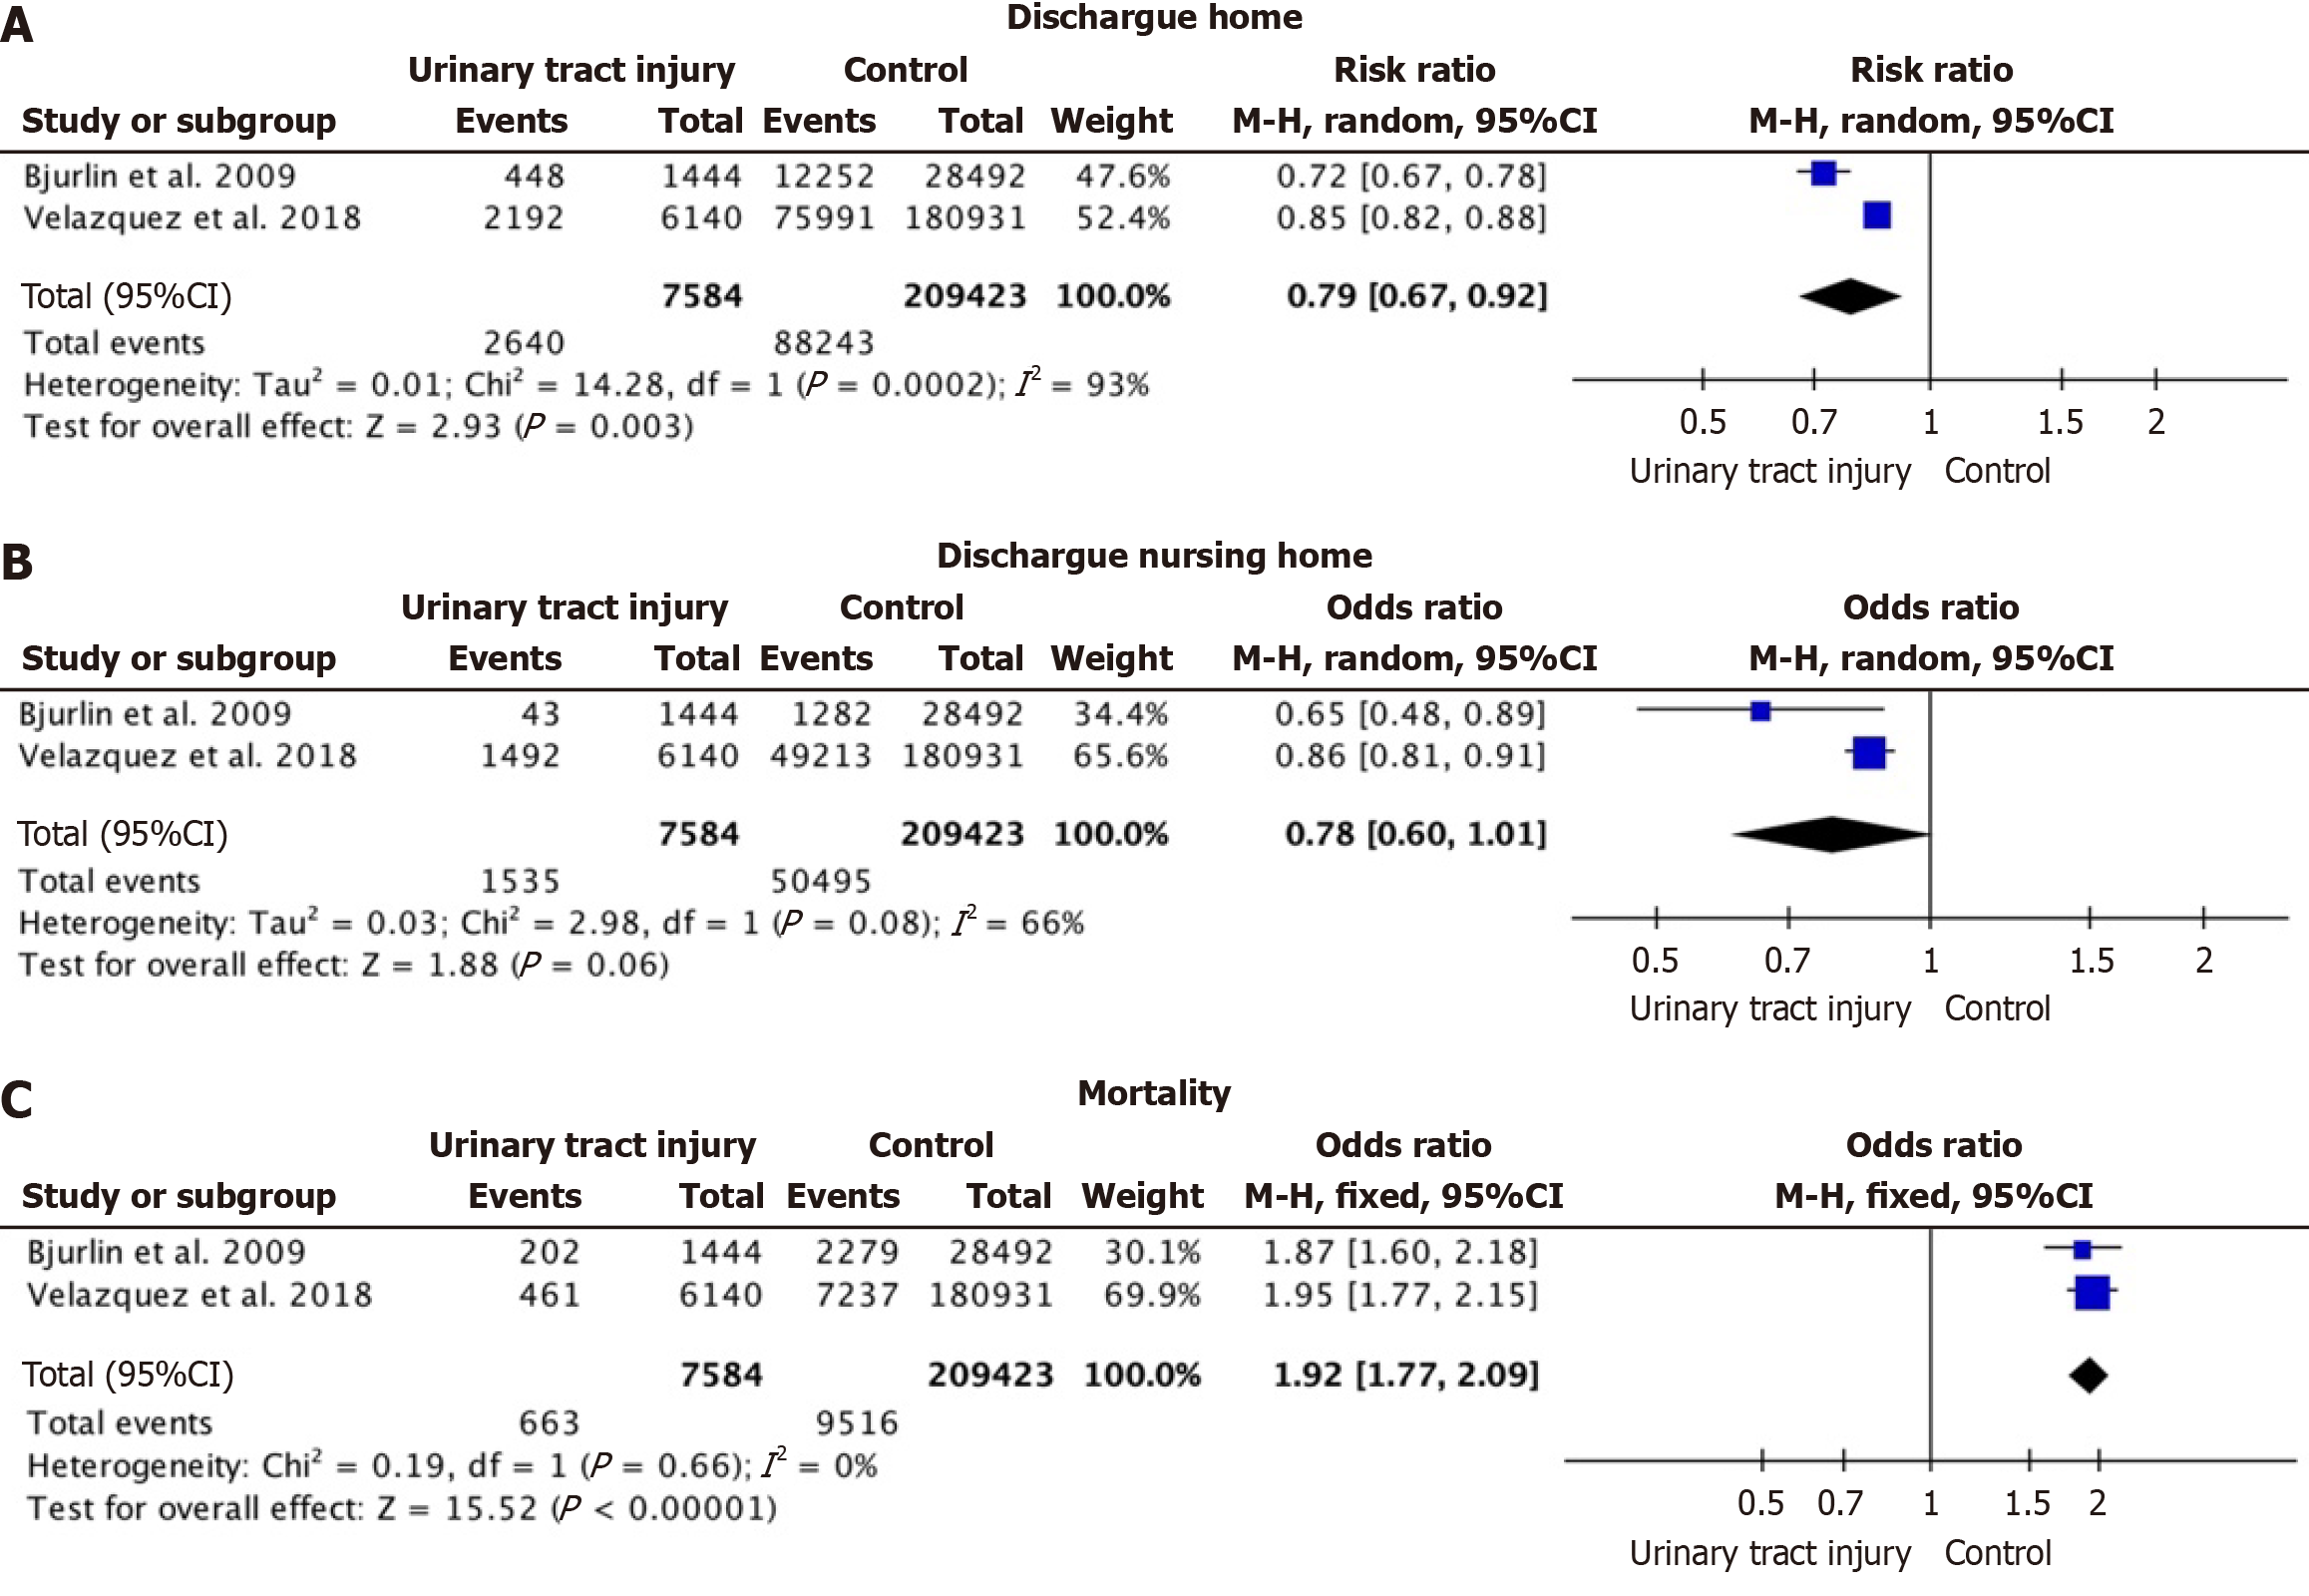
Figure 6 Forest plots showing the association between urinary tract injury and discharge disposition/mortality in patients with pelvic fractures.
A: Discharge home [relative risk (RR)]; B: Discharge to nursing home [odds ratio (OR)]; C: Mortality (OR). The squares represent the point estimate of the RR or OR for each study, with the size of the square proportional to the study's weight in the meta-analysis. The horizontal lines represent the 95%CI. The diamond represents the pooled RR or OR, with its width representing the 95%CI.
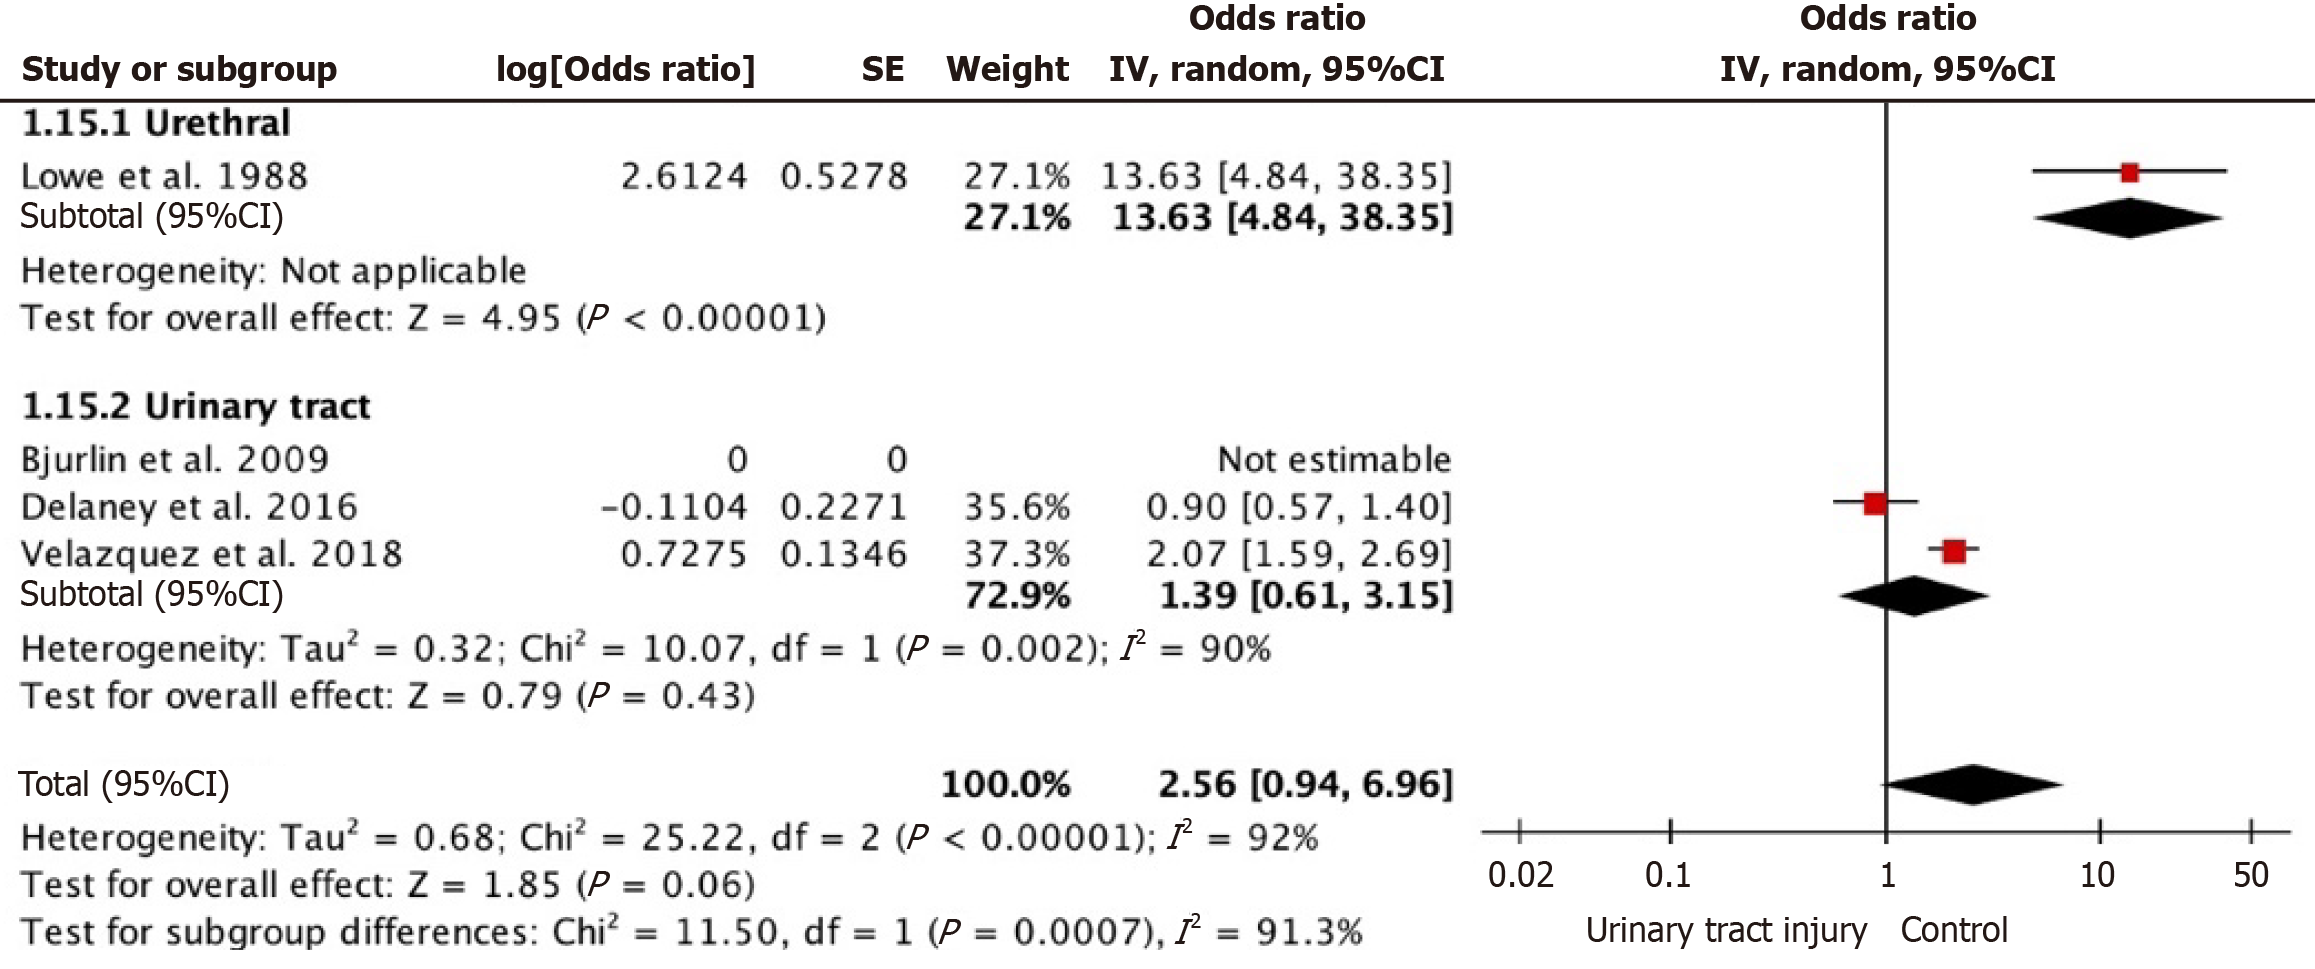
Figure 7 Forest plot showing sensitivity analysis for the association between pubic fracture and urinary tract injury.
This forest plot illustrates the impact of removing the top-weighted study on the pooled odds ratio (OR) for the association between pubic fracture and urinary tract injury. The squares represent the point estimate of the OR for each study, with the size of the square proportional to the study's weight. The horizontal lines represent the 95%CI. The diamond represents the pooled OR, with its width representing the 95%CI.
Figure 8 Funnel plots assessing publication bias in the meta-analysis.
These funnel plots examine the potential for publication bias in the analyses. A: Pedestrian accidents; B: Hemodynamic instability; C: Acetabular fracture. Asymmetry in the funnel plot may suggest publication bias. RR: Relative risk.
- Citation: Mariscal G, Dway A, Barrios C. Hidden dangers of pelvic fracture: A meta-analysis on urinary tract injury incidence and risk factors. World J Orthop 2025; 16(2): 102483
- URL: https://www.wjgnet.com/2218-5836/full/v16/i2/102483.htm
- DOI: https://dx.doi.org/10.5312/wjo.v16.i2.102483


