Copyright
©The Author(s) 2025.
World J Orthop. Feb 18, 2025; 16(2): 101895
Published online Feb 18, 2025. doi: 10.5312/wjo.v16.i2.101895
Published online Feb 18, 2025. doi: 10.5312/wjo.v16.i2.101895
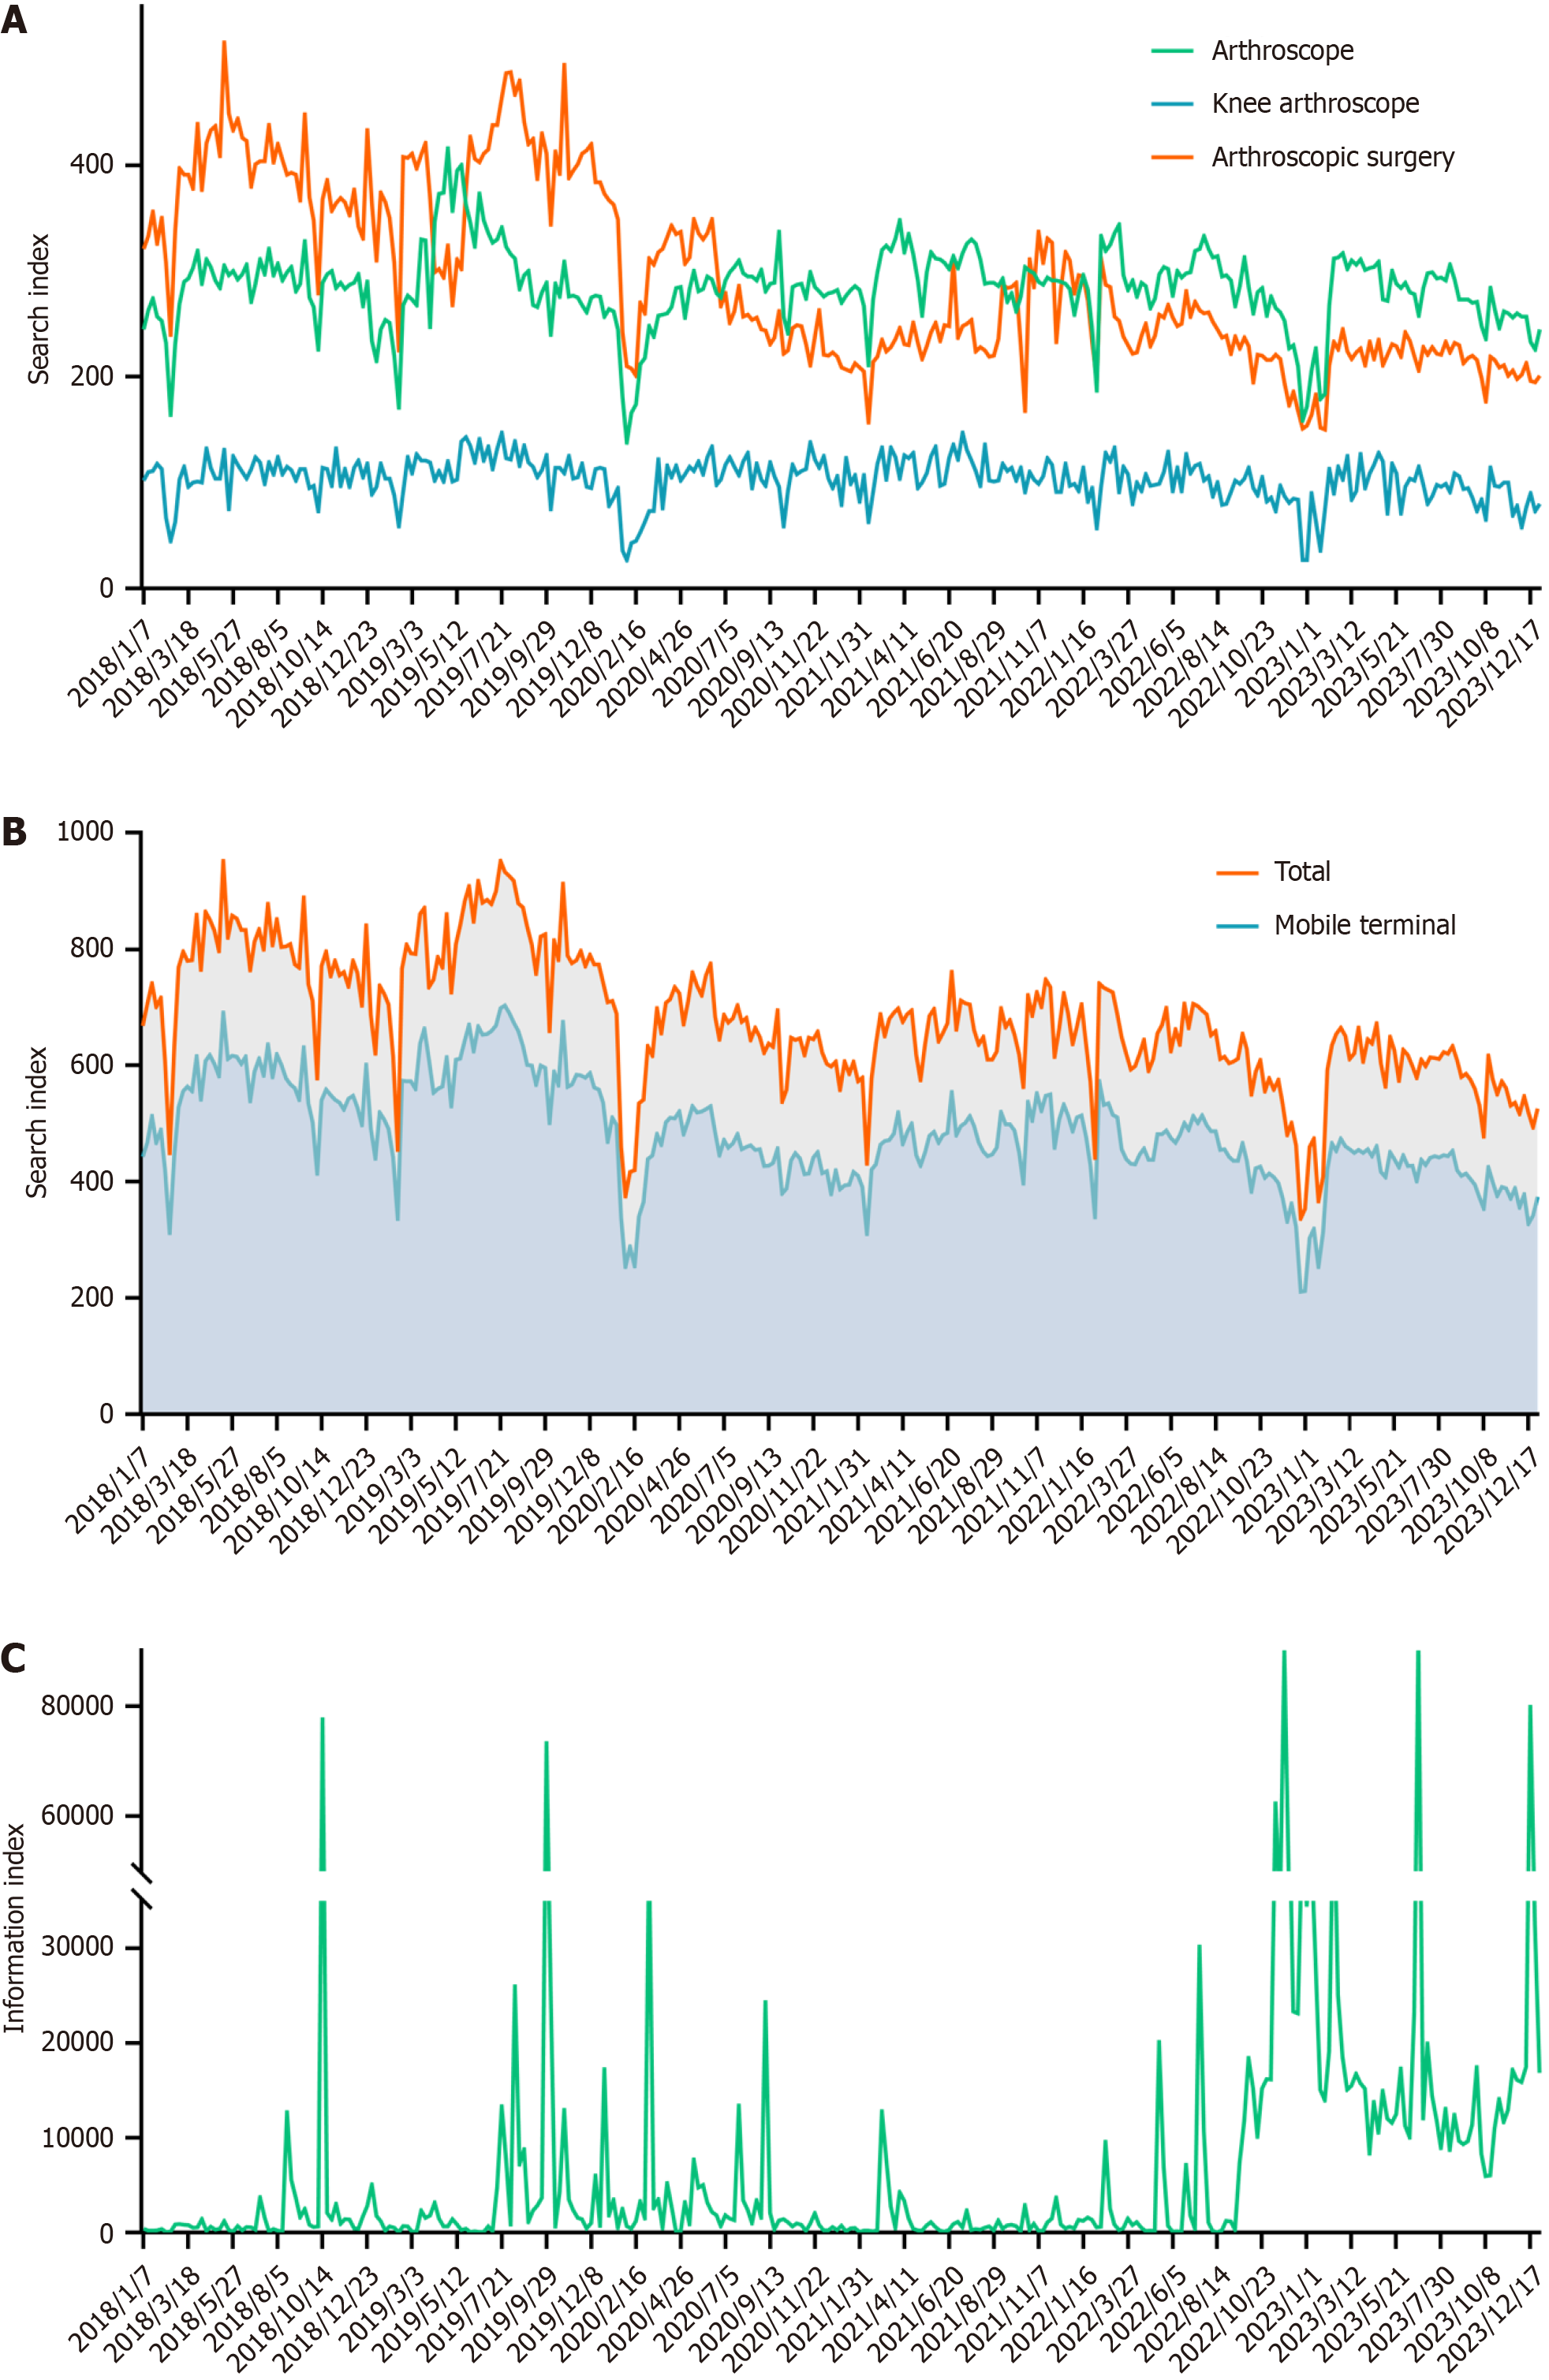
Figure 1 Arthroscopy search overview.
A: Search index of each keyword; B: Different client search indices; C: Information index.
Figure 2 Changes in trend of elasticity coefficient of arthroscopy network attention from 2018 to 2023.
A: Overall search index; B: Mobile search index.
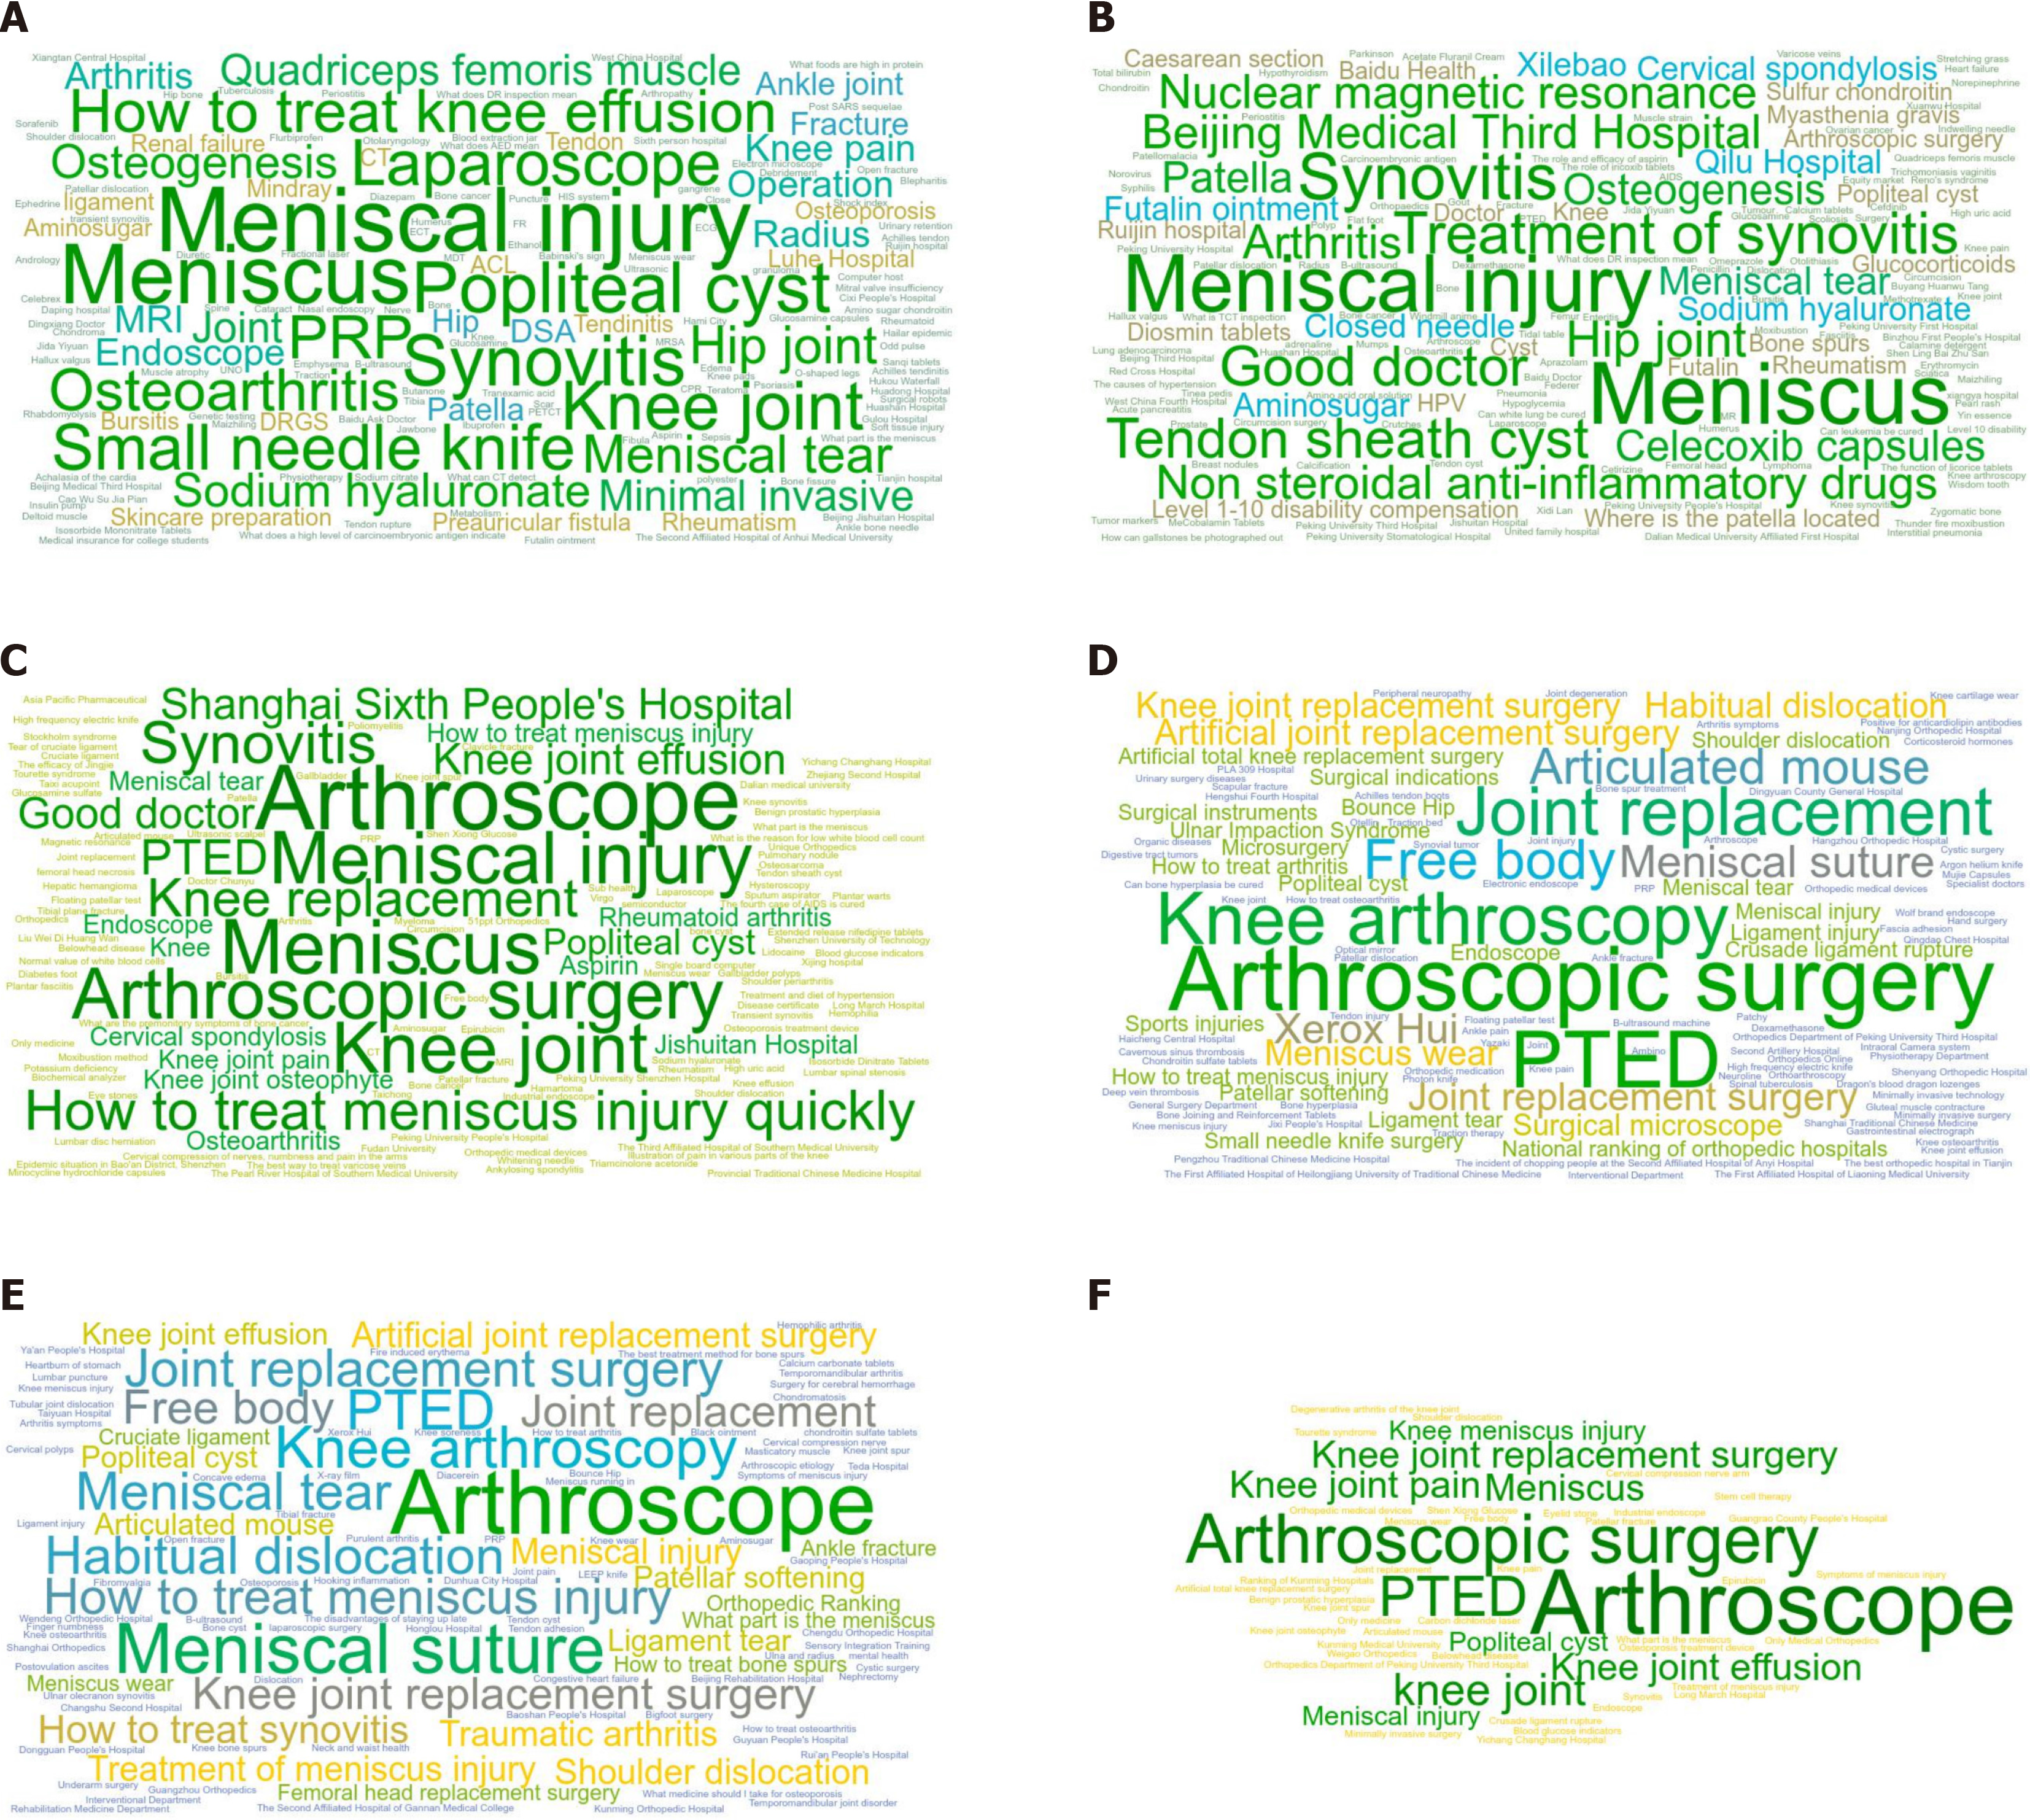
Figure 3 The word cloud for each keyword from 2018 to 2023.
A: The demand graph of arthroscopy; B: The demand graph of knee arthroscopy; C: The demand graph of arthroscopy surgery; D: The popular words of arthroscopy; E: The popular words of knee arthroscopy; F: The popular words of arthroscopy surgery.
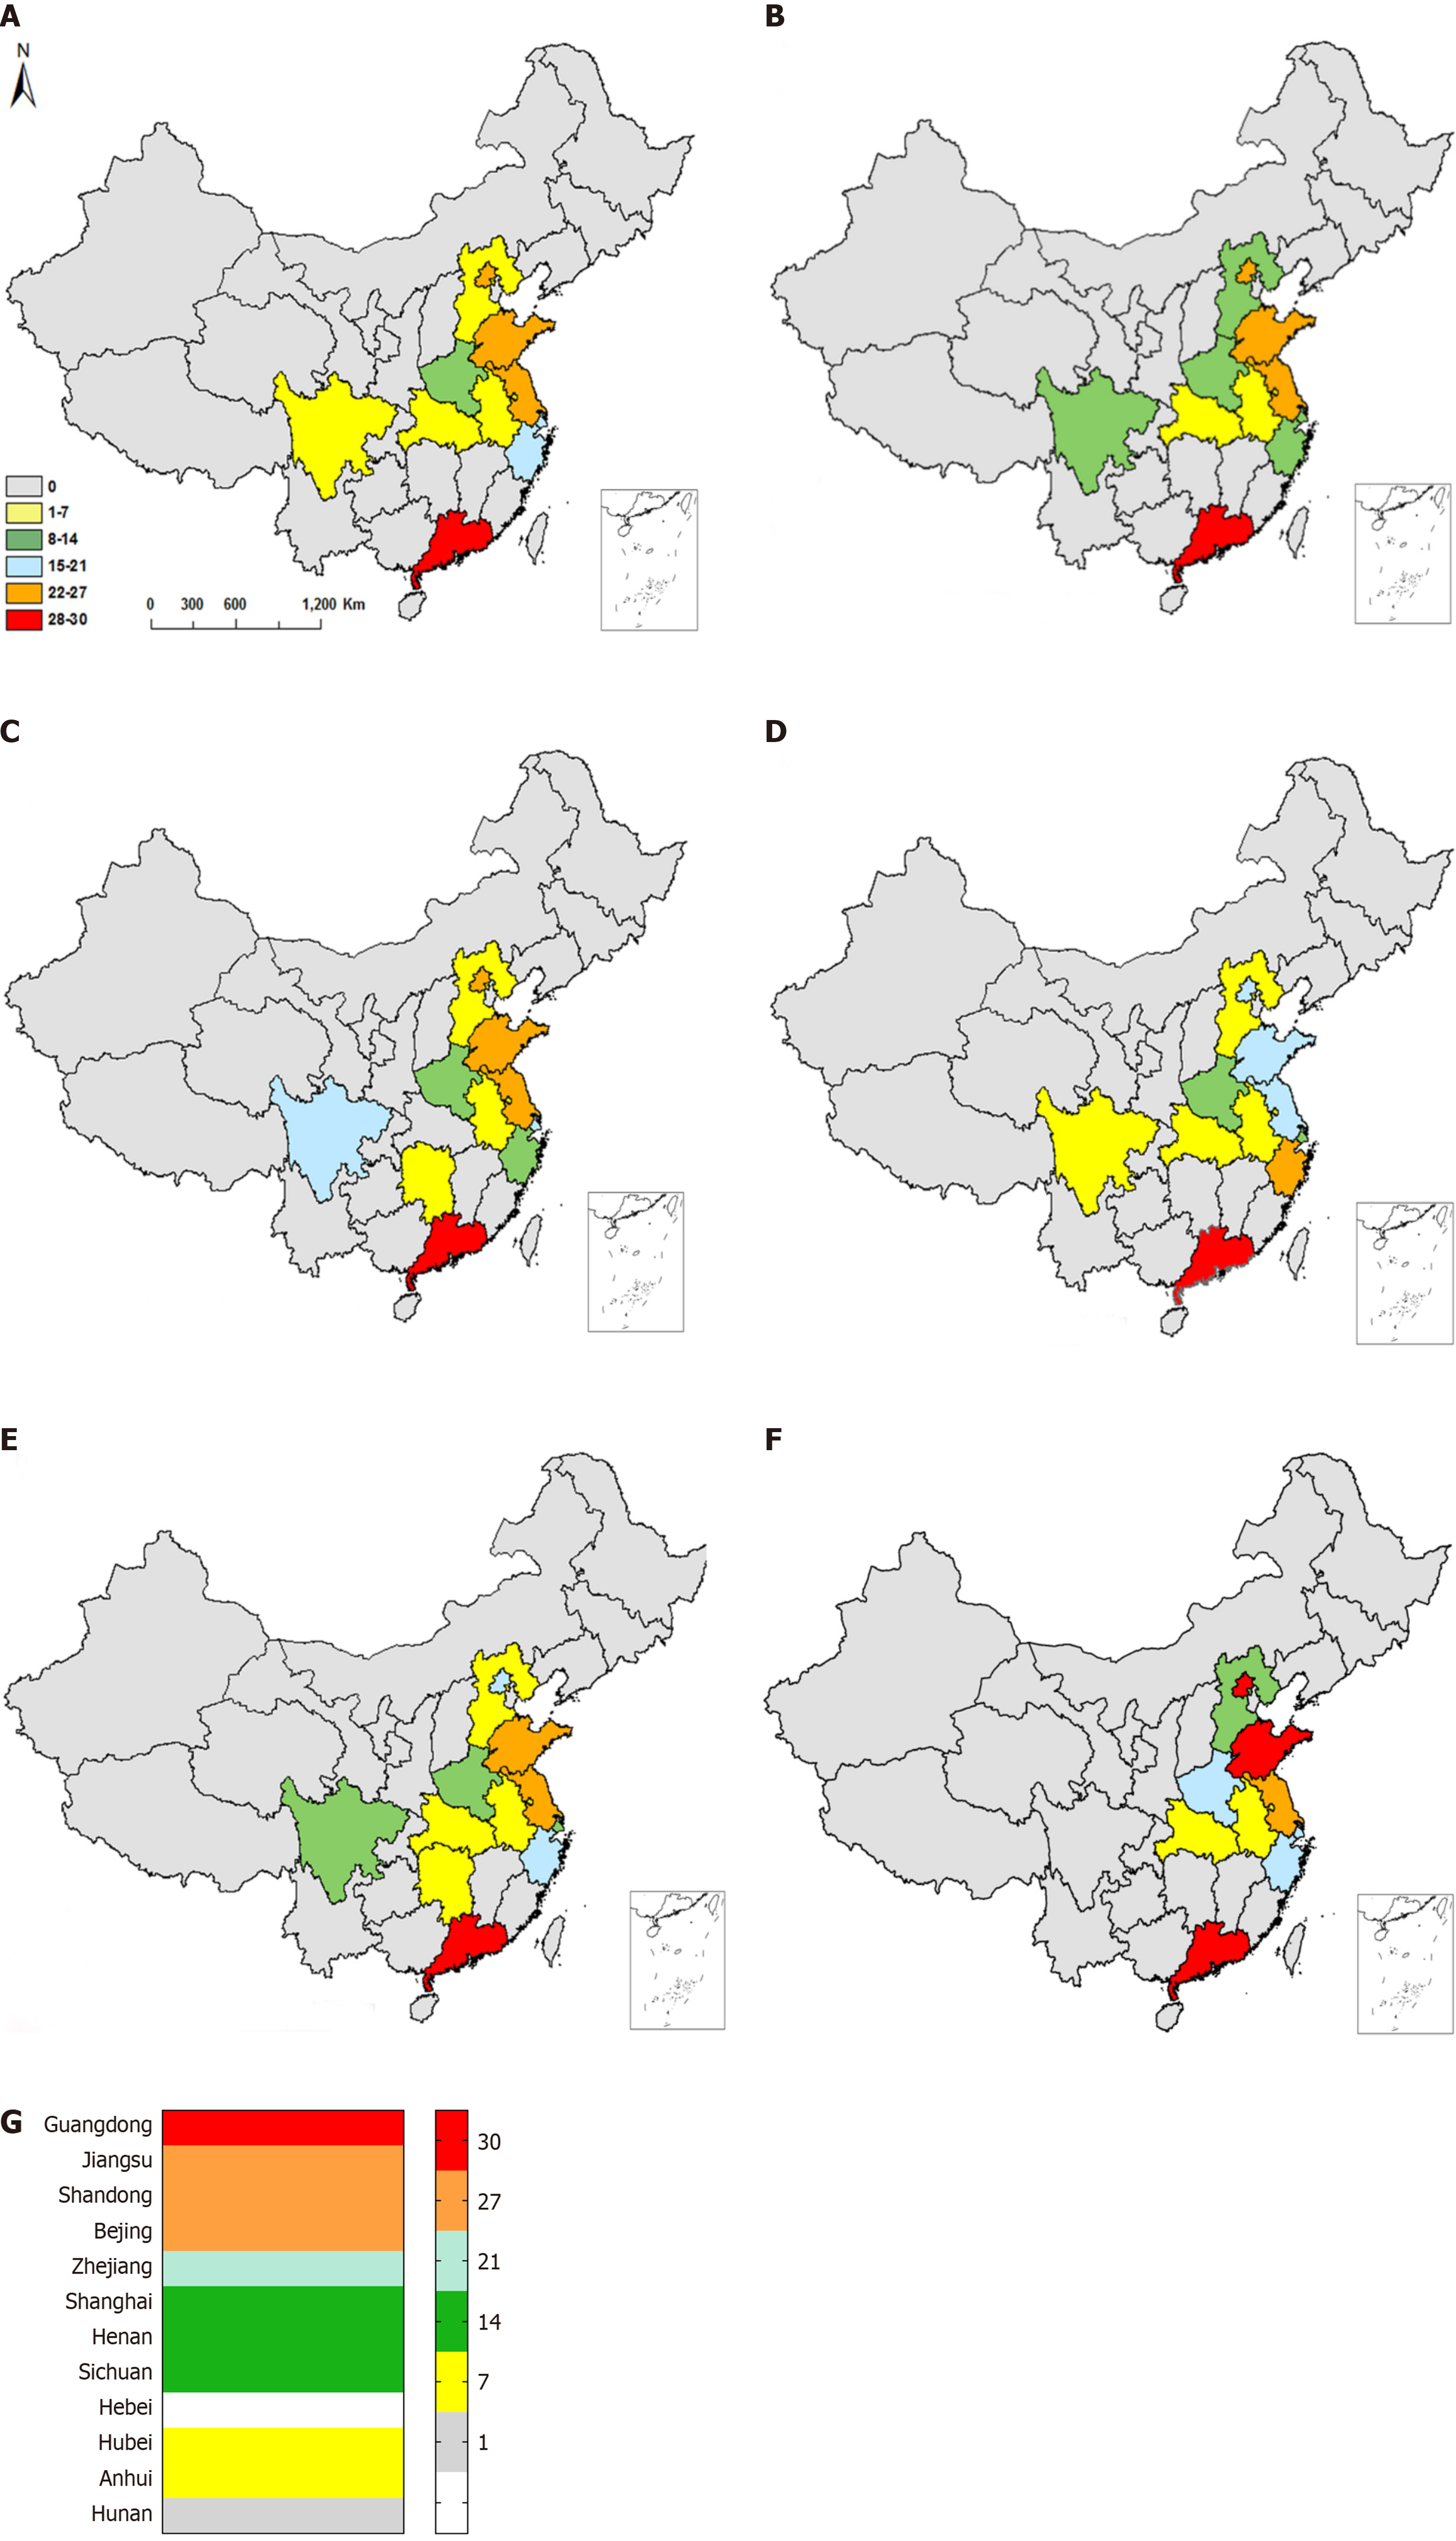
Figure 4 Spatial distribution of arthroscopy requirement, 2018-2023.
A-F: From 2018 to 2023, respectively; G: Overall search region ranking for the past 6 years. Data was weighted based on the ranking of different years and keywords.
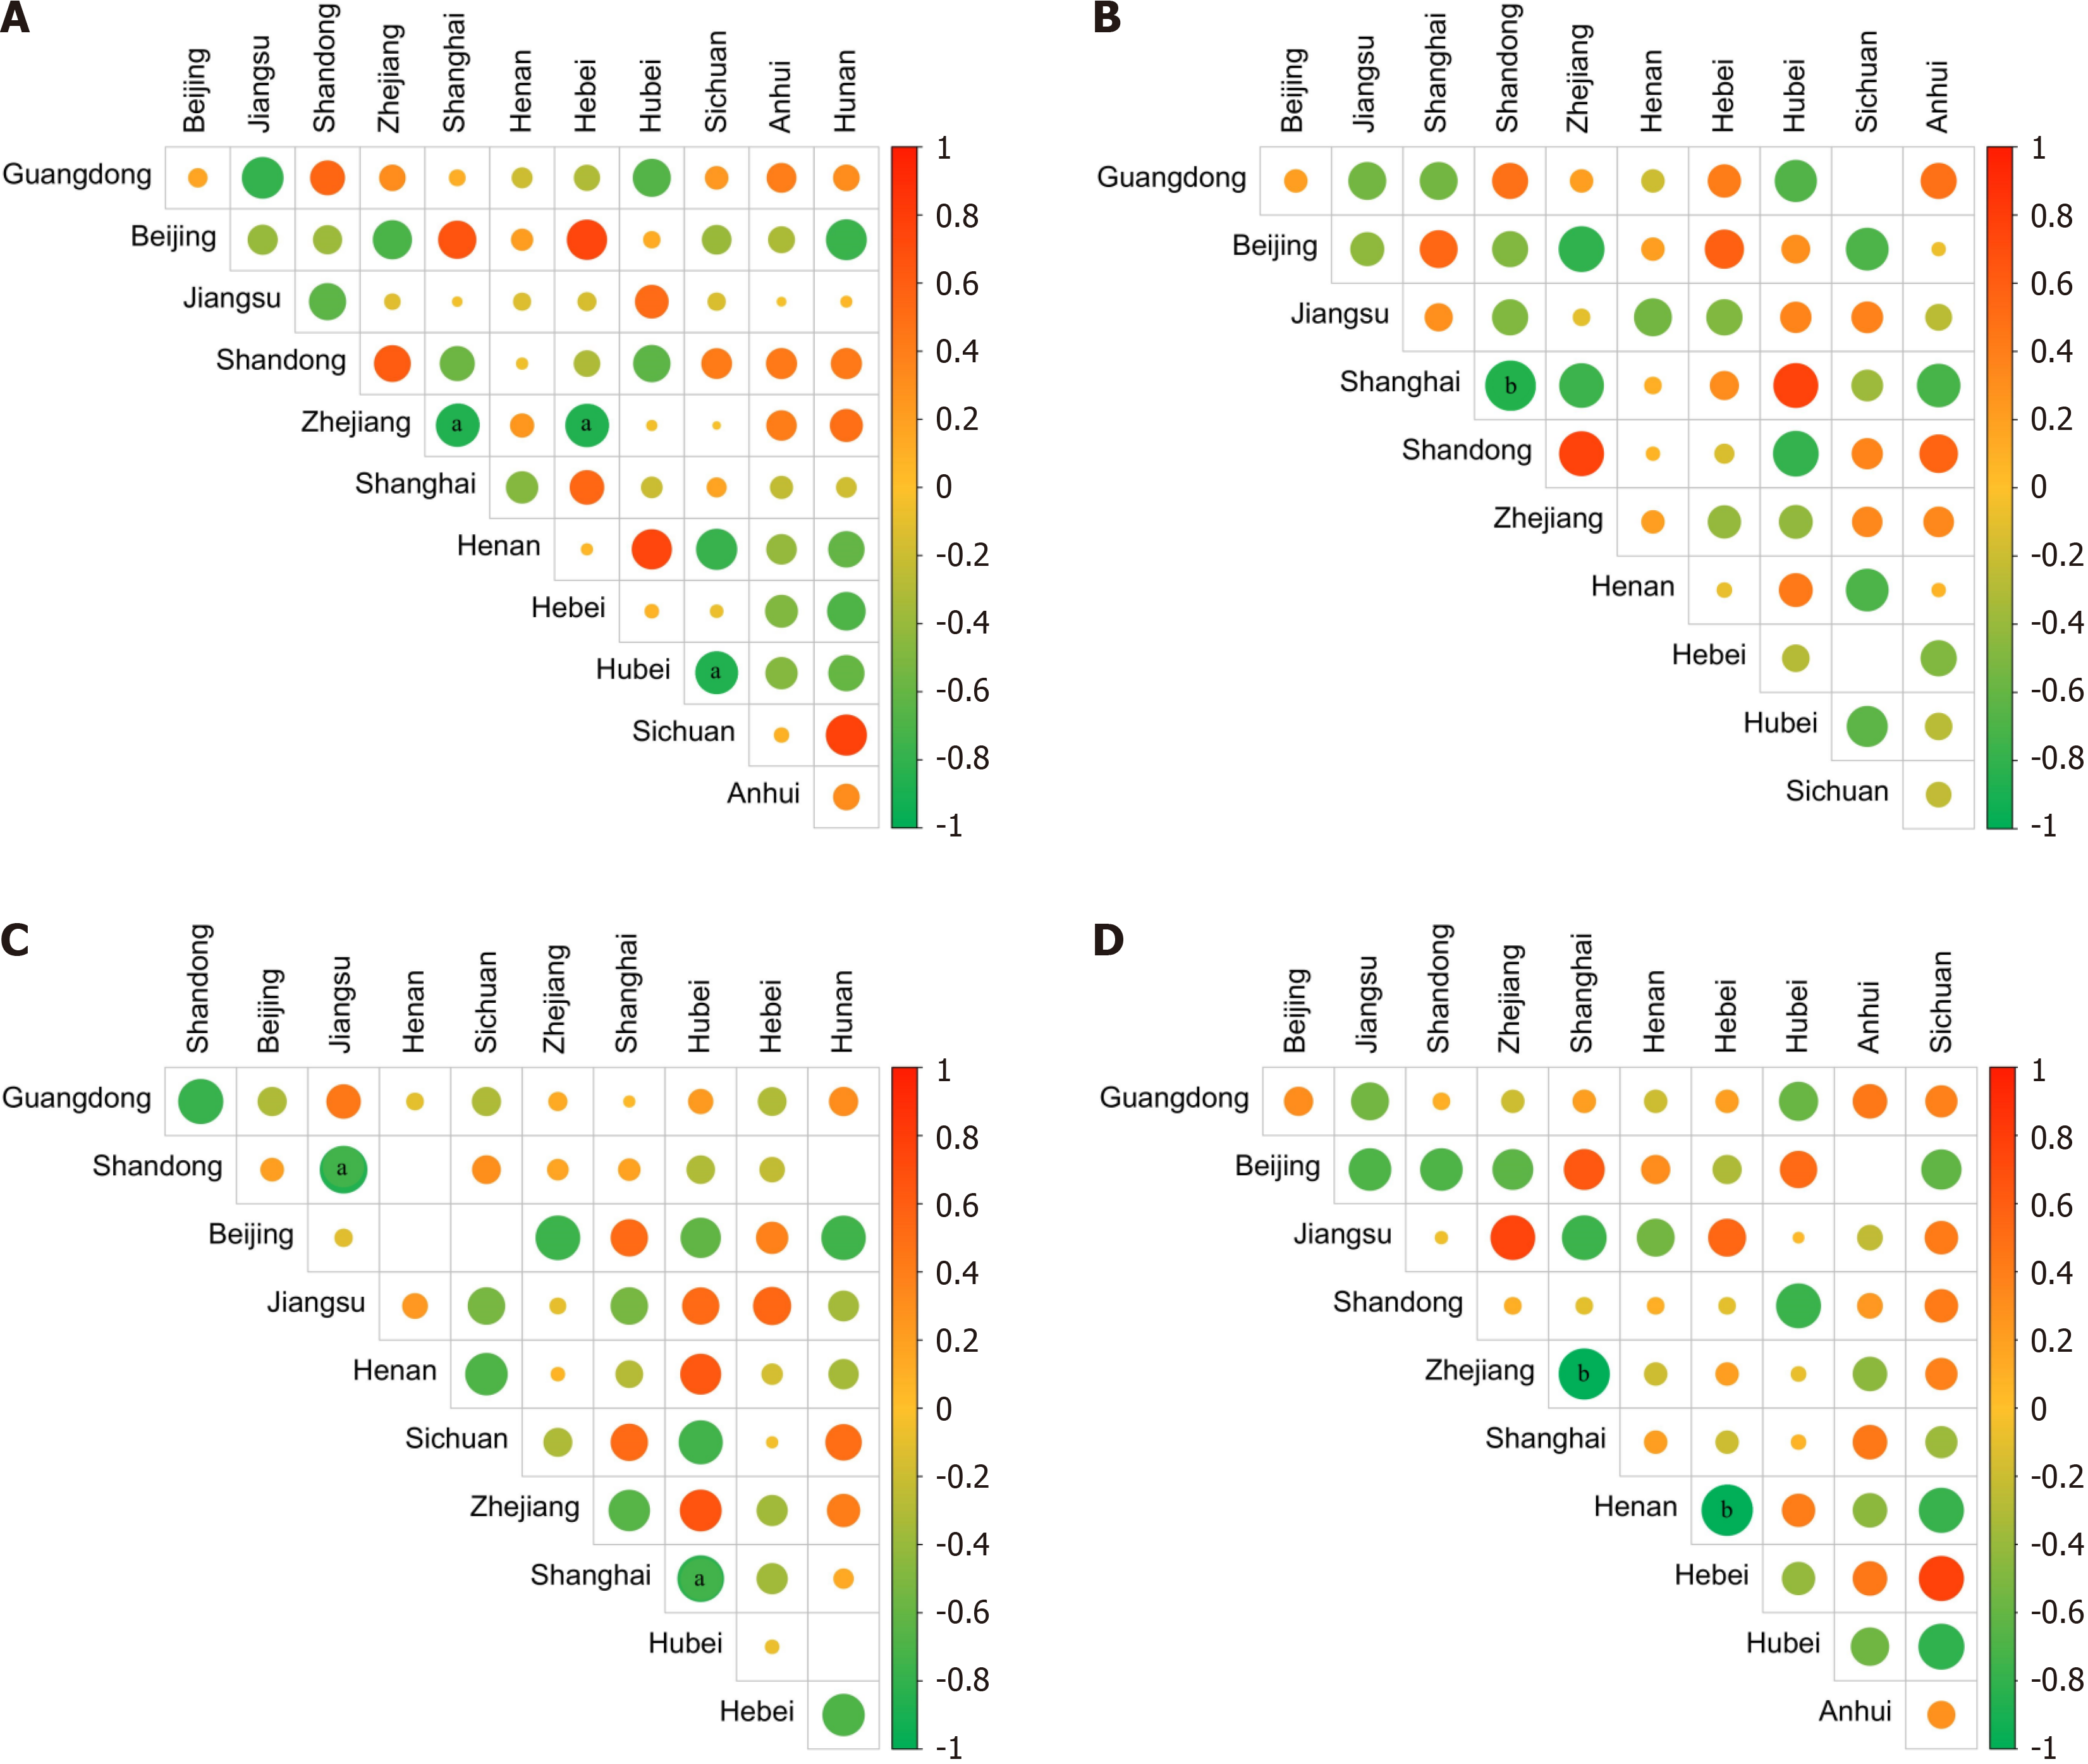
Figure 5 Correlation analysis of netizens’ attention to arthroscopy in different regions.
A: Overall situation; B: Arthroscopy; C: Knee arthroscopy; D: Arthroscopy surgery. Data were analyzed by Pearson-correlation. aP < 0.05, bP < 0.01.
- Citation: Deng JL, Yang K, Zhang S, Wang B, Zhang L, Zhao X. Discussion of the public interest in arthroscopy based on the Baidu index and its implications for nursing care. World J Orthop 2025; 16(2): 101895
- URL: https://www.wjgnet.com/2218-5836/full/v16/i2/101895.htm
- DOI: https://dx.doi.org/10.5312/wjo.v16.i2.101895


