Copyright
©The Author(s) 2024.
World J Orthop. Aug 18, 2024; 15(8): 796-806
Published online Aug 18, 2024. doi: 10.5312/wjo.v15.i8.796
Published online Aug 18, 2024. doi: 10.5312/wjo.v15.i8.796
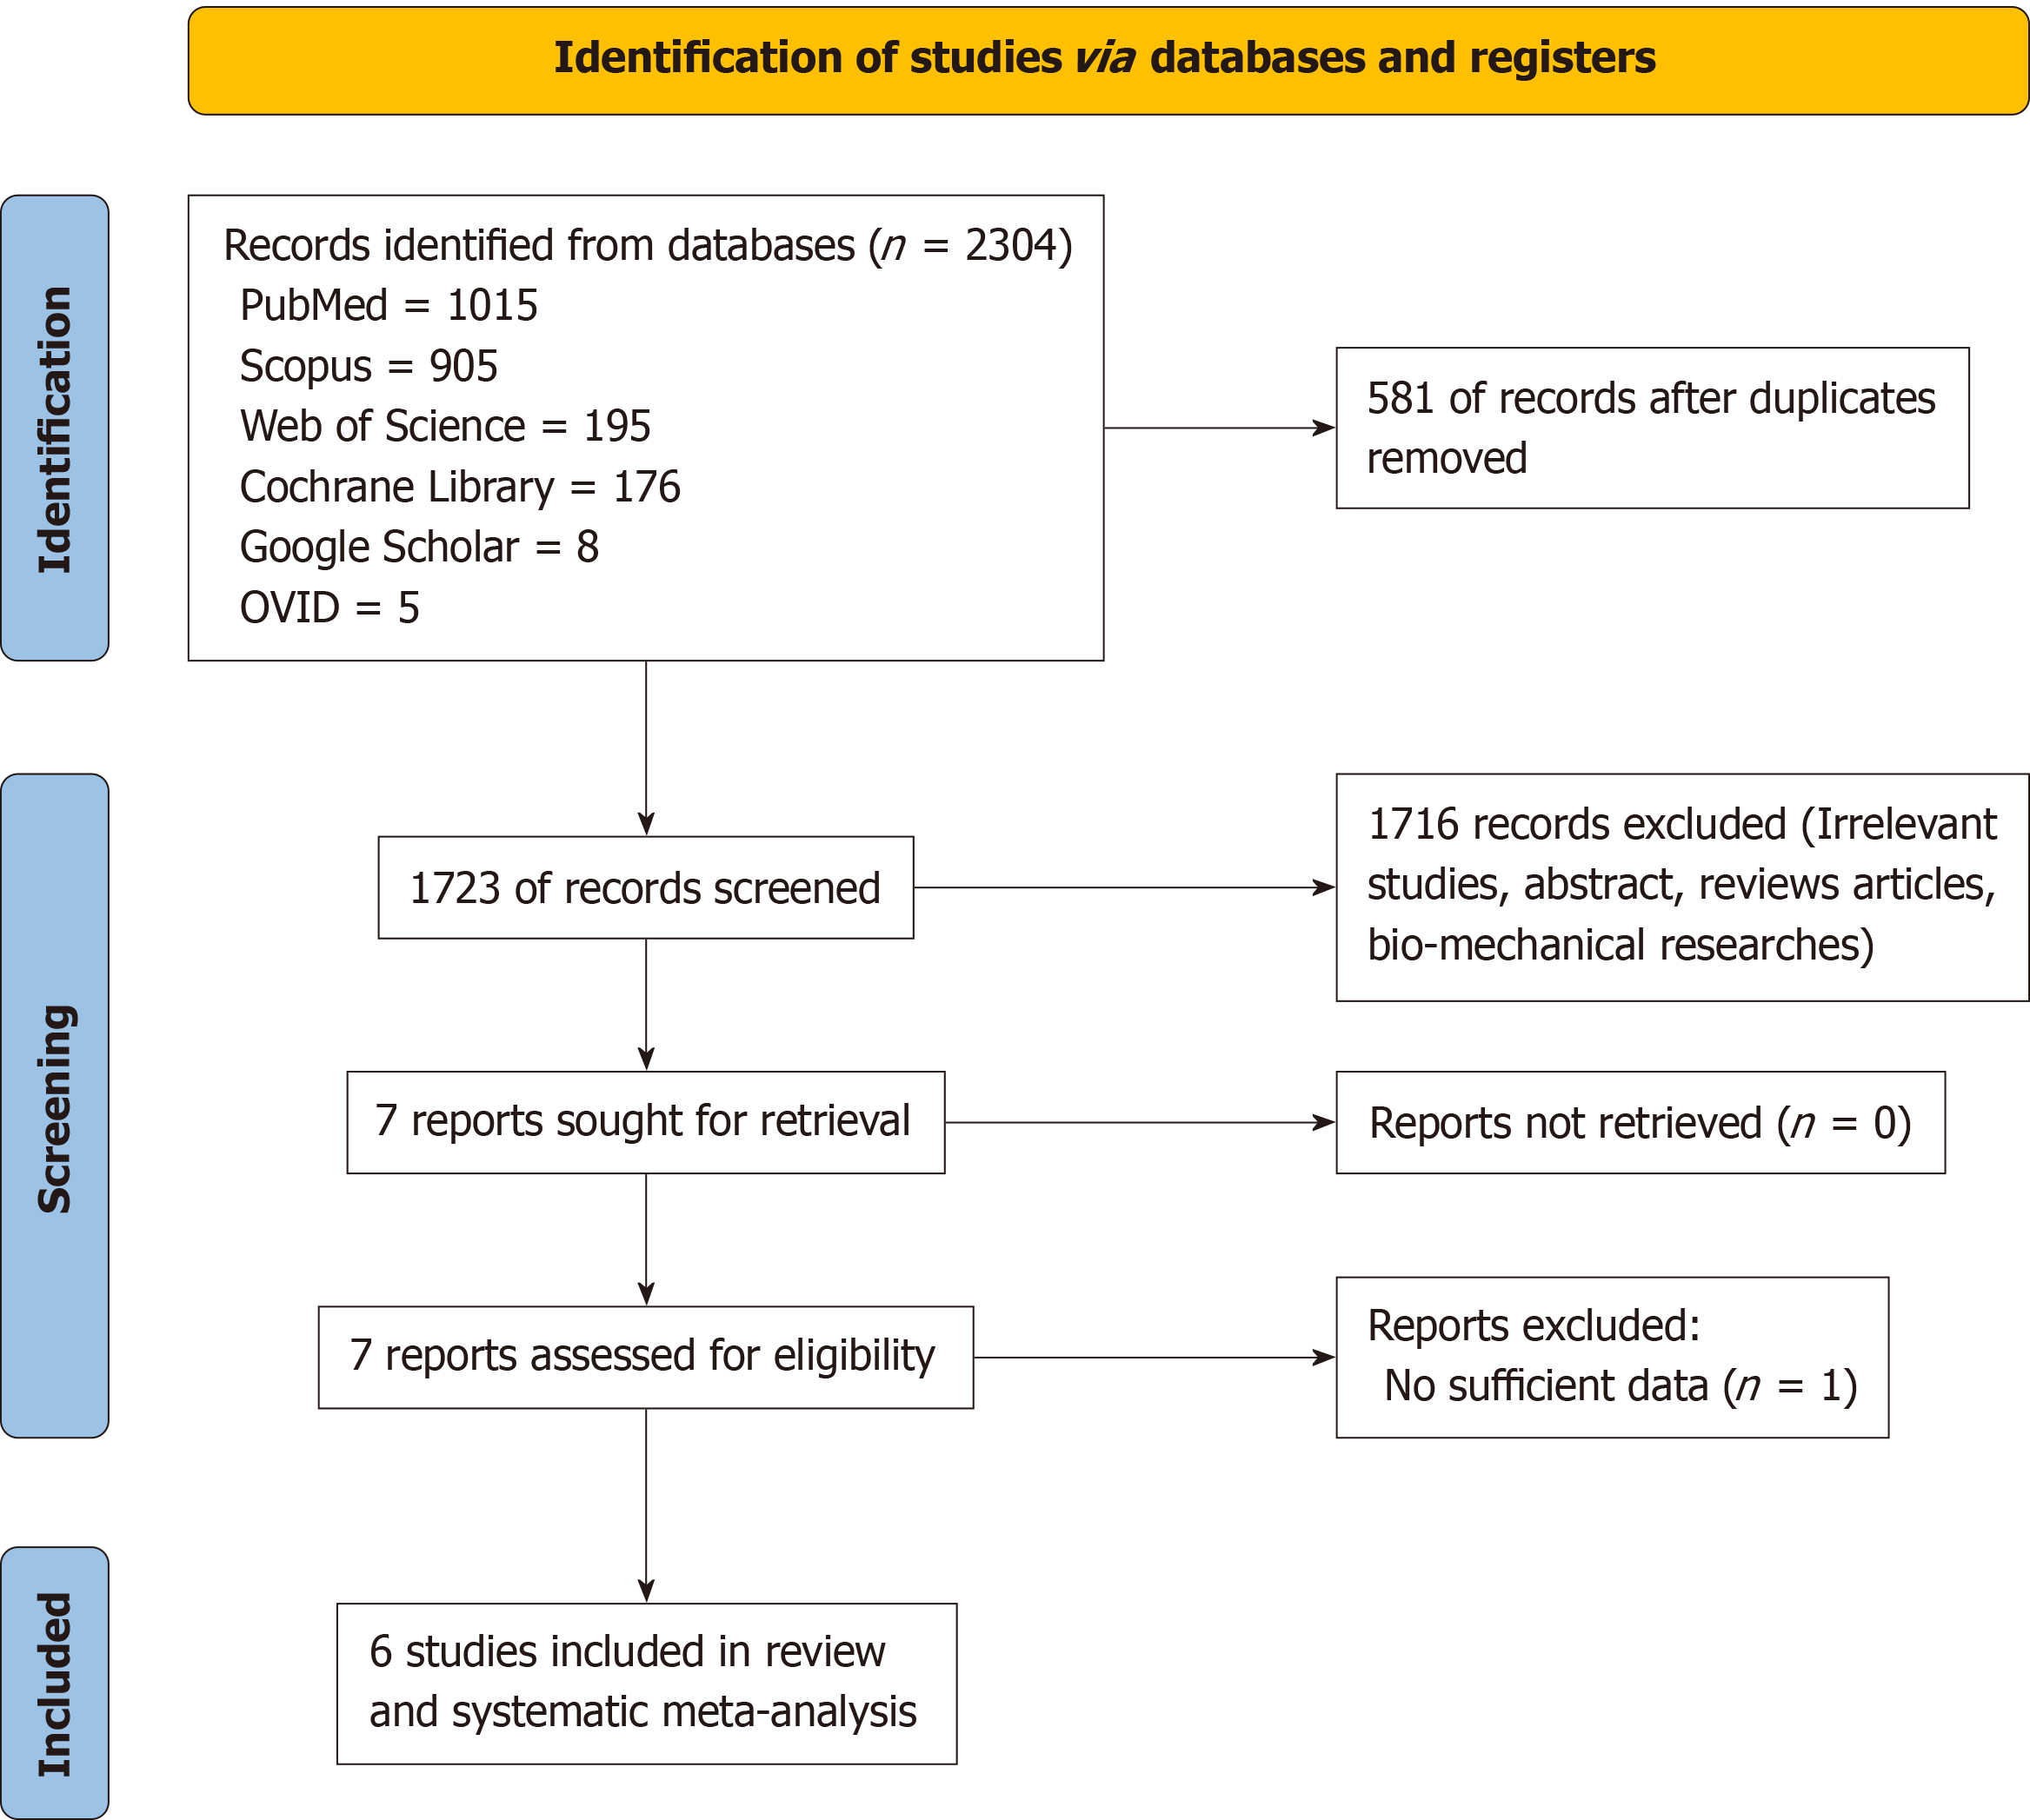
Figure 1
Flowchart of study search and inclusion criteria.
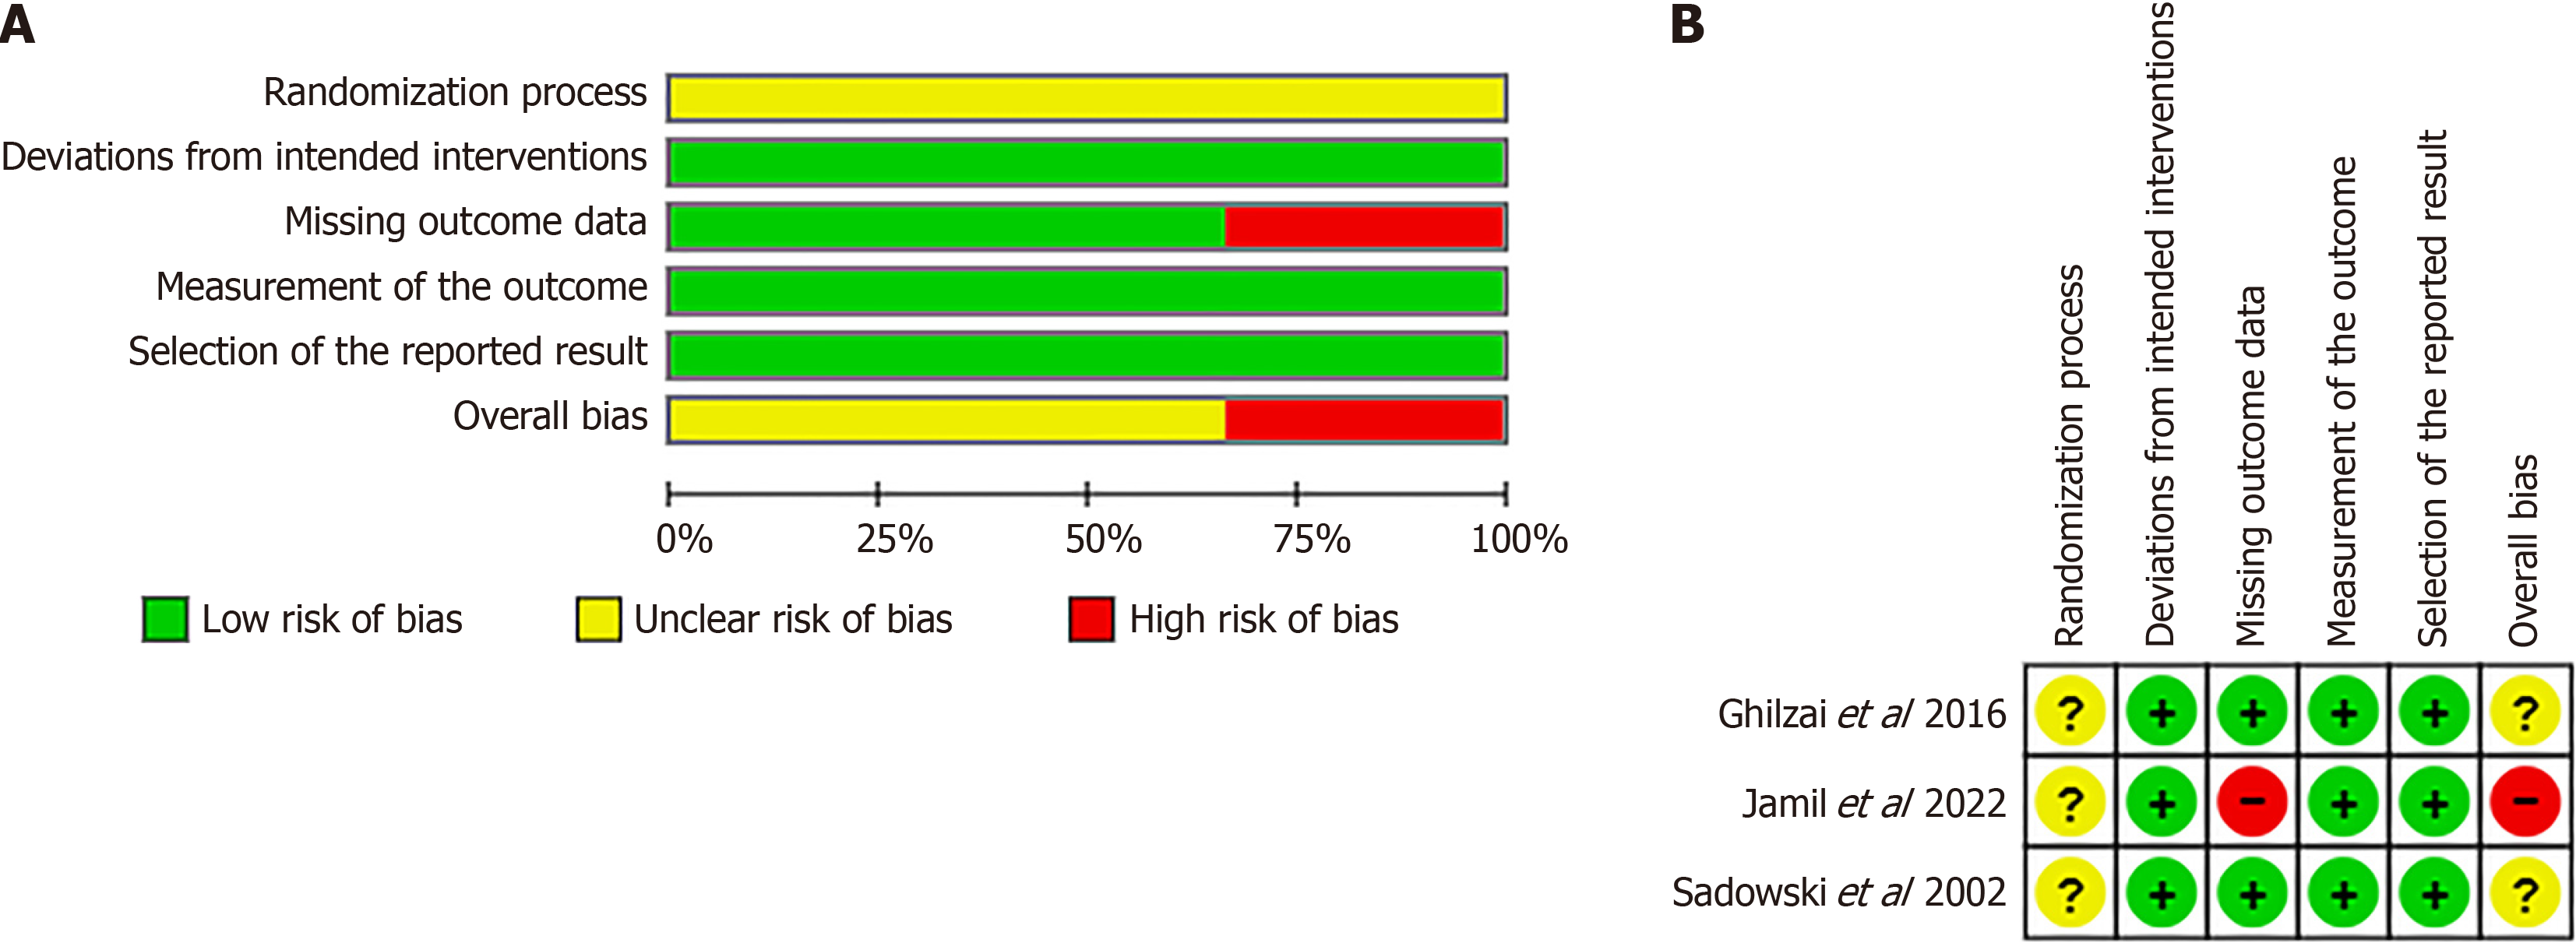
Figure 2 Risk.
A: Risk of bias graphical representation; B: Risk of bias of included trials.
Figure 3
Quality assessment of observational studies as assessed by the Newcastle–Ottawa Scale.
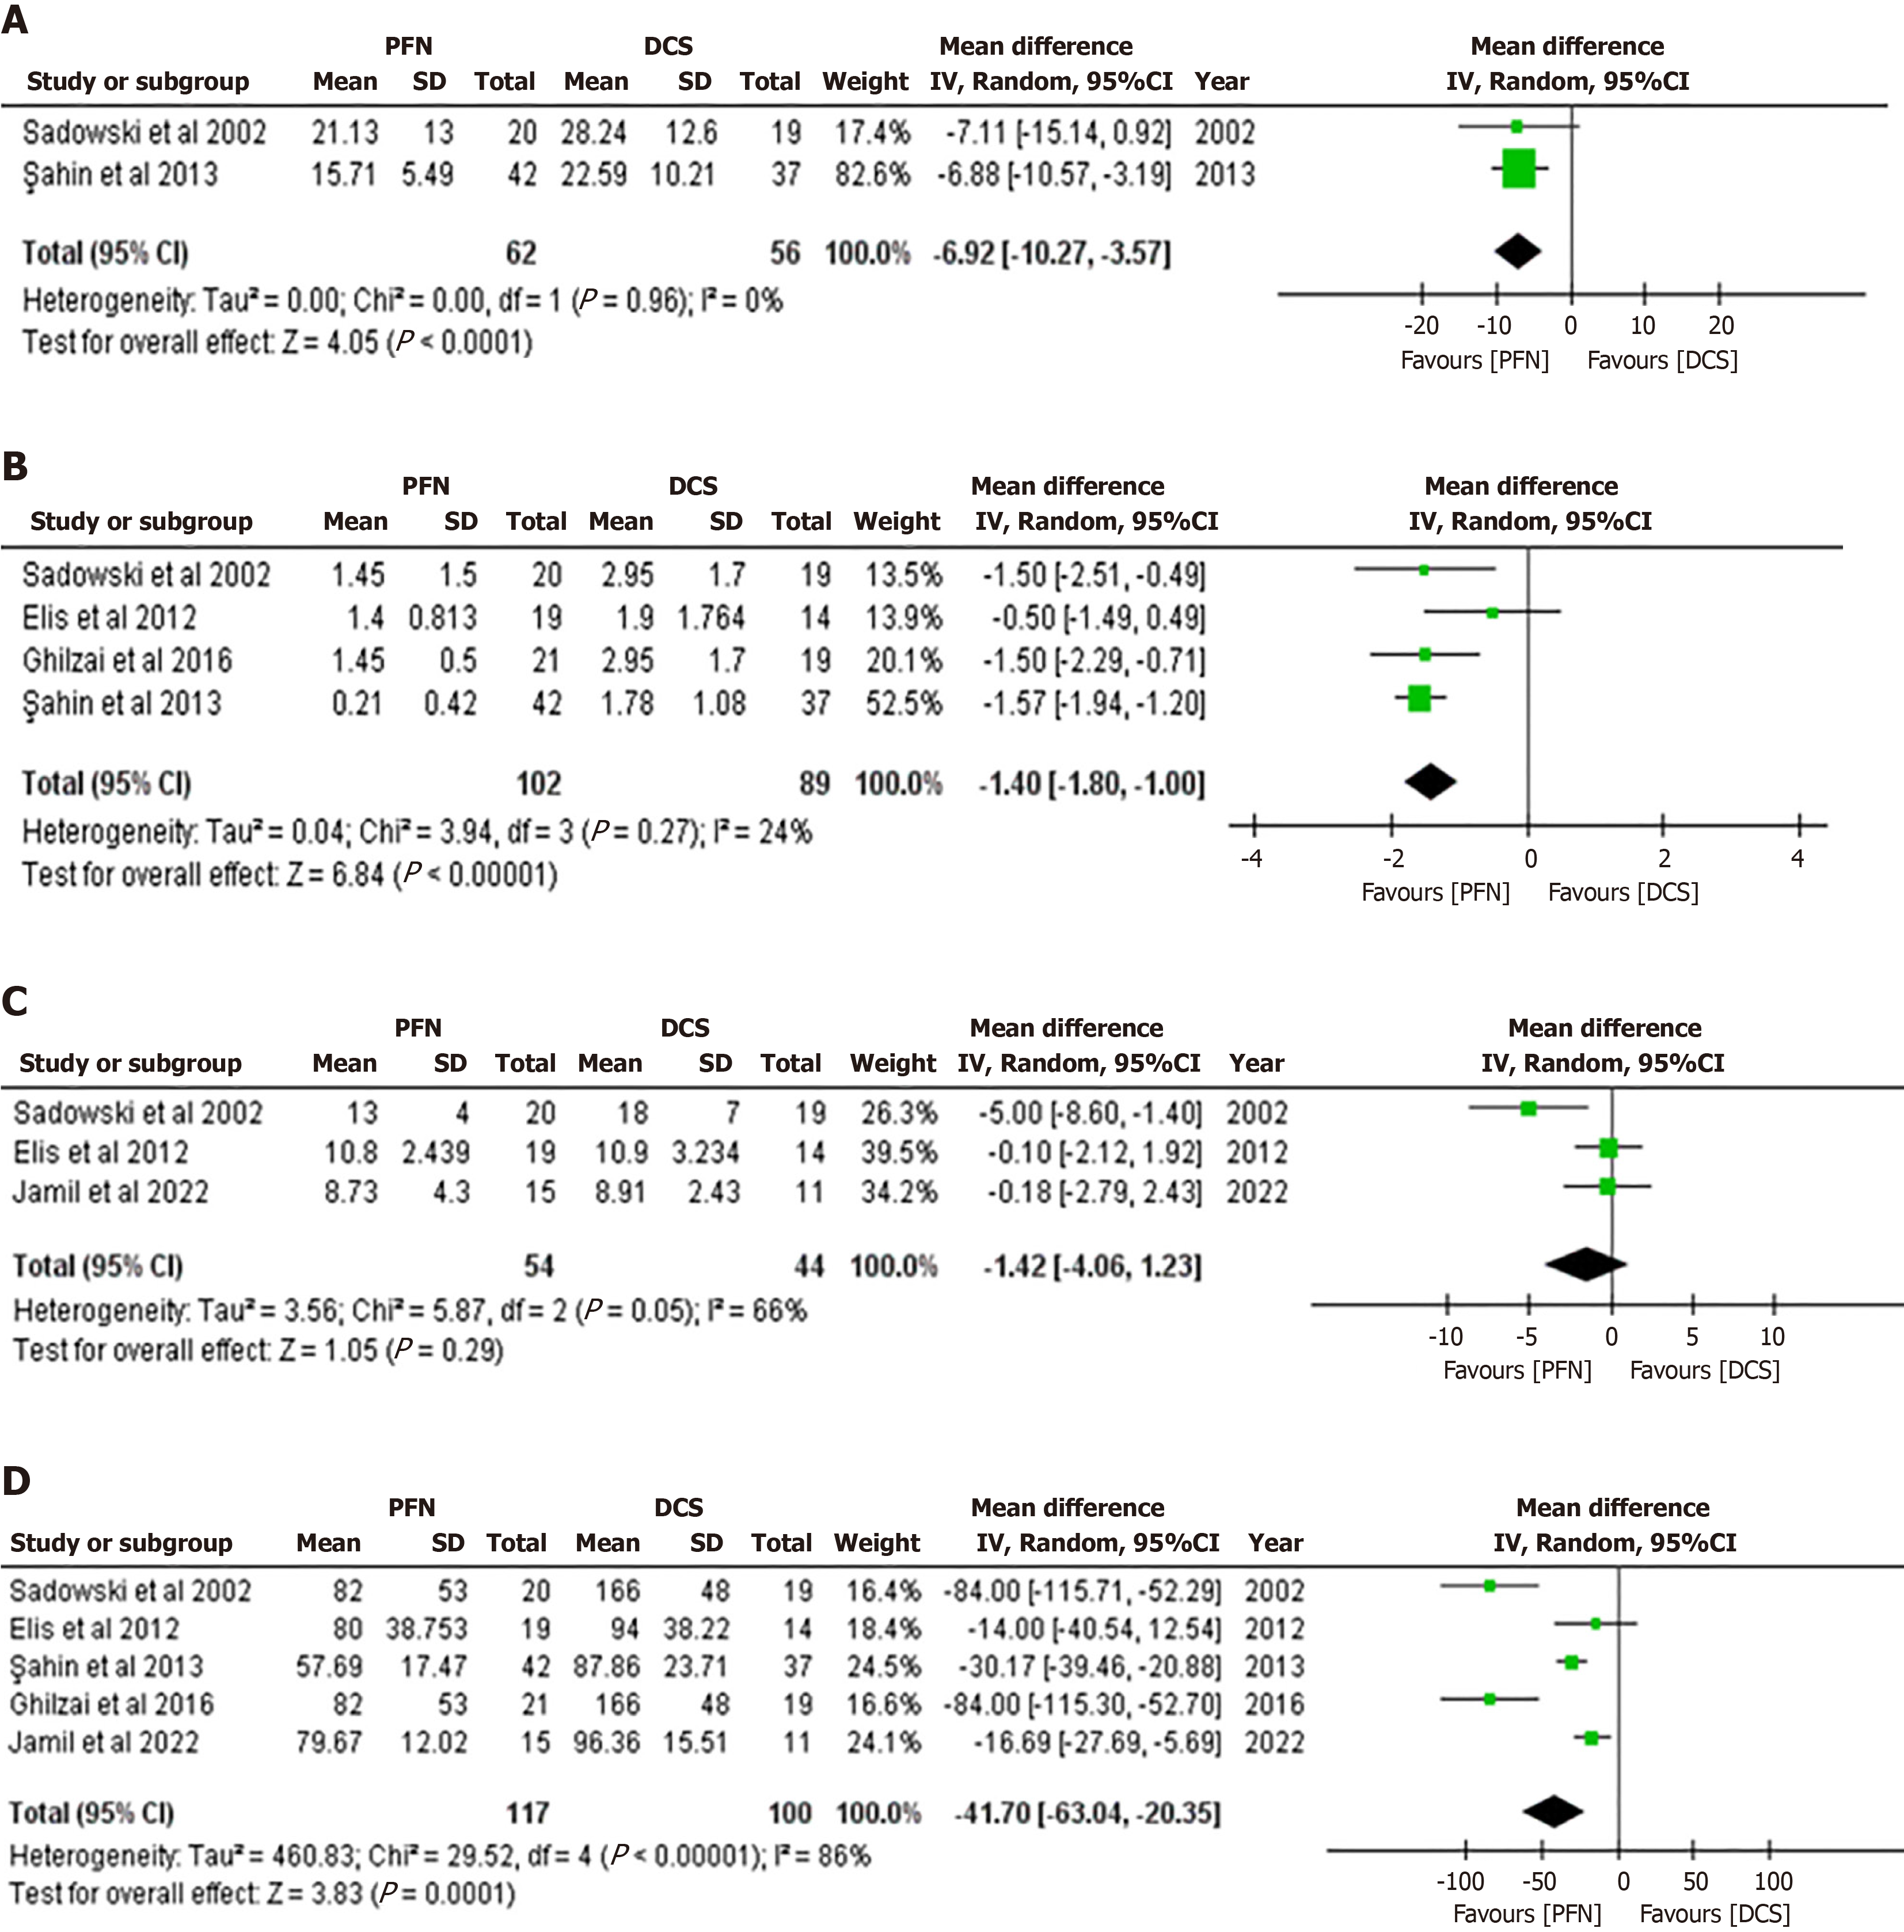
Figure 4 Effectiveness metrics comparing proximal femoral nails vs dynamic condylar screws by forest plot.
A: Impact on earlier fracture union time in wk; B: Effect on the amount of blood transfused in units; C: Influence on hospital stay duration in d; D: Impact on the length of the operation in min. 95%CI: 95% Confidence interval; DCS: Dynamic condylar screws; PFN: Proximal femoral nails.
Figure 5 Reduction type comparison between proximal femoral nails and dynamic condylar screws by forest plot.
A: Open reduction; B: Closed reduction. 95%CI: 95% Confidence interval; DCS: Dynamic condylar screw; PFN: Proximal femoral nail.
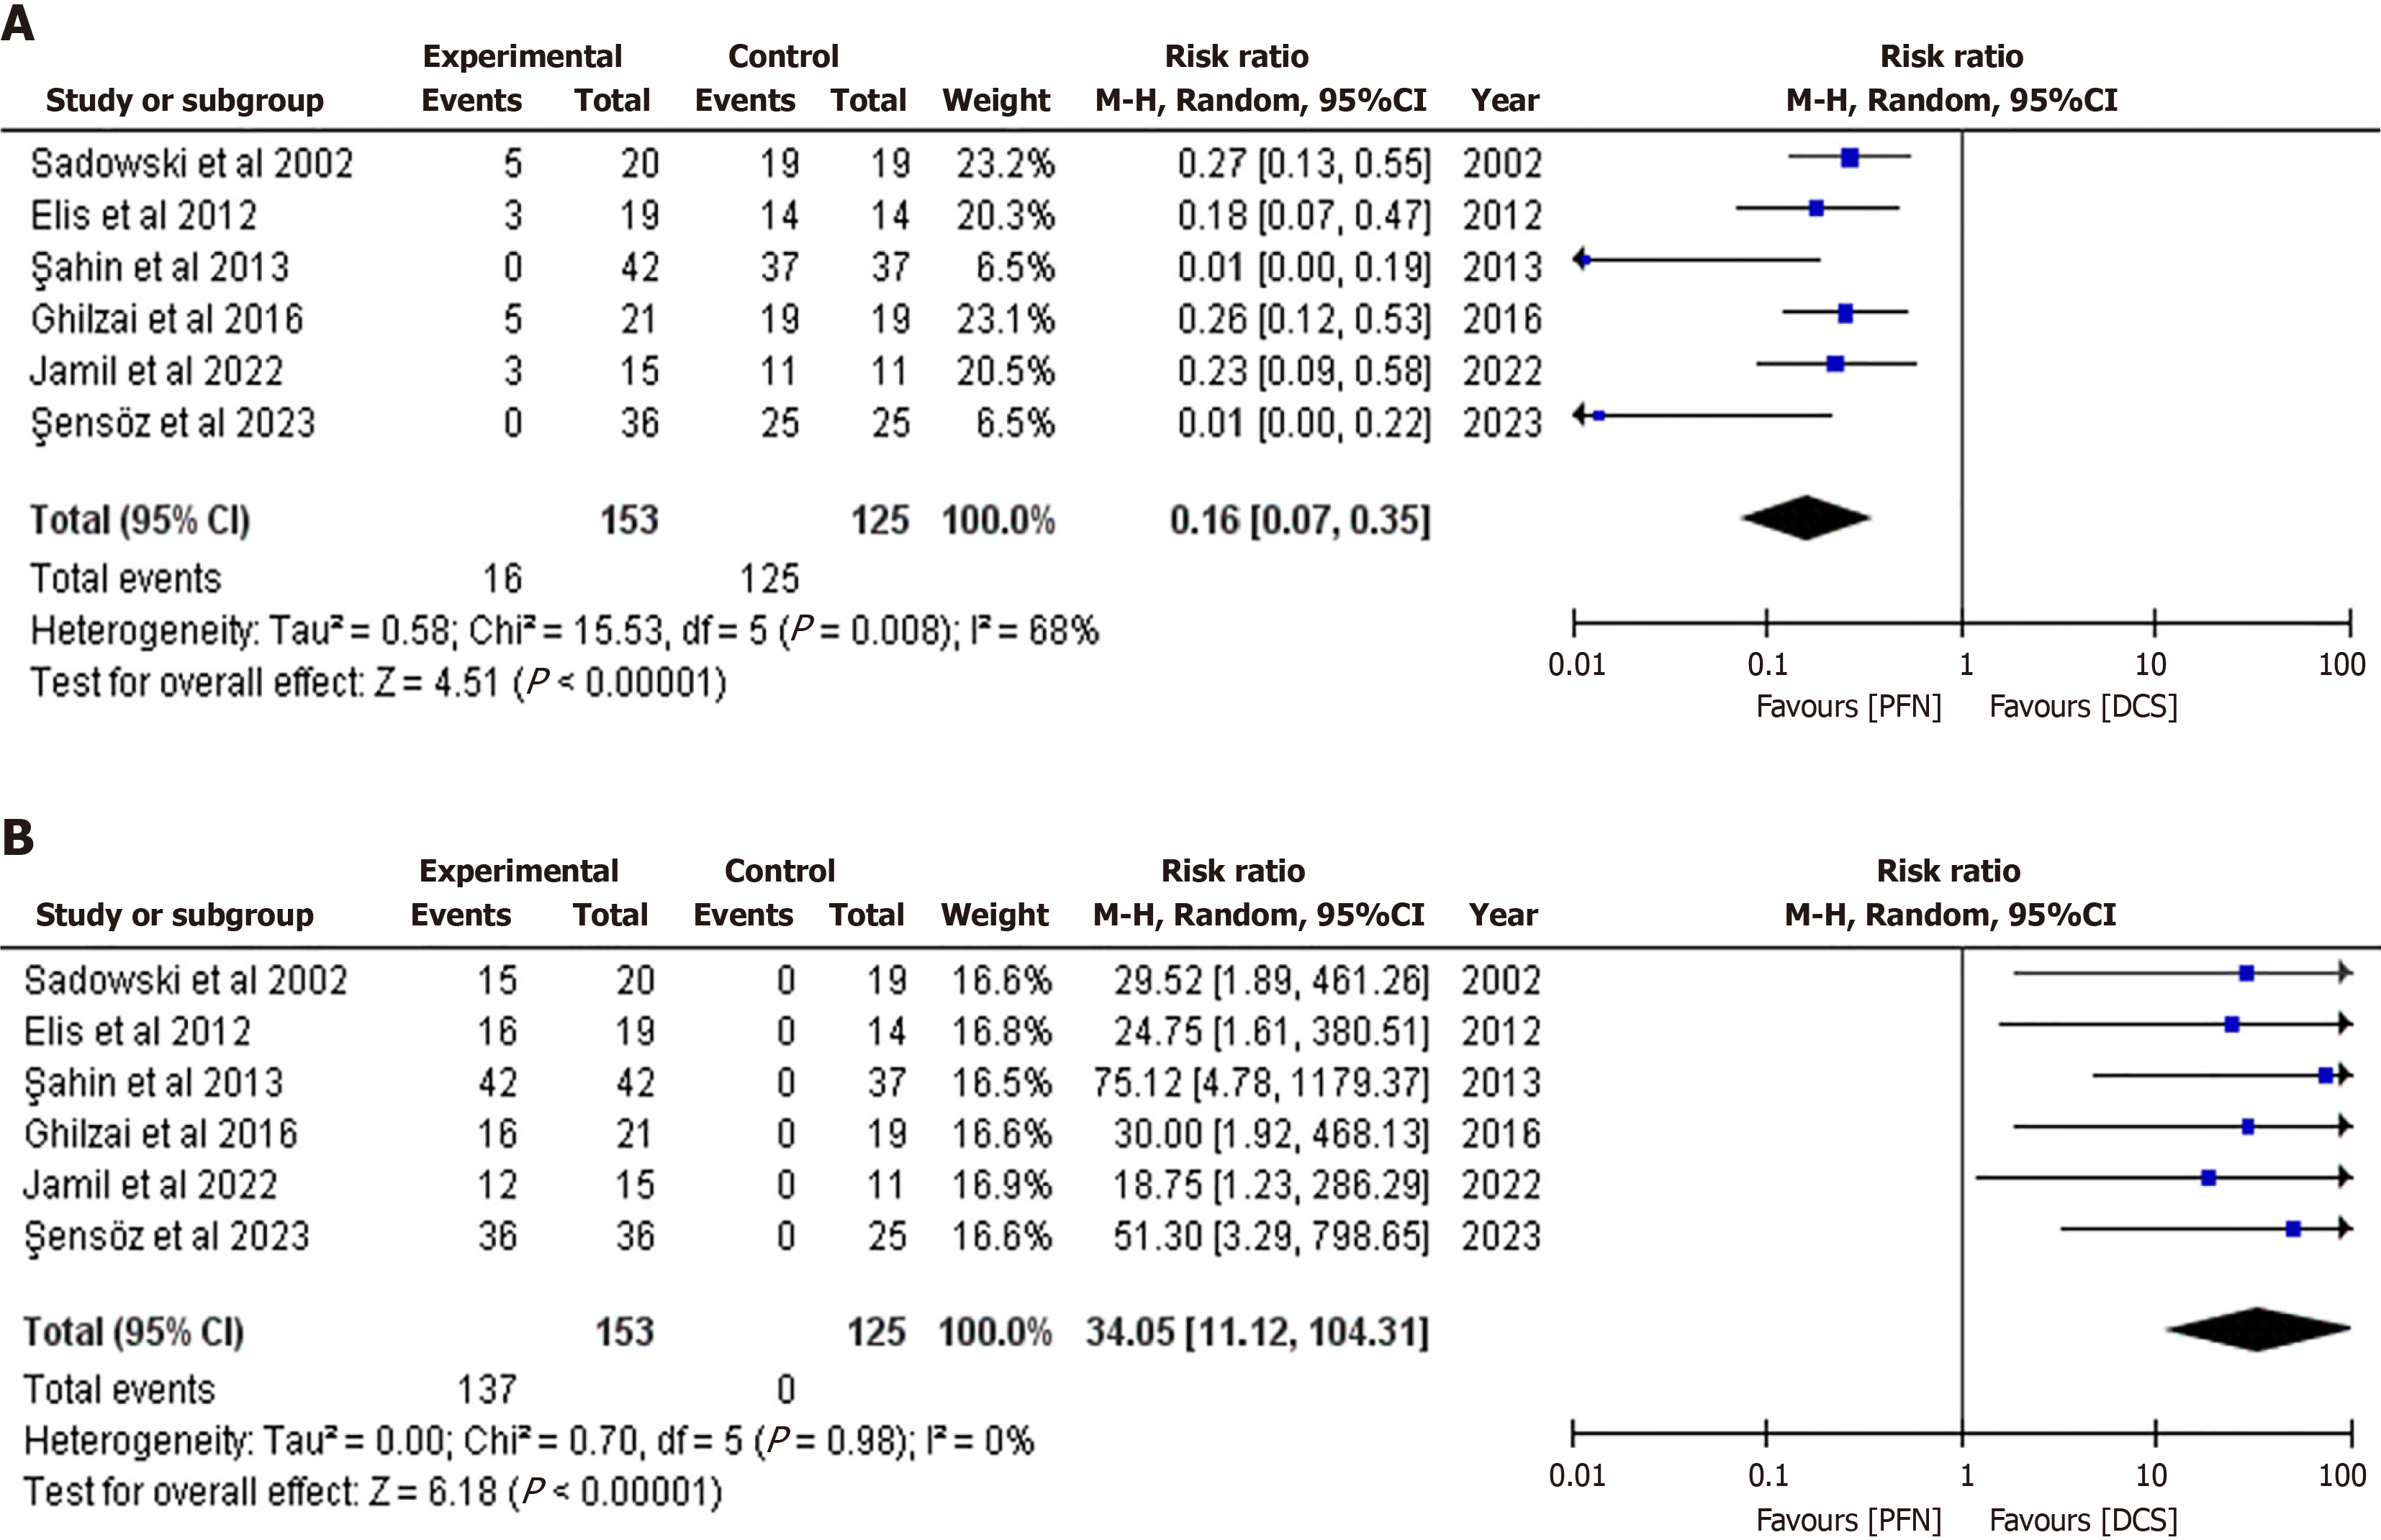
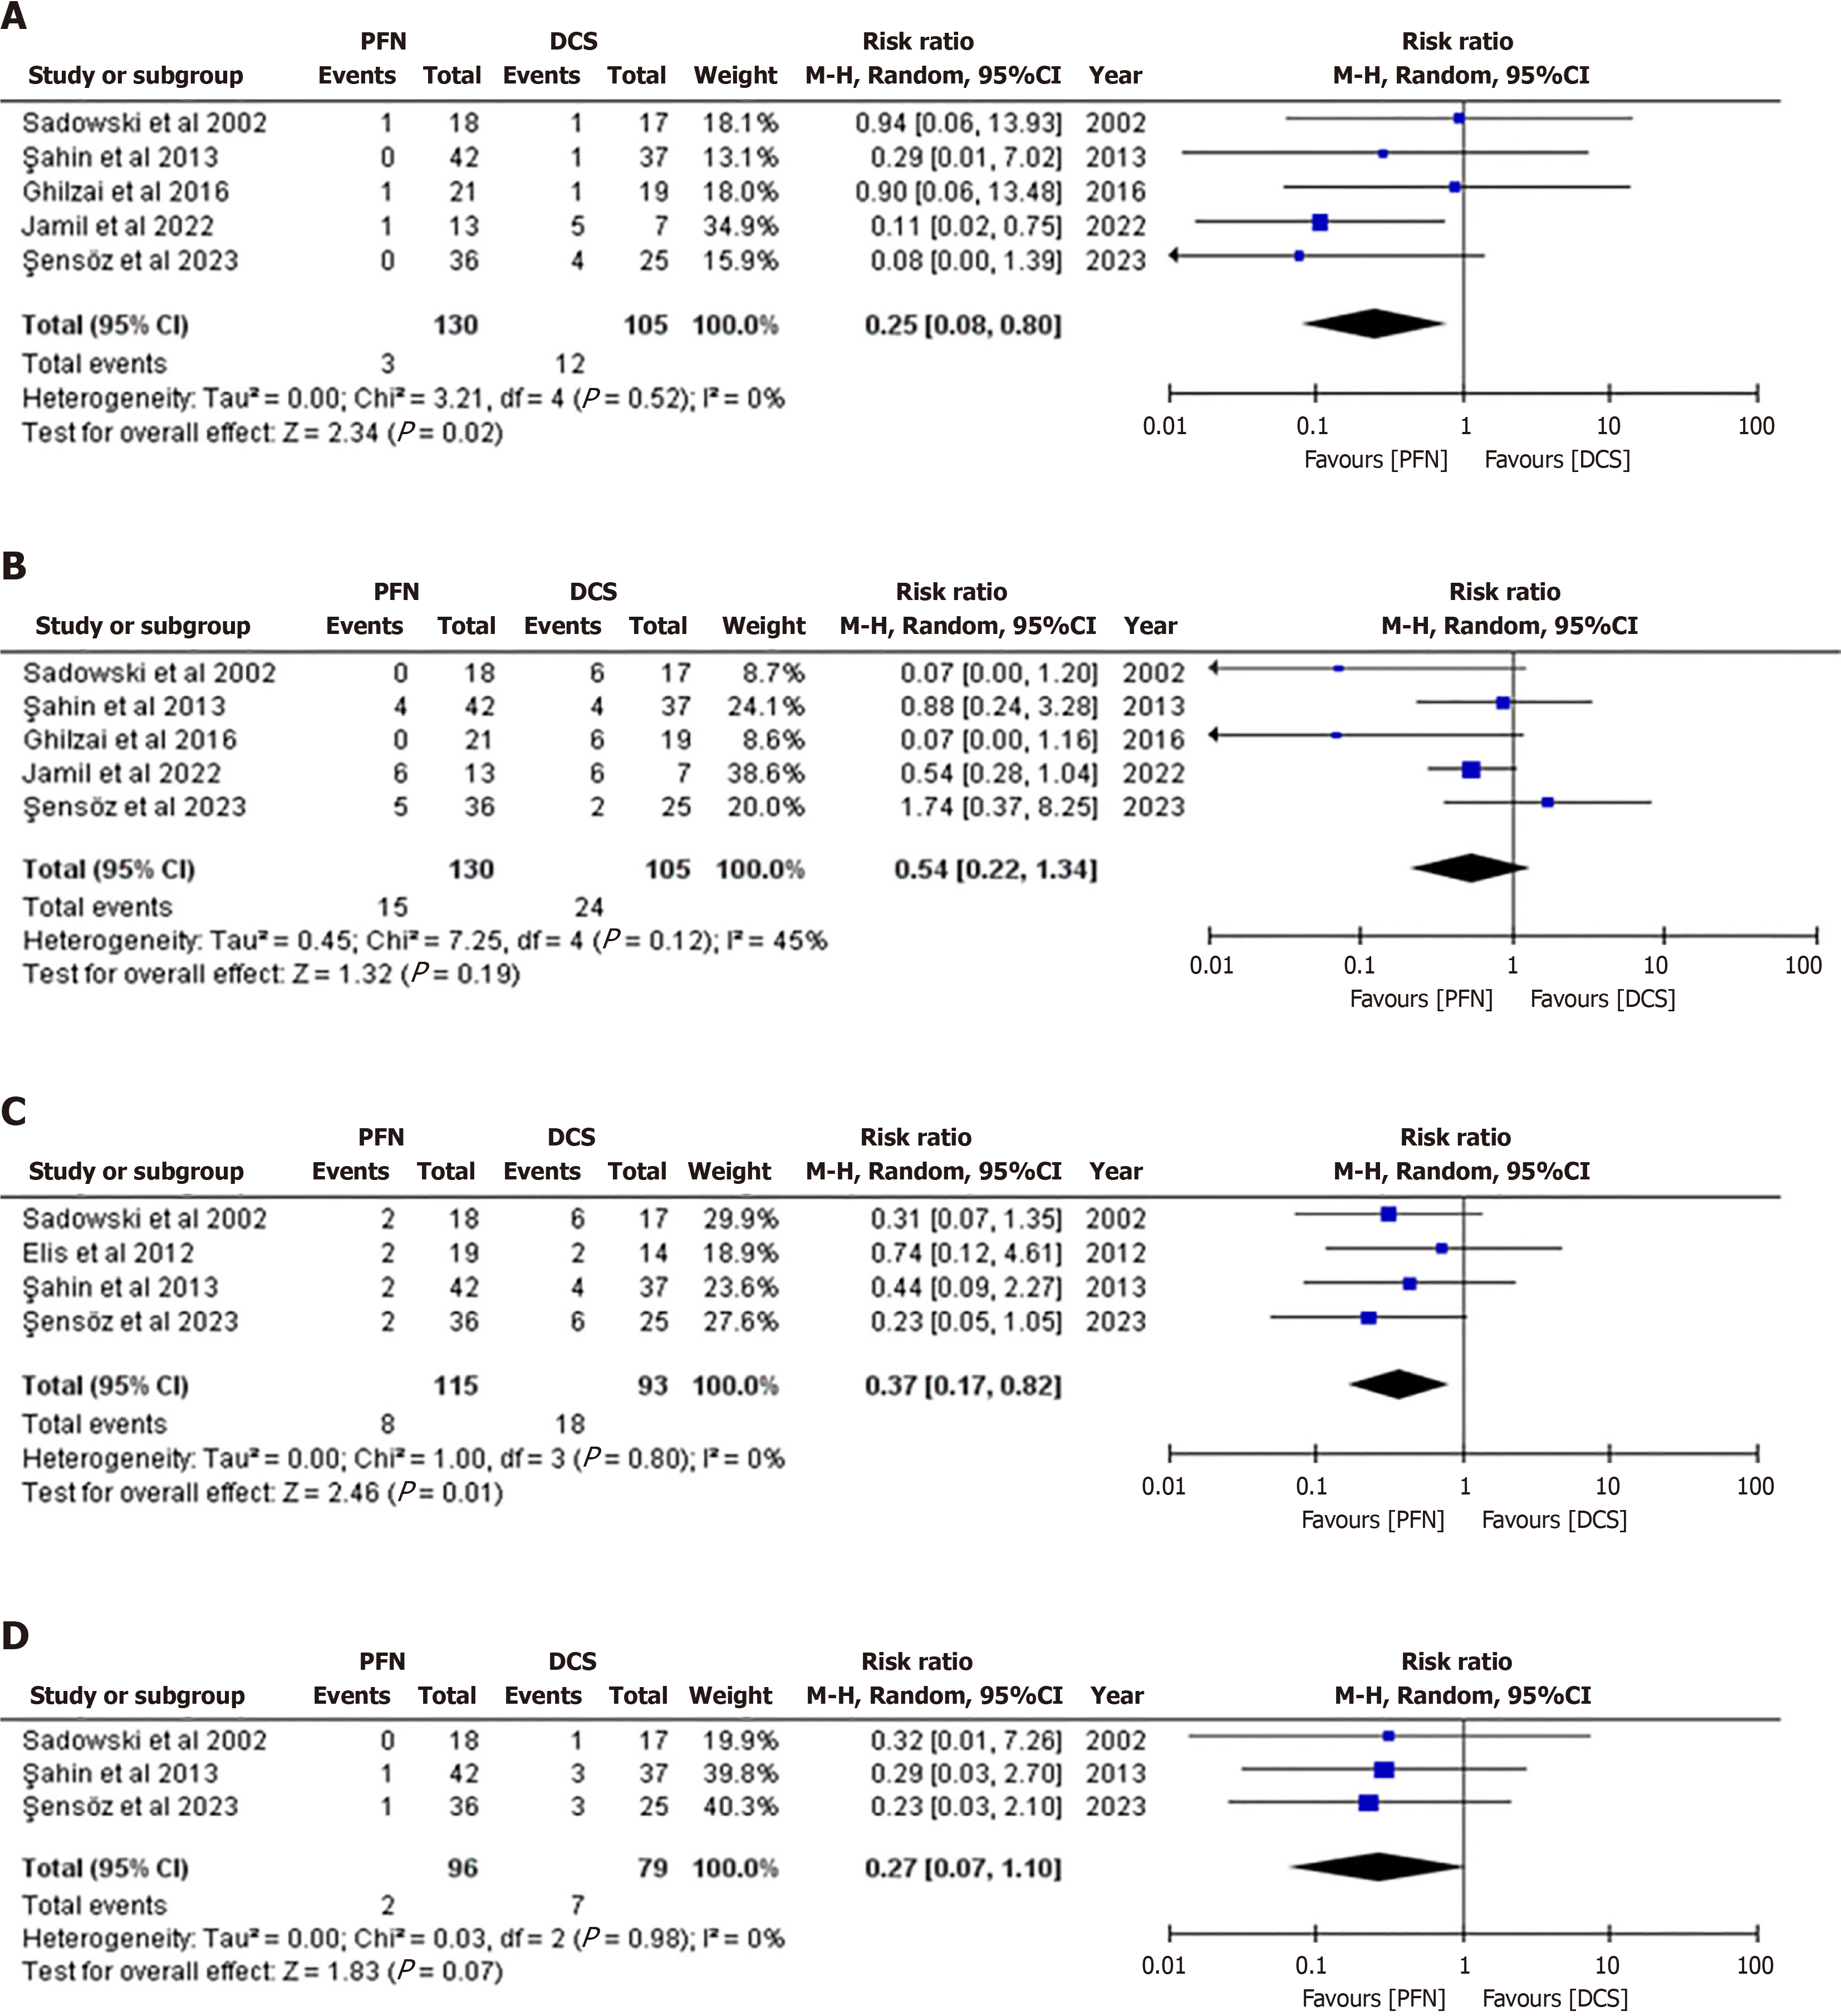
Figure 6 Safety and adverse events comparison between proximal femoral nails and dynamic condylar screws by forest plot.
A: Nonunion; B: Implant-related complications; C: Revision surgery or reoperation; D: Infection. 95%CI: 95% Confidence interval; DCS: Dynamic condylar screw; PFN: Proximal femoral nail.
- Citation: Yousif Mohamed AM, Salih M, Abdulgadir M, Abbas AE, Lutfi Turjuman D. Comparative efficacy of proximal femoral nail vs dynamic condylar screw in treating unstable intertrochanteric fractures. World J Orthop 2024; 15(8): 796-806
- URL: https://www.wjgnet.com/2218-5836/full/v15/i8/796.htm
- DOI: https://dx.doi.org/10.5312/wjo.v15.i8.796


