Copyright
©The Author(s) 2024.
World J Orthop. Aug 18, 2024; 15(8): 754-763
Published online Aug 18, 2024. doi: 10.5312/wjo.v15.i8.754
Published online Aug 18, 2024. doi: 10.5312/wjo.v15.i8.754
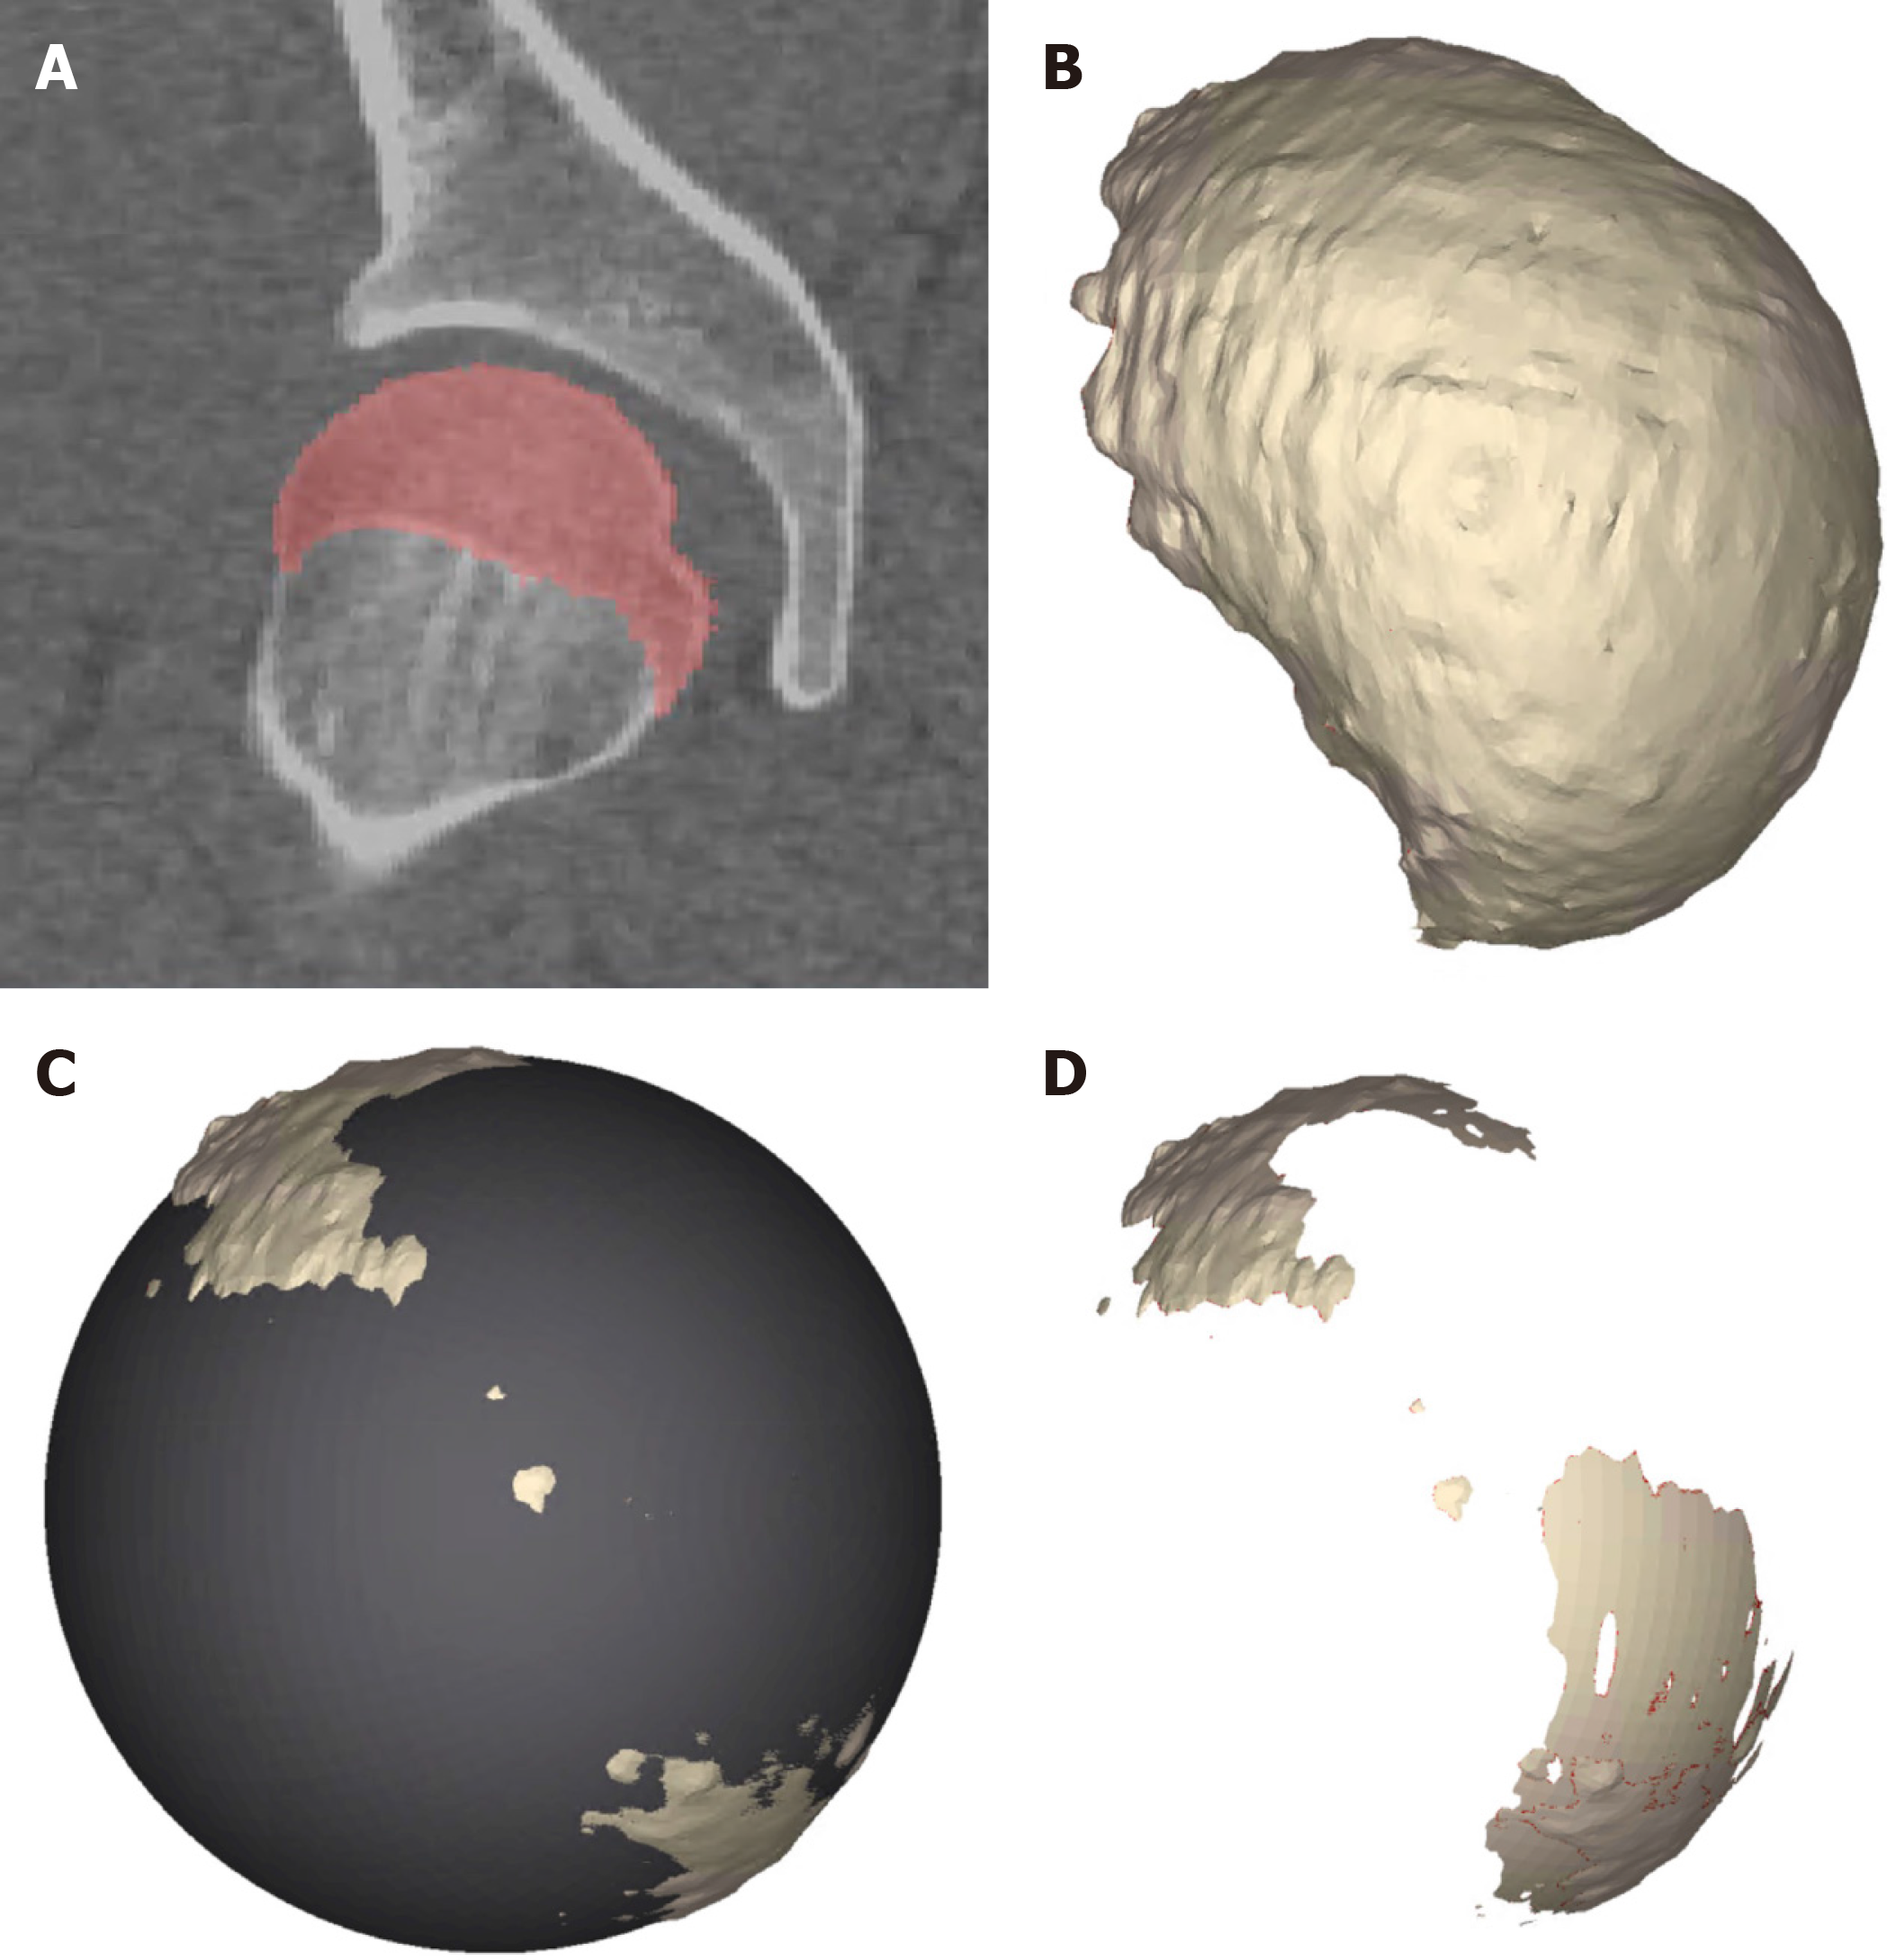
Figure 1 Three-dimensional morphological analysis.
A: Three-dimensional (3D) segmentation; B: 3D model reconstruction; C: Best-fit sphere; D: Boolean subtraction to fins residual regions.
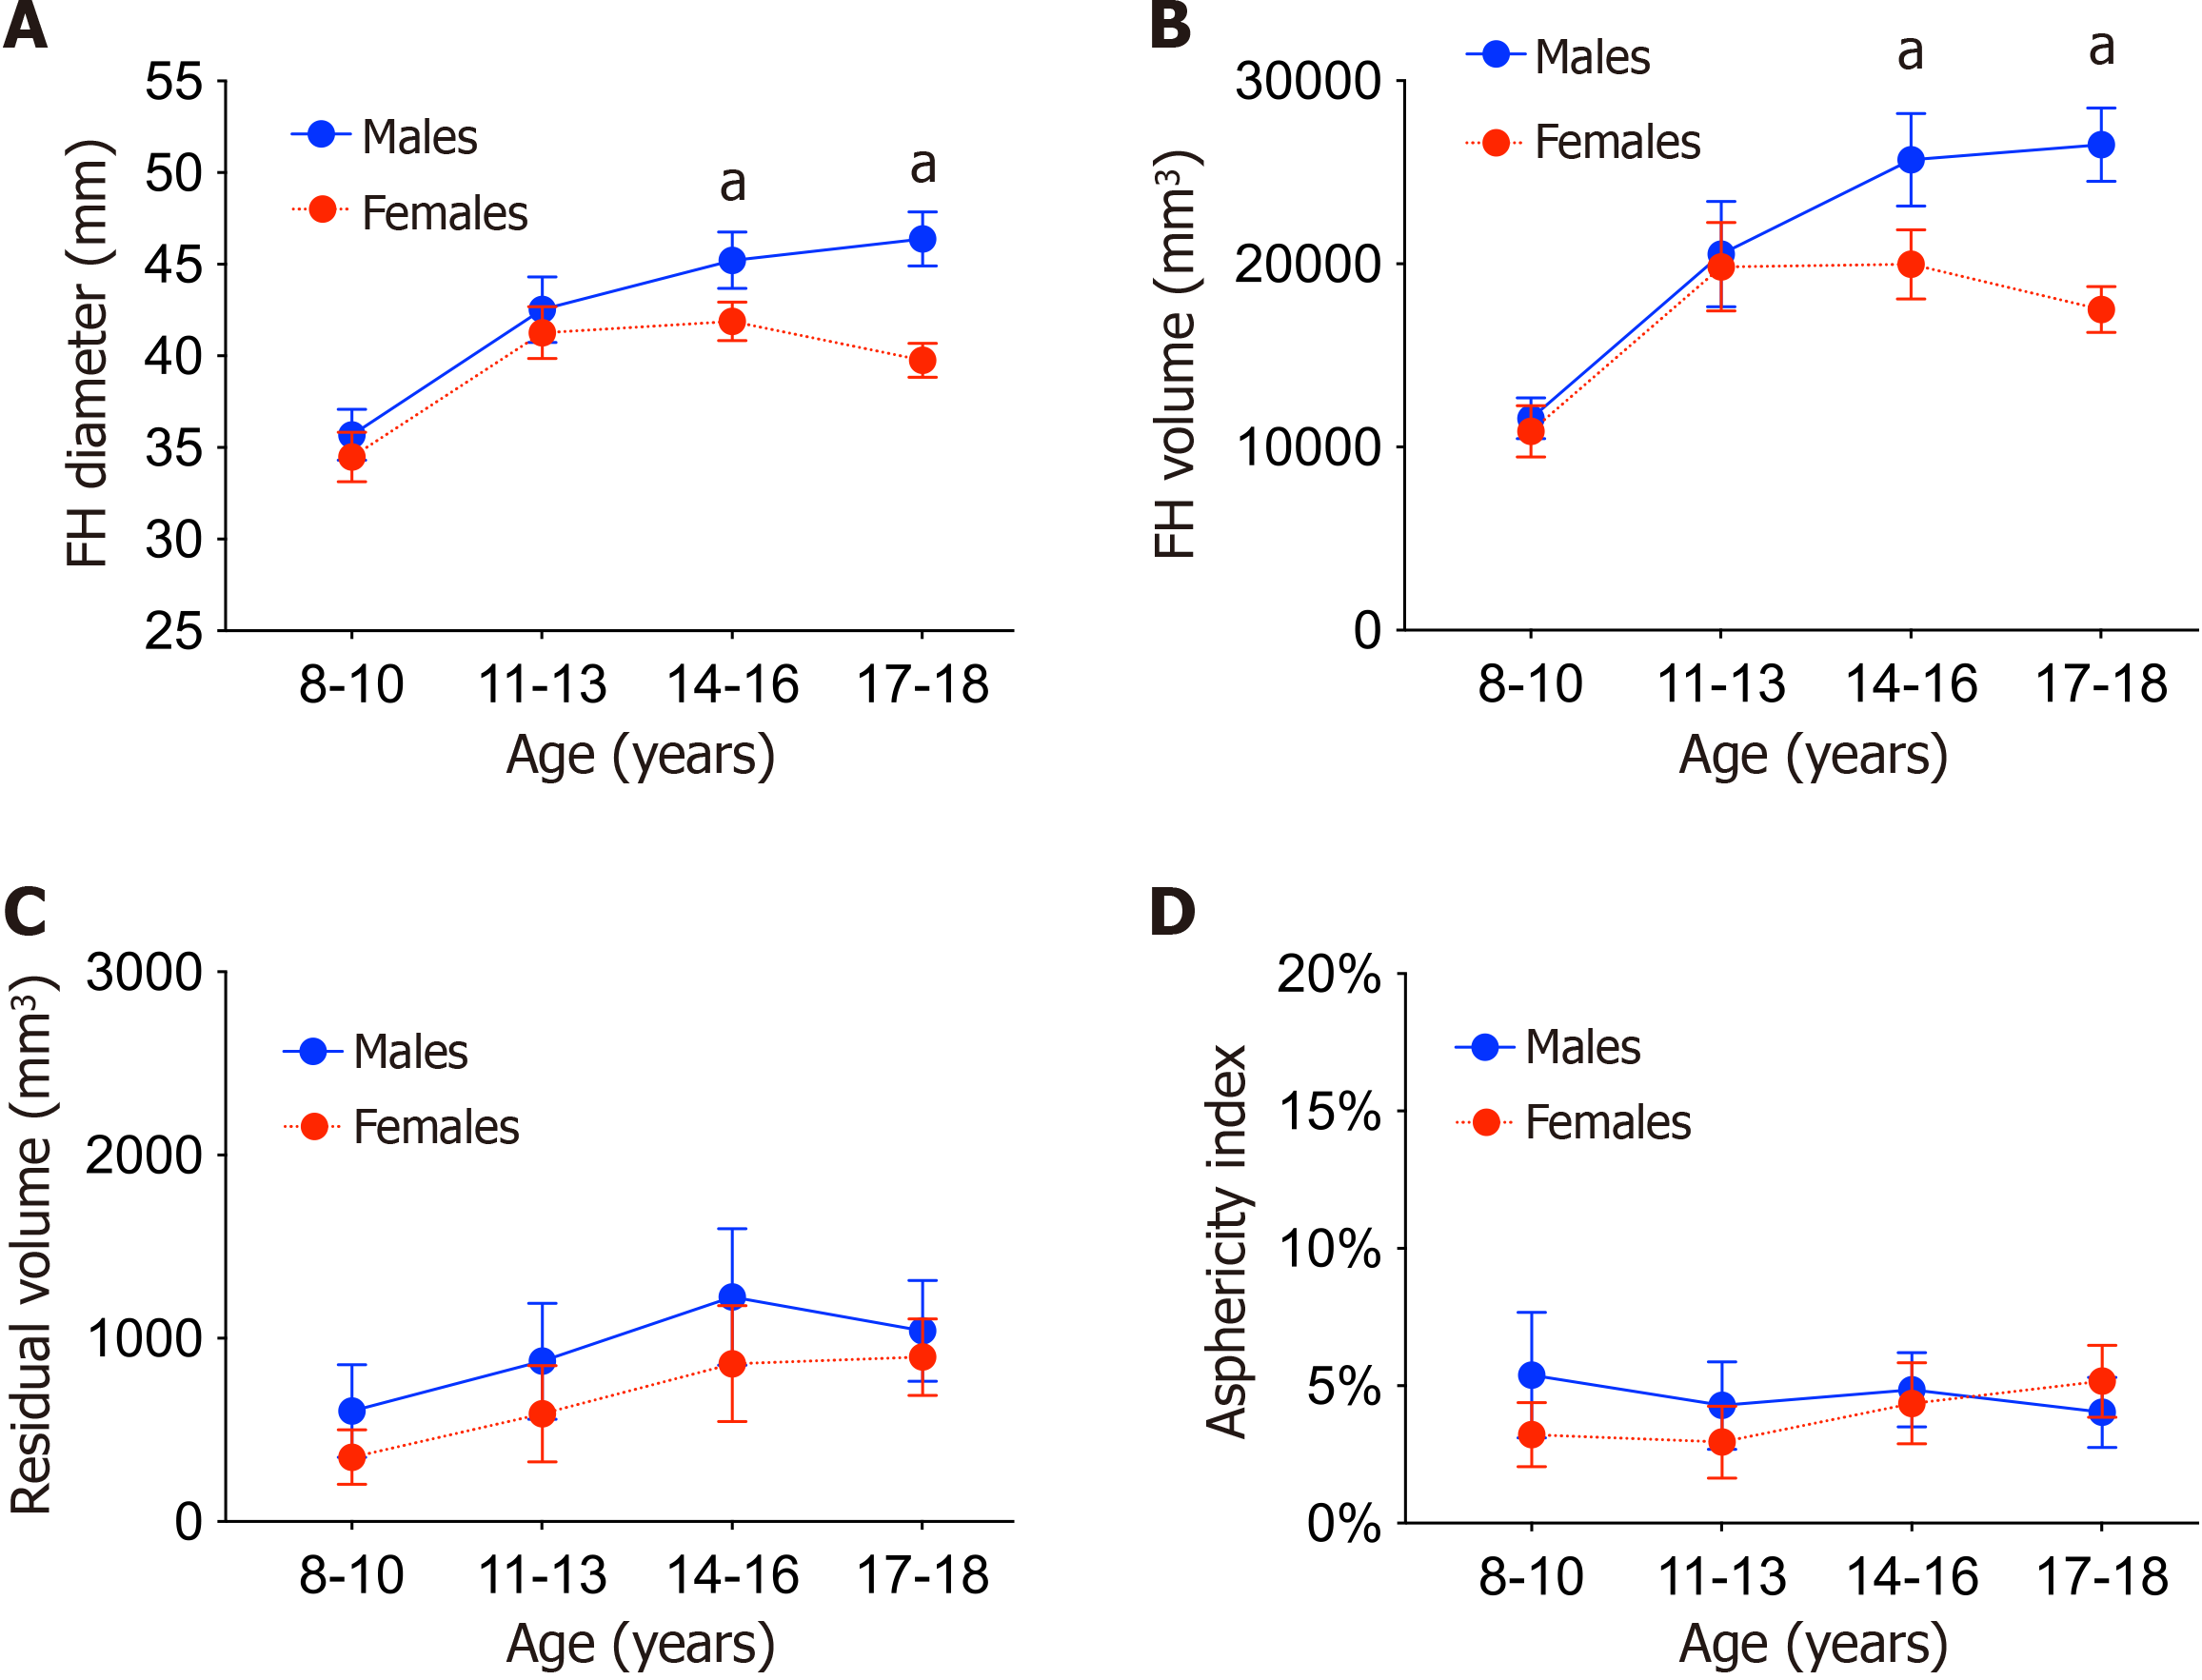
Figure 2 Sex differences in femoral head diameter, femoral head volume, residual volume and asphericity index.
A: Femoral head diameter; B: Femoral head volume; C: Residual volume; D: Asphericity index. Data are presented as mean (95% confidence interval). aP < 0.001. FH: Femoral head.
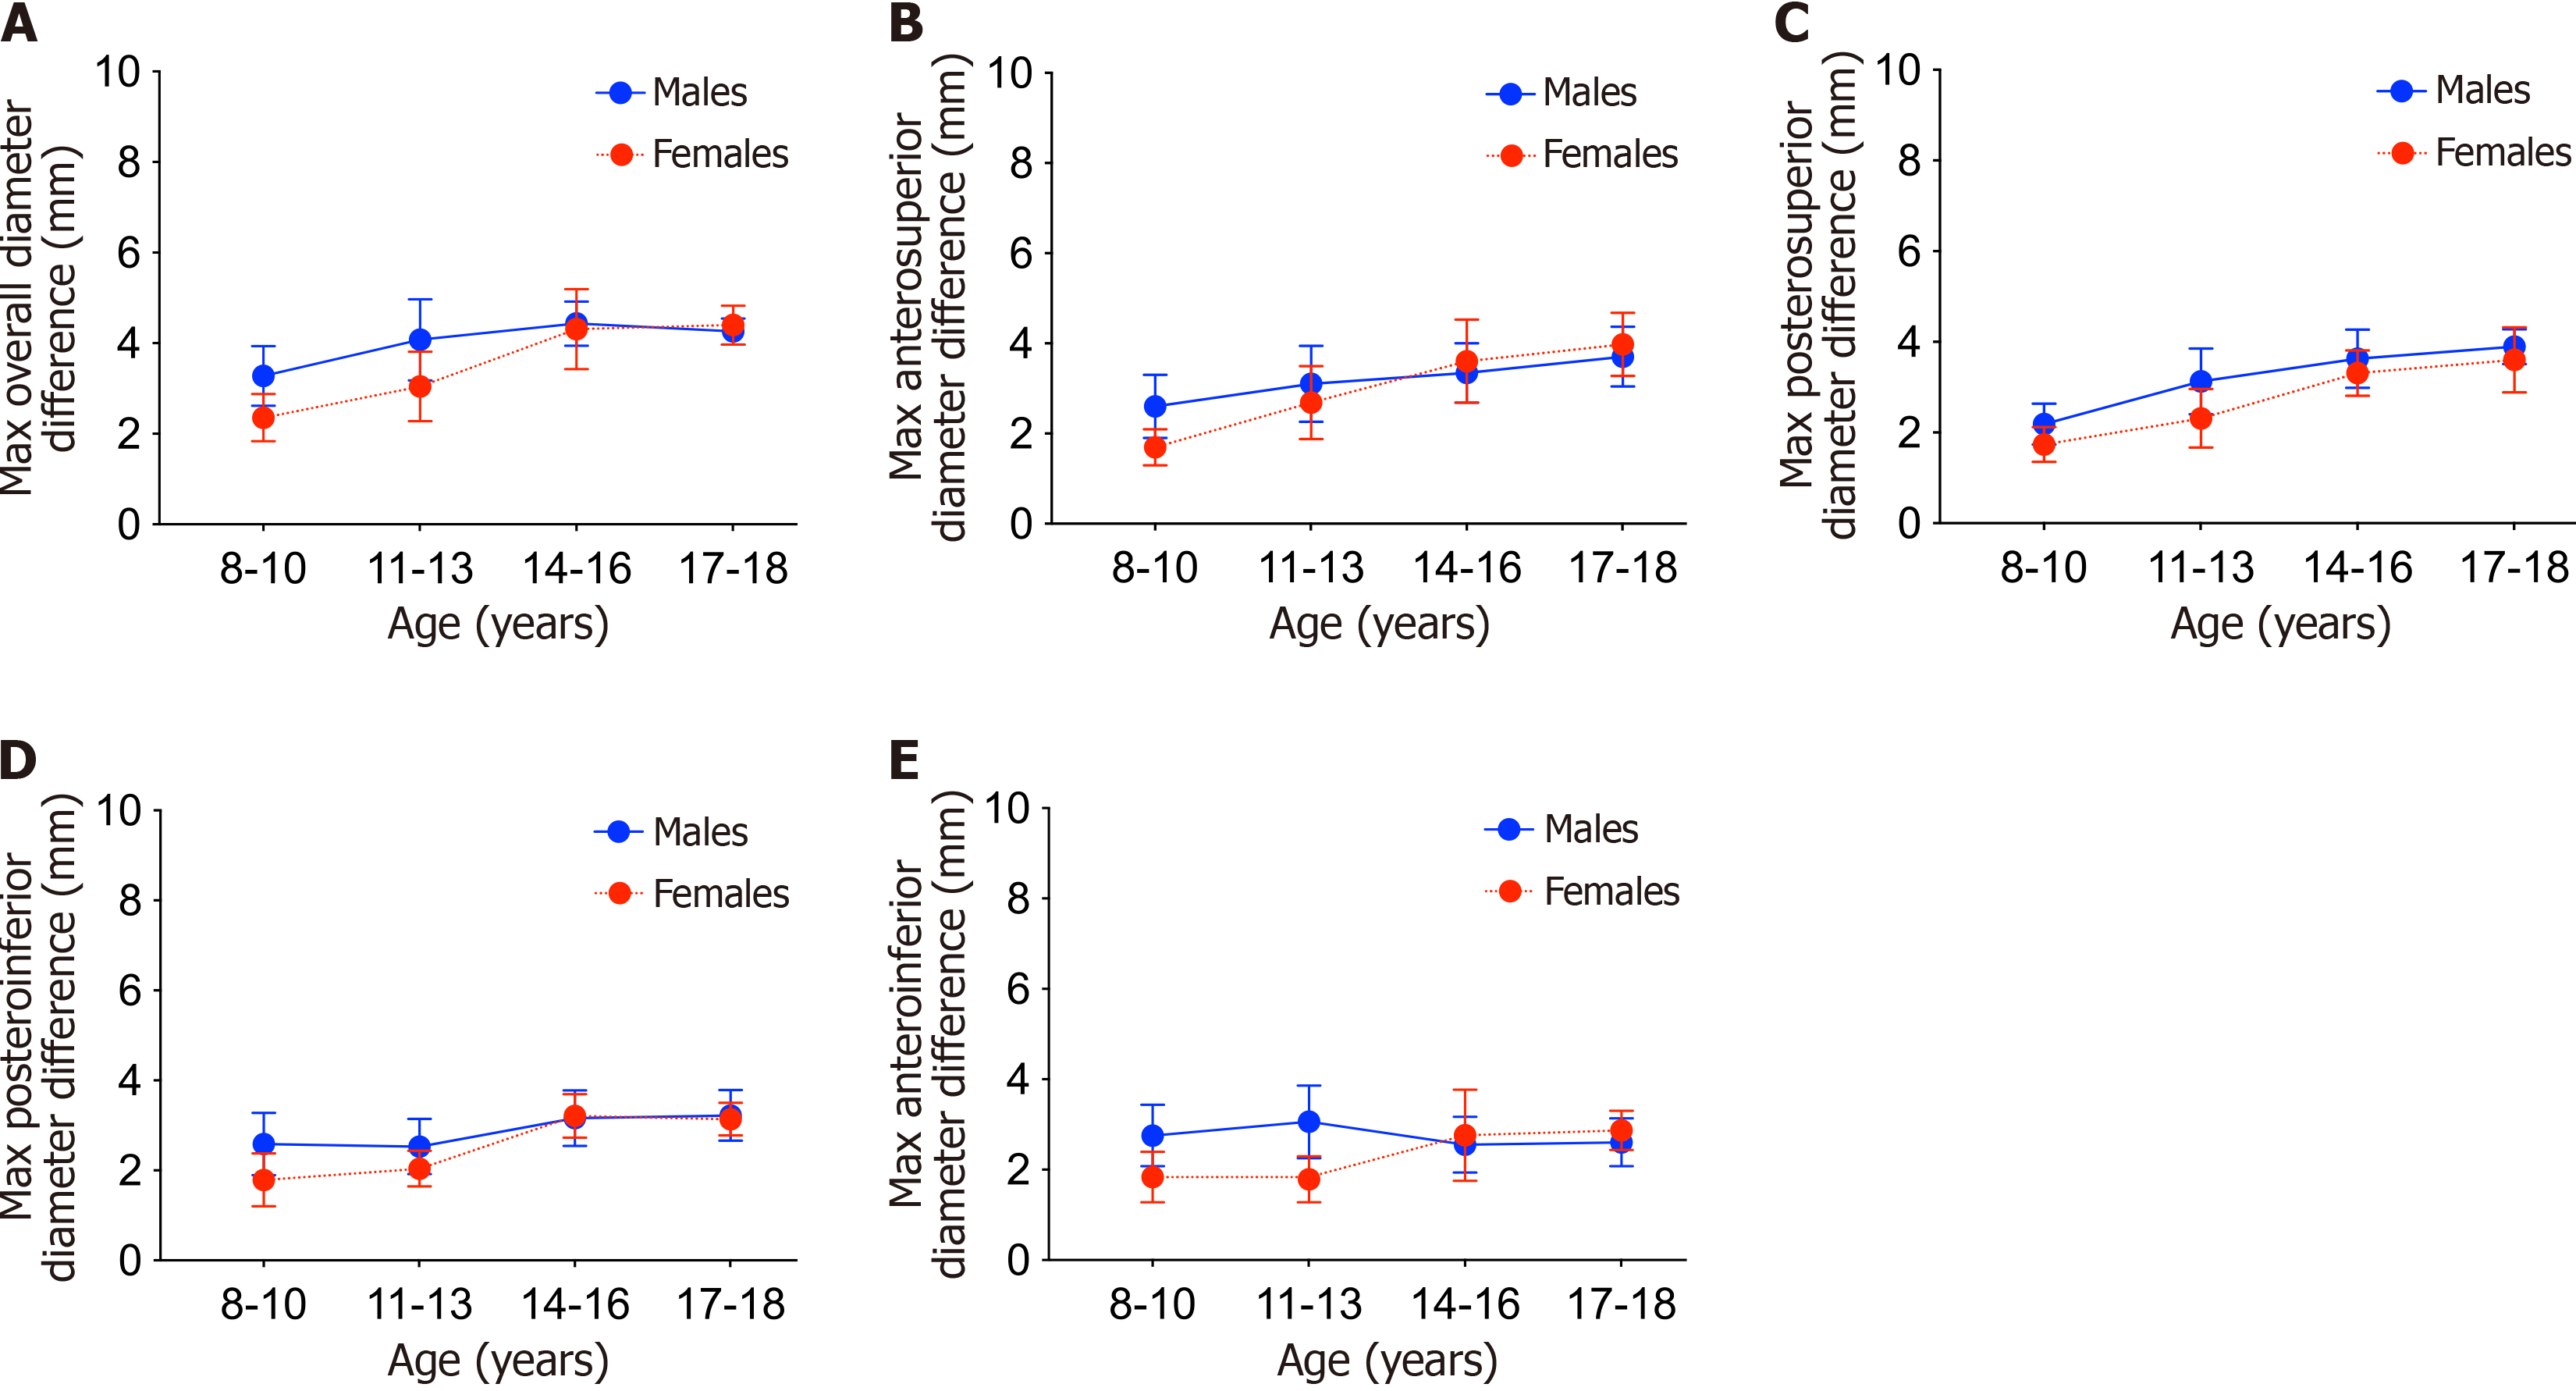
Figure 3 Sex differences in maximum diameter difference across the whole femoral head (overall) and across each quadrant.
A: Whole femoral head (overall); B: Anterosuperior quadrant; C: Posterosuperior quadrant; D: Posteroinferior quadrant; E: Anteroinferior quadrant. Data are presented as mean (95% confidence interval).
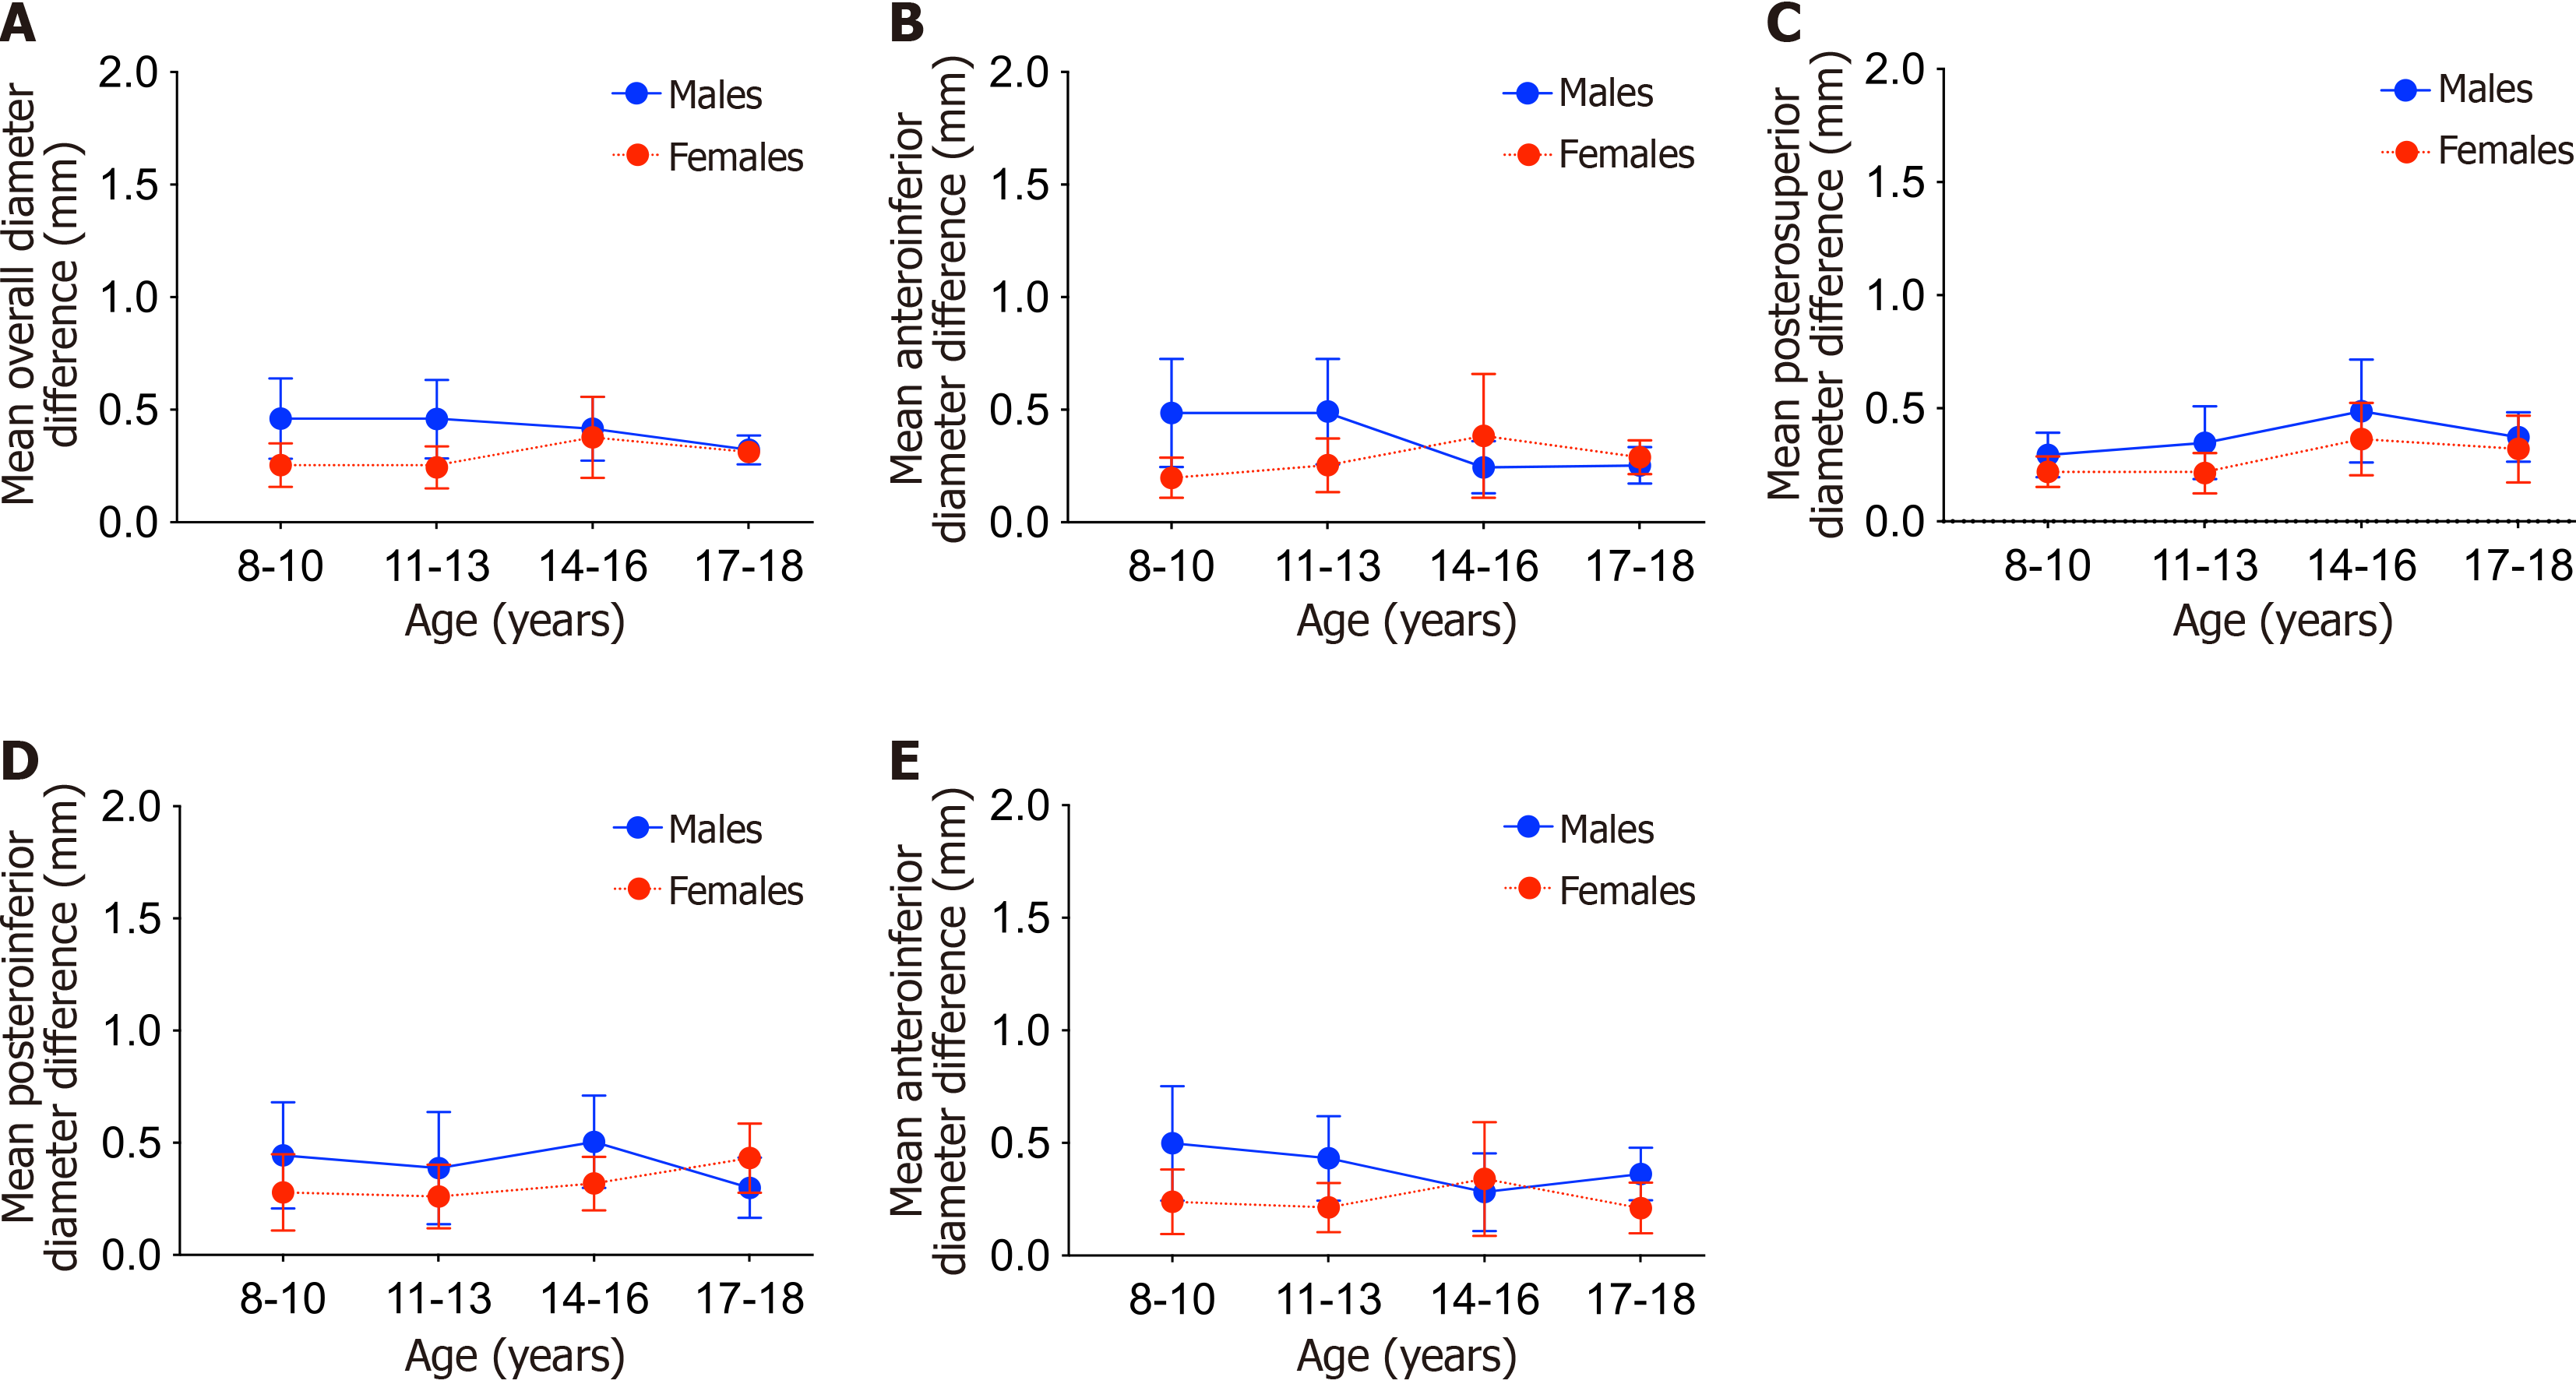
Figure 4 Sex differences in mean diameter difference across the whole femoral head (overall) and across each quadrant.
A: Whole femoral head (overall); B: Anterosuperior quadrant; C: Posterosuperior quadrant; D: Posteroinferior quadrant; E: Anteroinferior quadrant. Data are presented as mean (95% confidence interval).
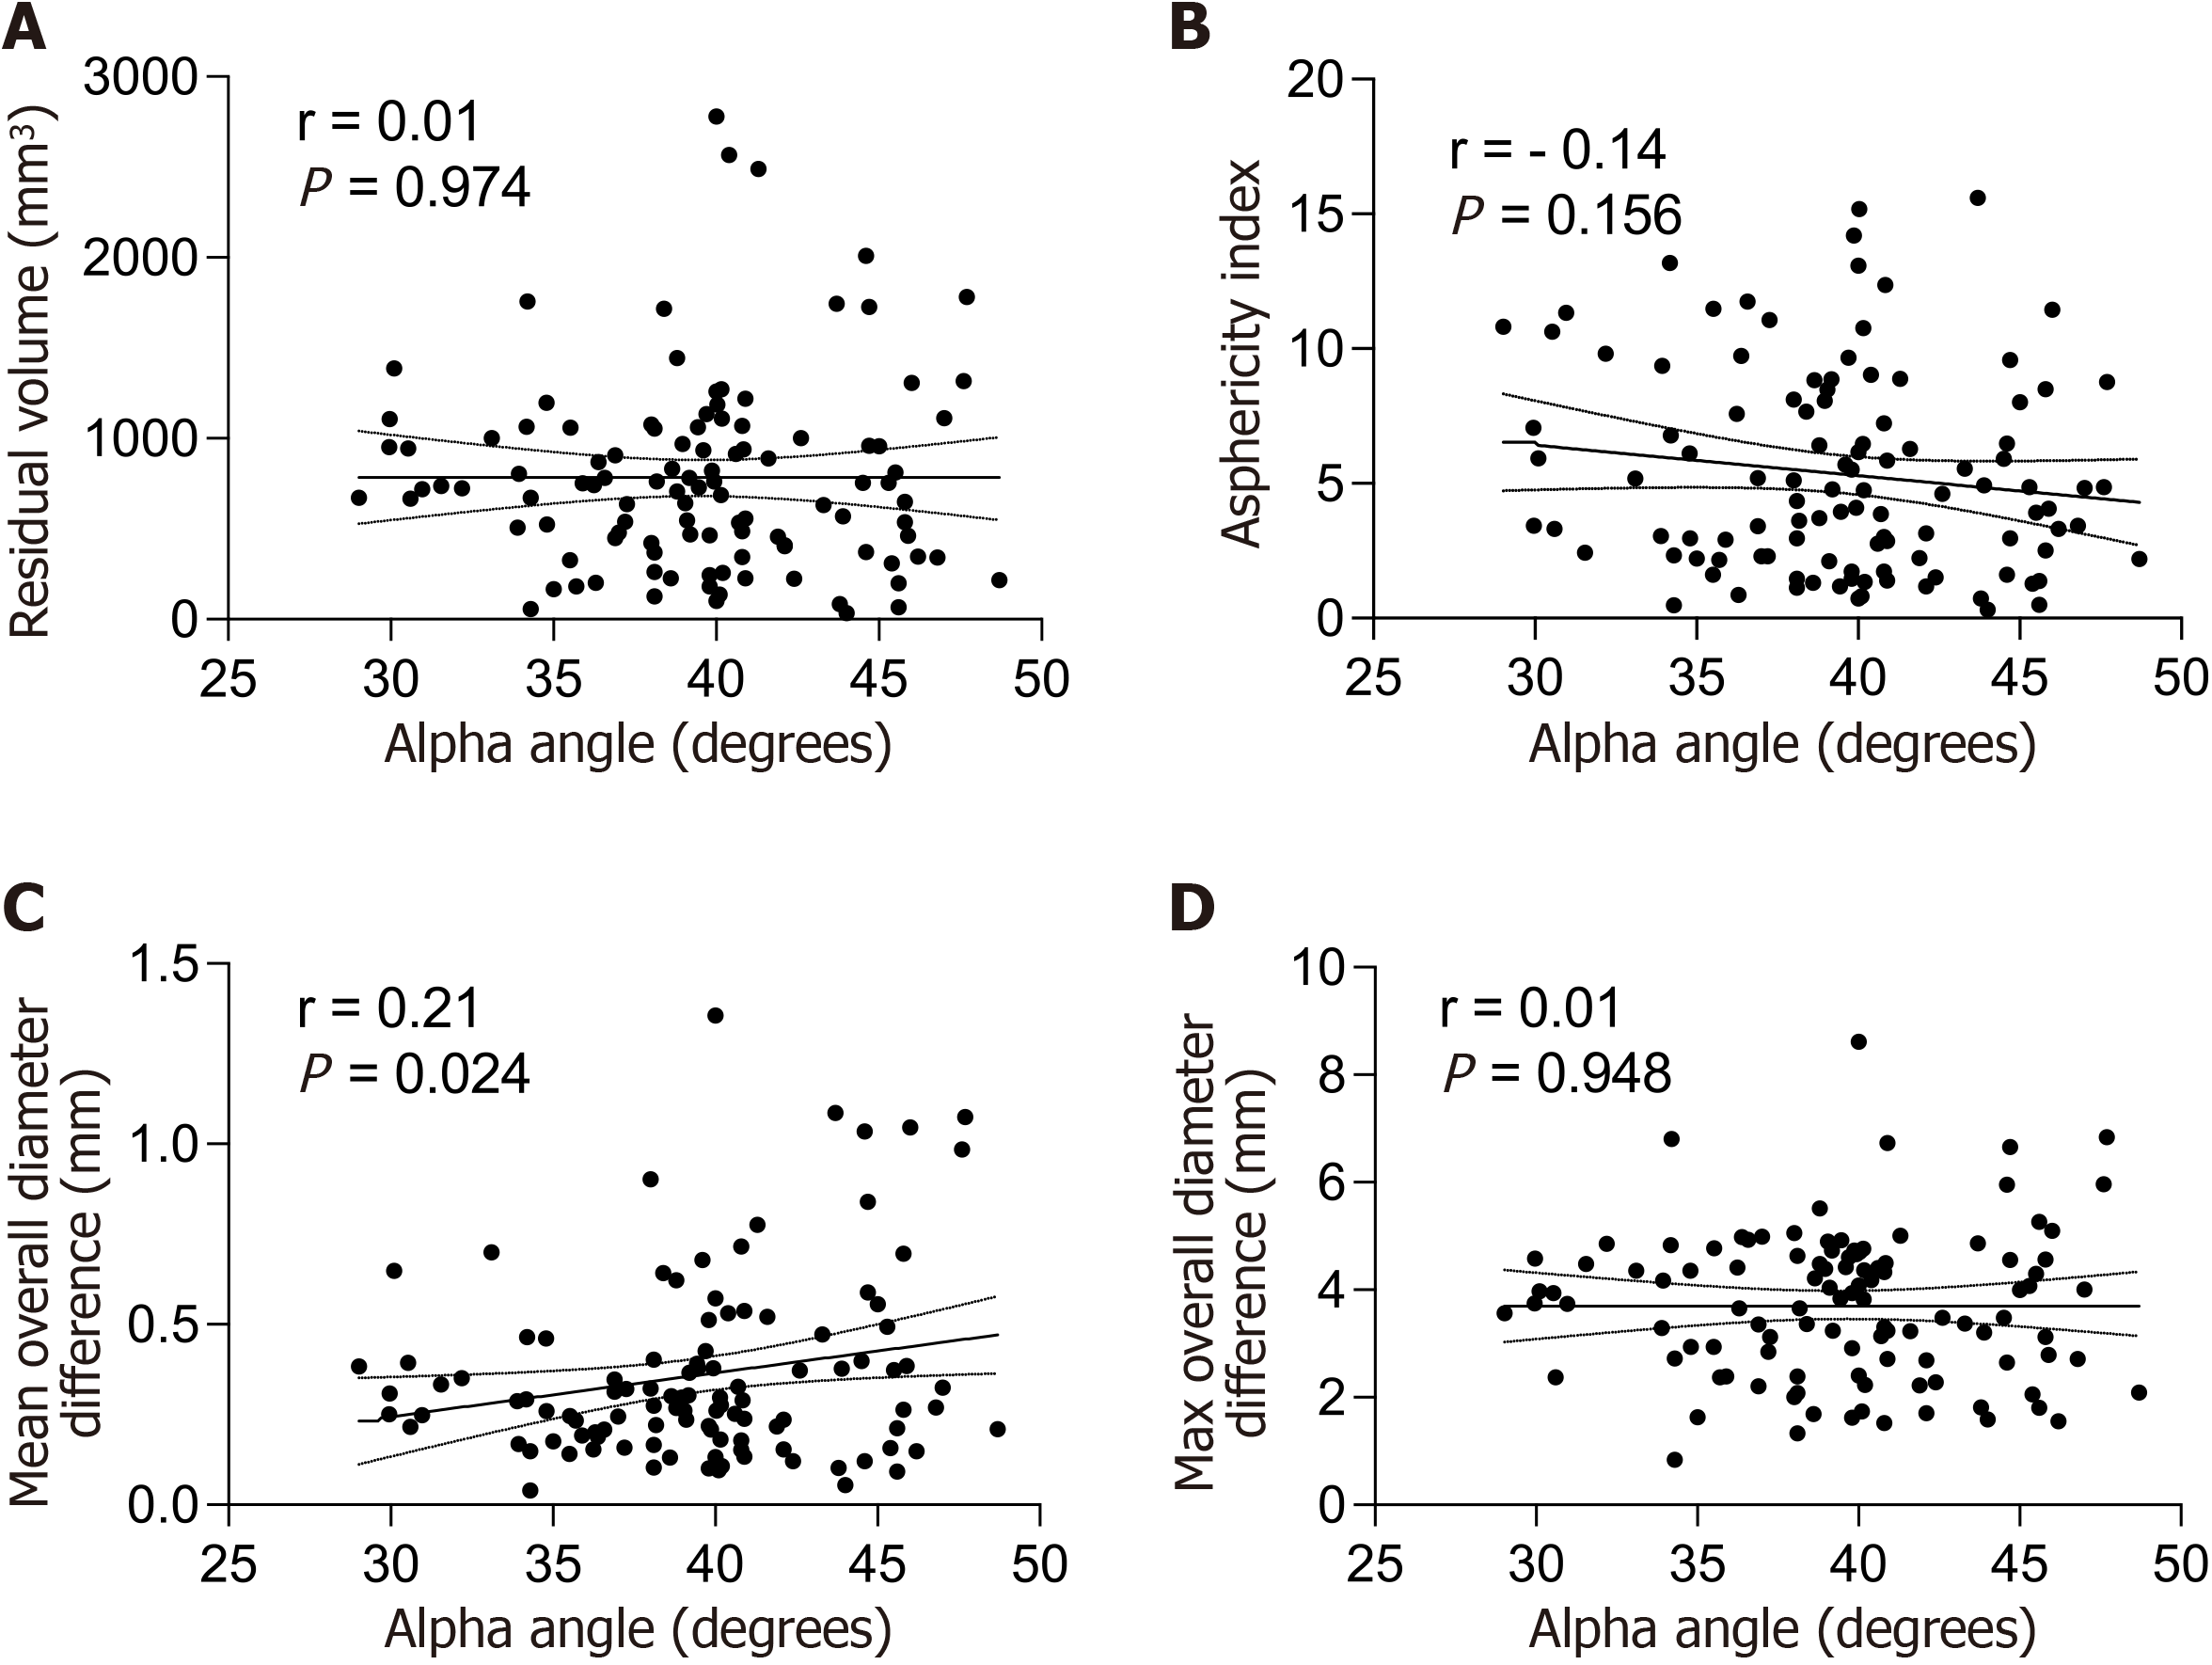
Figure 5 Pearson correlations between alpha angle and residual volume, asphericity index, mean overall diameter difference, and maximum overall diameter difference.
A: Pearson correlations between alpha angle and residual volume; B: Pearson correlations between alpha angle and asphericity index; C: Pearson correlations between alpha angle and mean overall diameter difference; D: Pearson correlations between alpha angle and maximum overall diameter difference.
- Citation: Hassan MM, Feroe AG, Douglass BW, Jimenez AE, Kuhns B, Mitchell CF, Parisien RL, Maranho DA, Novais EN, Kim YJ, Kiapour AM. Three-dimensional analysis of age and sex differences in femoral head asphericity in asymptomatic hips in the United States. World J Orthop 2024; 15(8): 754-763
- URL: https://www.wjgnet.com/2218-5836/full/v15/i8/754.htm
- DOI: https://dx.doi.org/10.5312/wjo.v15.i8.754


