Copyright
©The Author(s) 2024.
World J Orthop. Jul 18, 2024; 15(7): 650-659
Published online Jul 18, 2024. doi: 10.5312/wjo.v15.i7.650
Published online Jul 18, 2024. doi: 10.5312/wjo.v15.i7.650
Figure 1 Patient selection flowchart.
This flowchart was adjusted to STROBE guidelines. ICD-10: International Classification of Diseases, version 10.
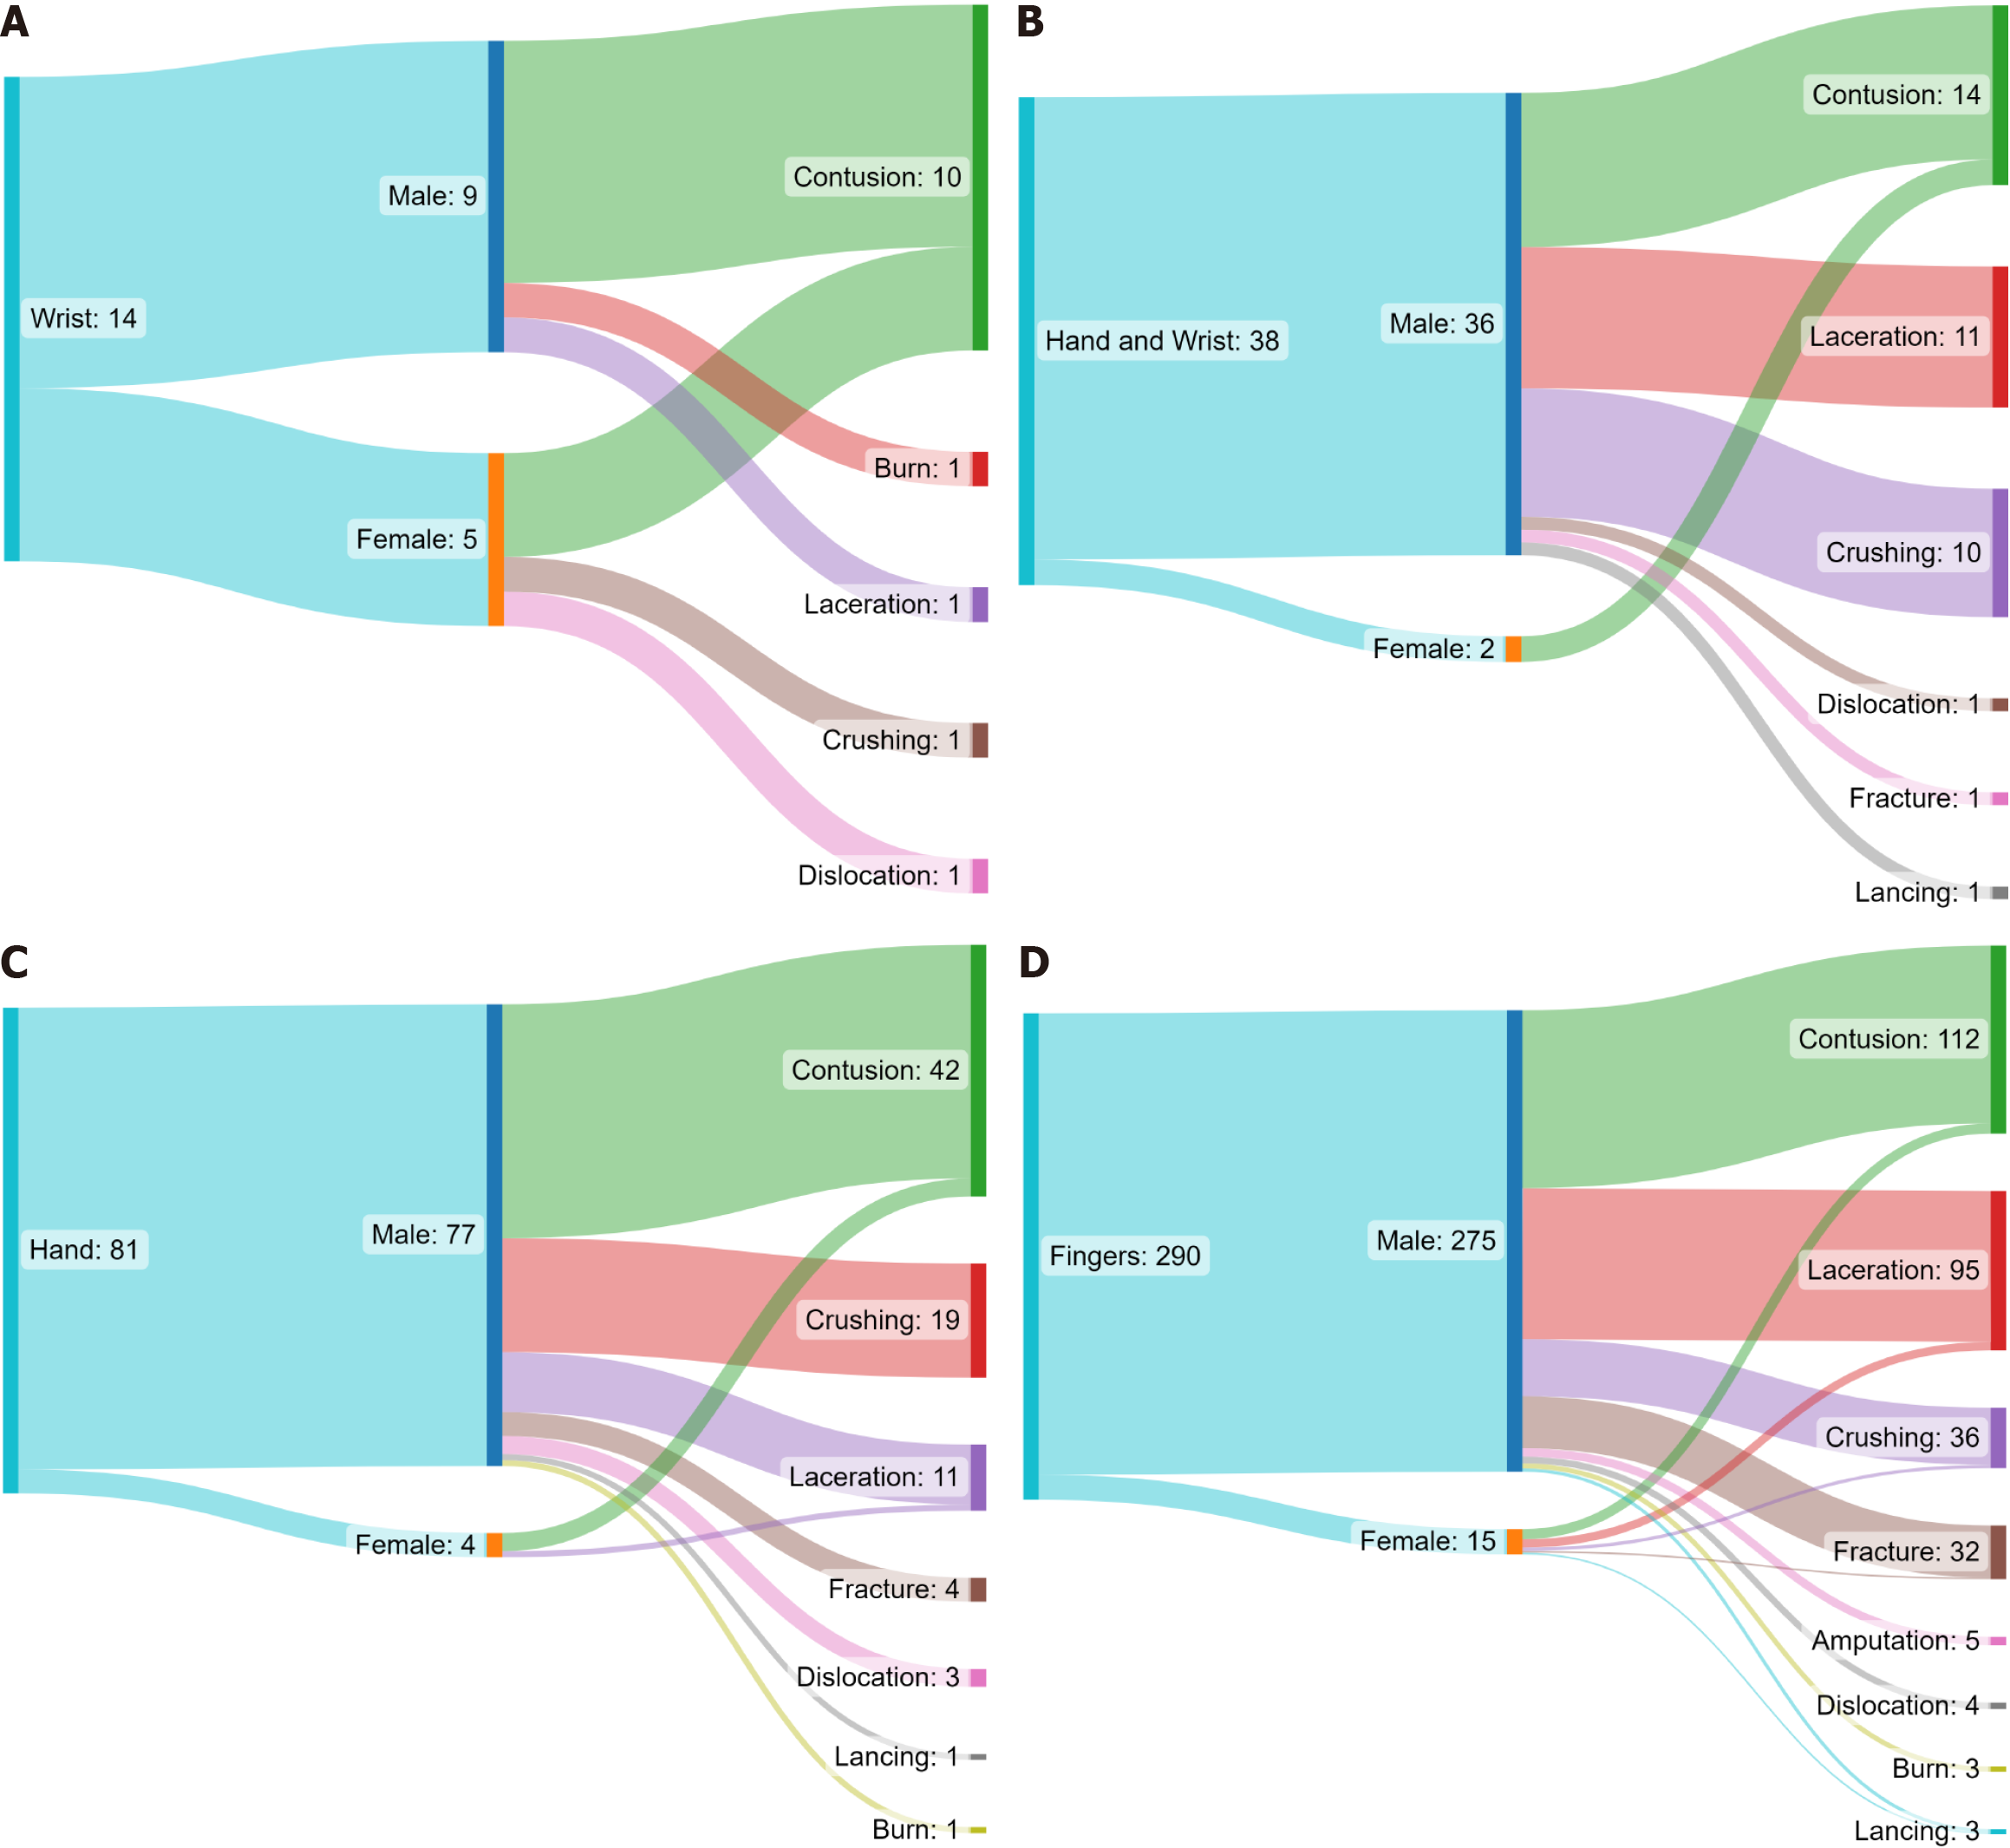
Figure 2 Sankey plot diagram shows the distribution (number of cases) of occupational hand and wrist injuries by sex and type of injury in the anatomical areas affected.
A: Wrist; B: Hand; C: Hand and wrist; D: Fingers.
Figure 3 Correspondence analysis between job and injured anatomical area variables when grouping by sex.
Men (upper panel); women (lower panel). The color scale corresponds to the value of the first component for the categories that compose the type of job and the anatomical area injured.
- Citation: Rodríguez AM, Tocanchón GP, Villalba JT, Pombo LM, Teherán AA, Camero-Ramos G, Ayala KP, Acero GM. Epidemiology of work-related hand and wrist injuries in a referral center: A descriptive study. World J Orthop 2024; 15(7): 650-659
- URL: https://www.wjgnet.com/2218-5836/full/v15/i7/650.htm
- DOI: https://dx.doi.org/10.5312/wjo.v15.i7.650


