Copyright
©The Author(s) 2024.
World J Orthop. Jun 18, 2024; 15(6): 593-601
Published online Jun 18, 2024. doi: 10.5312/wjo.v15.i6.593
Published online Jun 18, 2024. doi: 10.5312/wjo.v15.i6.593
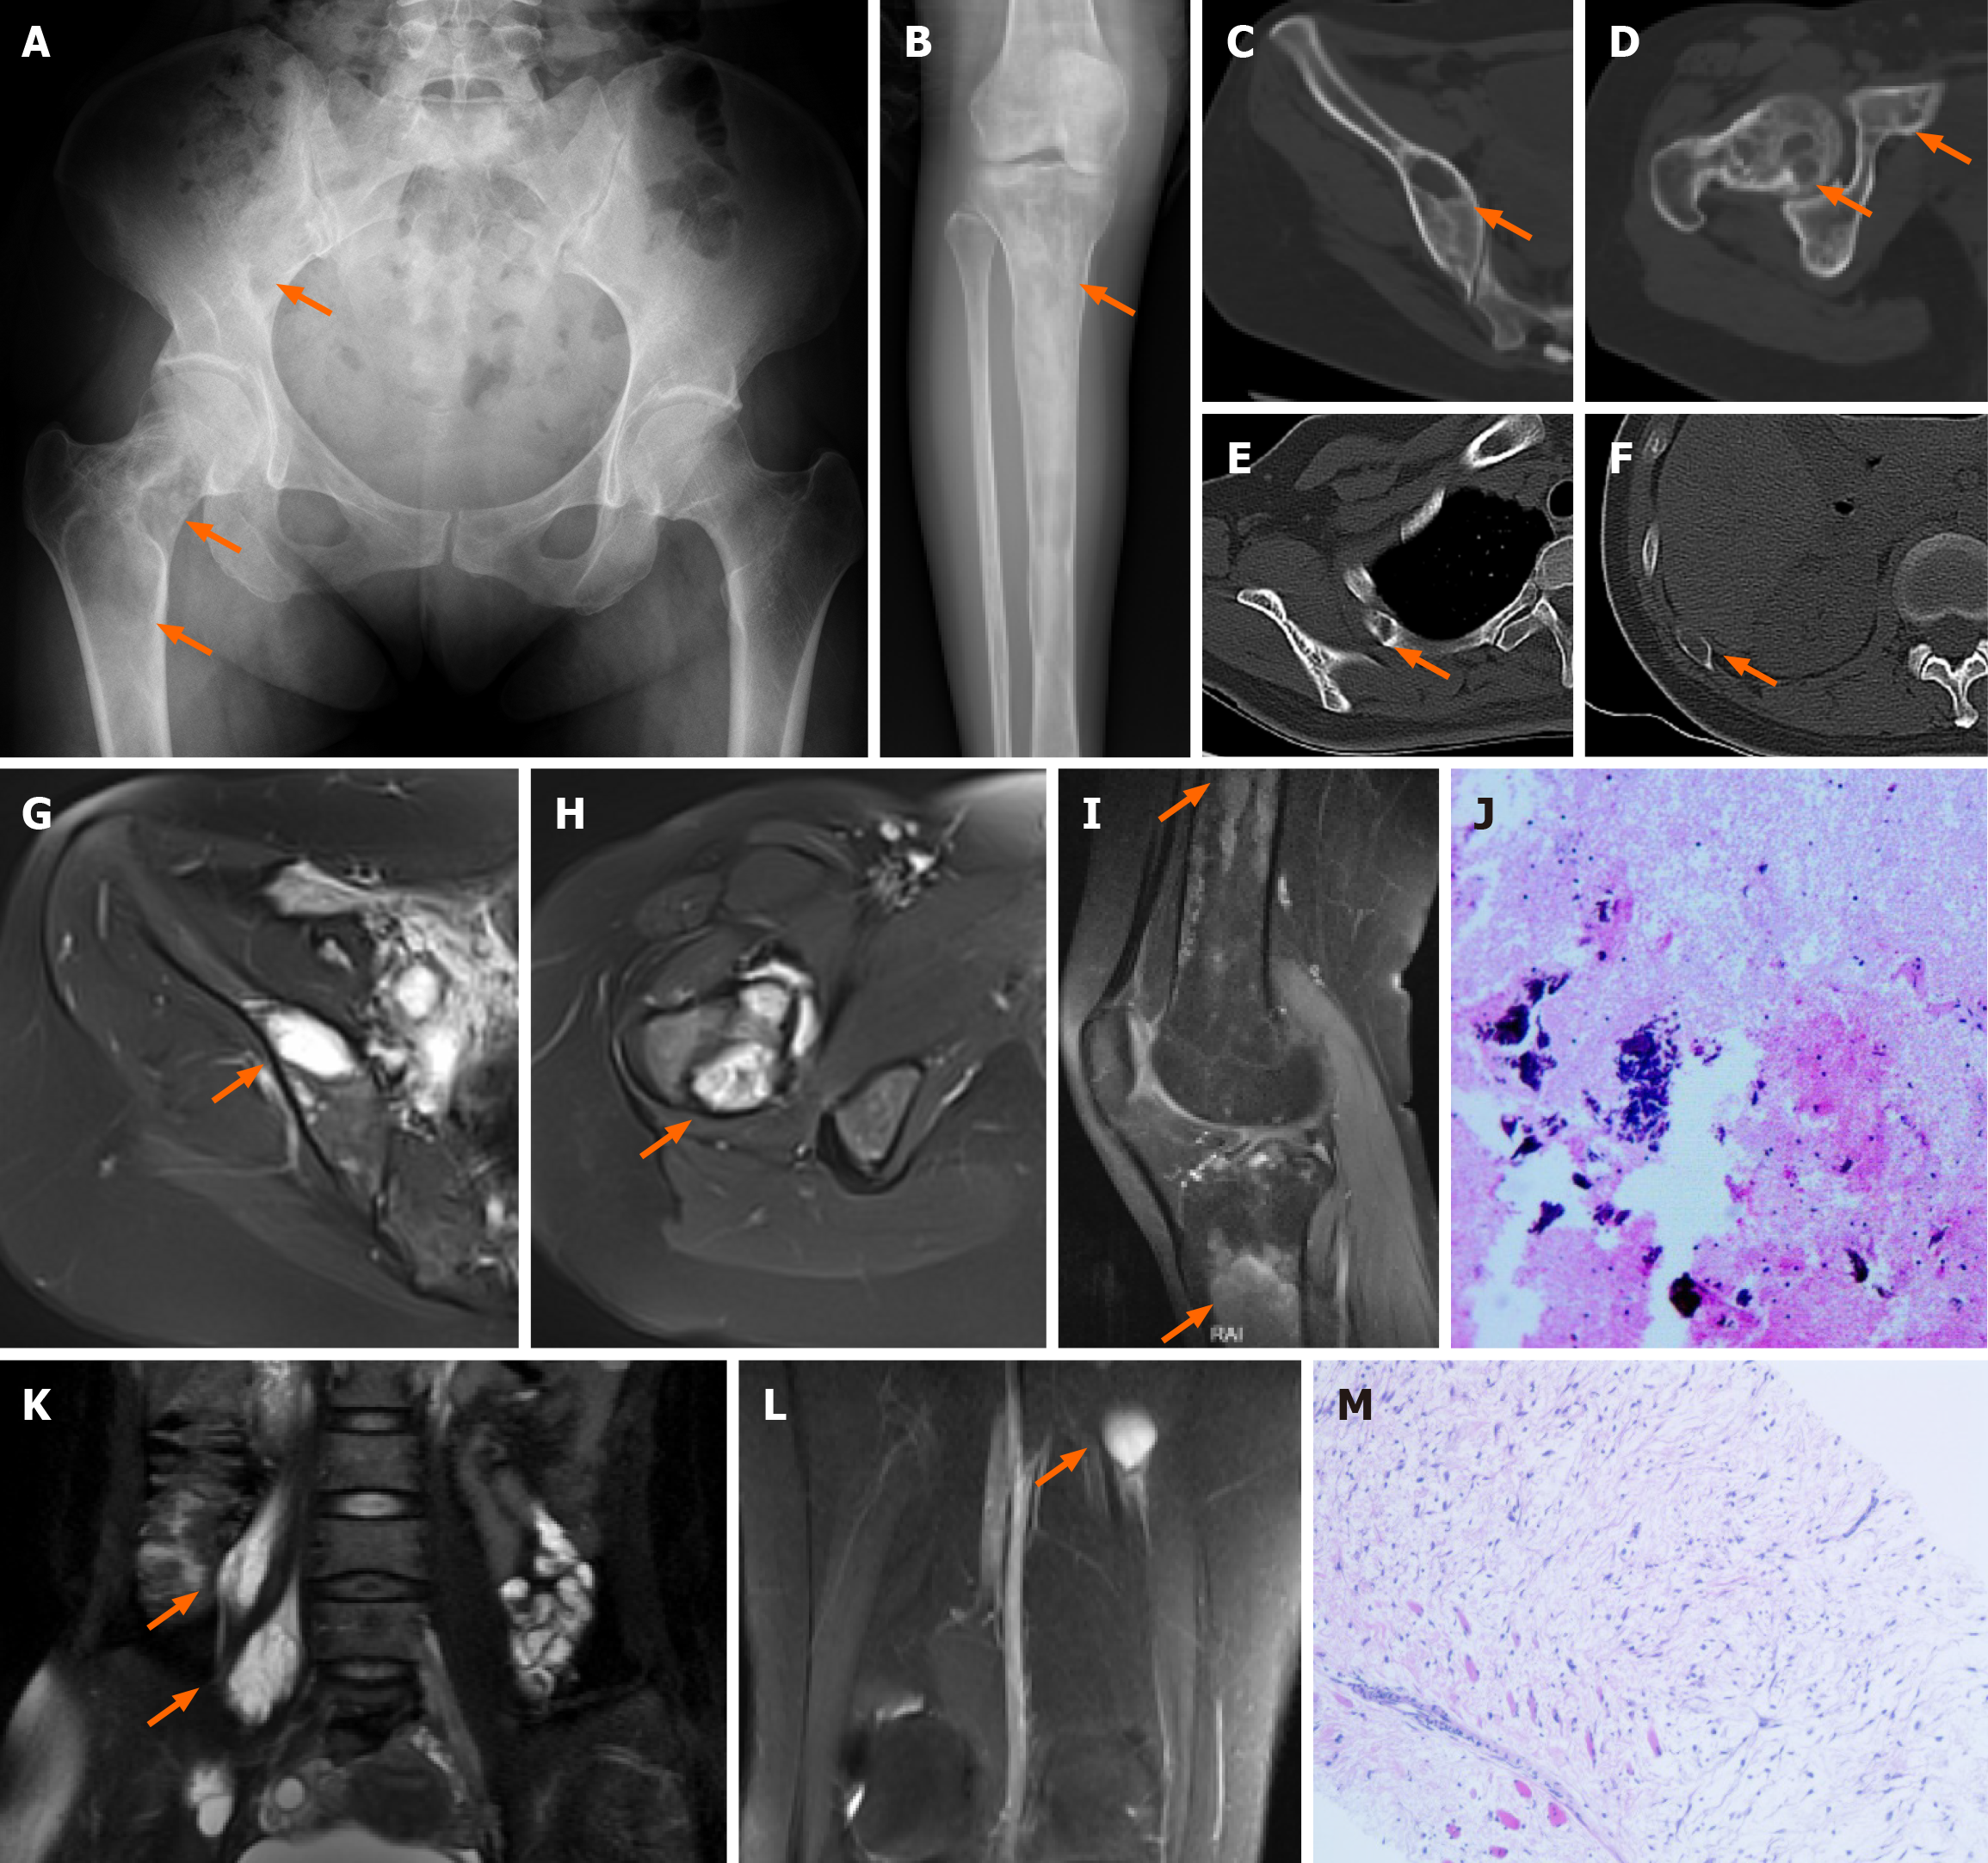
Figure 1 Representative images.
A-I: Representative X-ray (A and B), computed tomography images (C-F), and magnetic resonance (MR) images (G-I) showing bone lesions (orange arrows) in the pelvis, femur, tibia and ribs; J-M: Hematoxylin-eosin (HE) staining results of preoperative puncture biopsy sample from the femoral lesion (J). Representative MR images of intramuscular lesions (orange arrows) in the right psoas major muscle (K) and the right vastus medialis muscle (L), and HE staining result of a puncture biopsy specimen from the myxoma in the psoas major muscle (M).
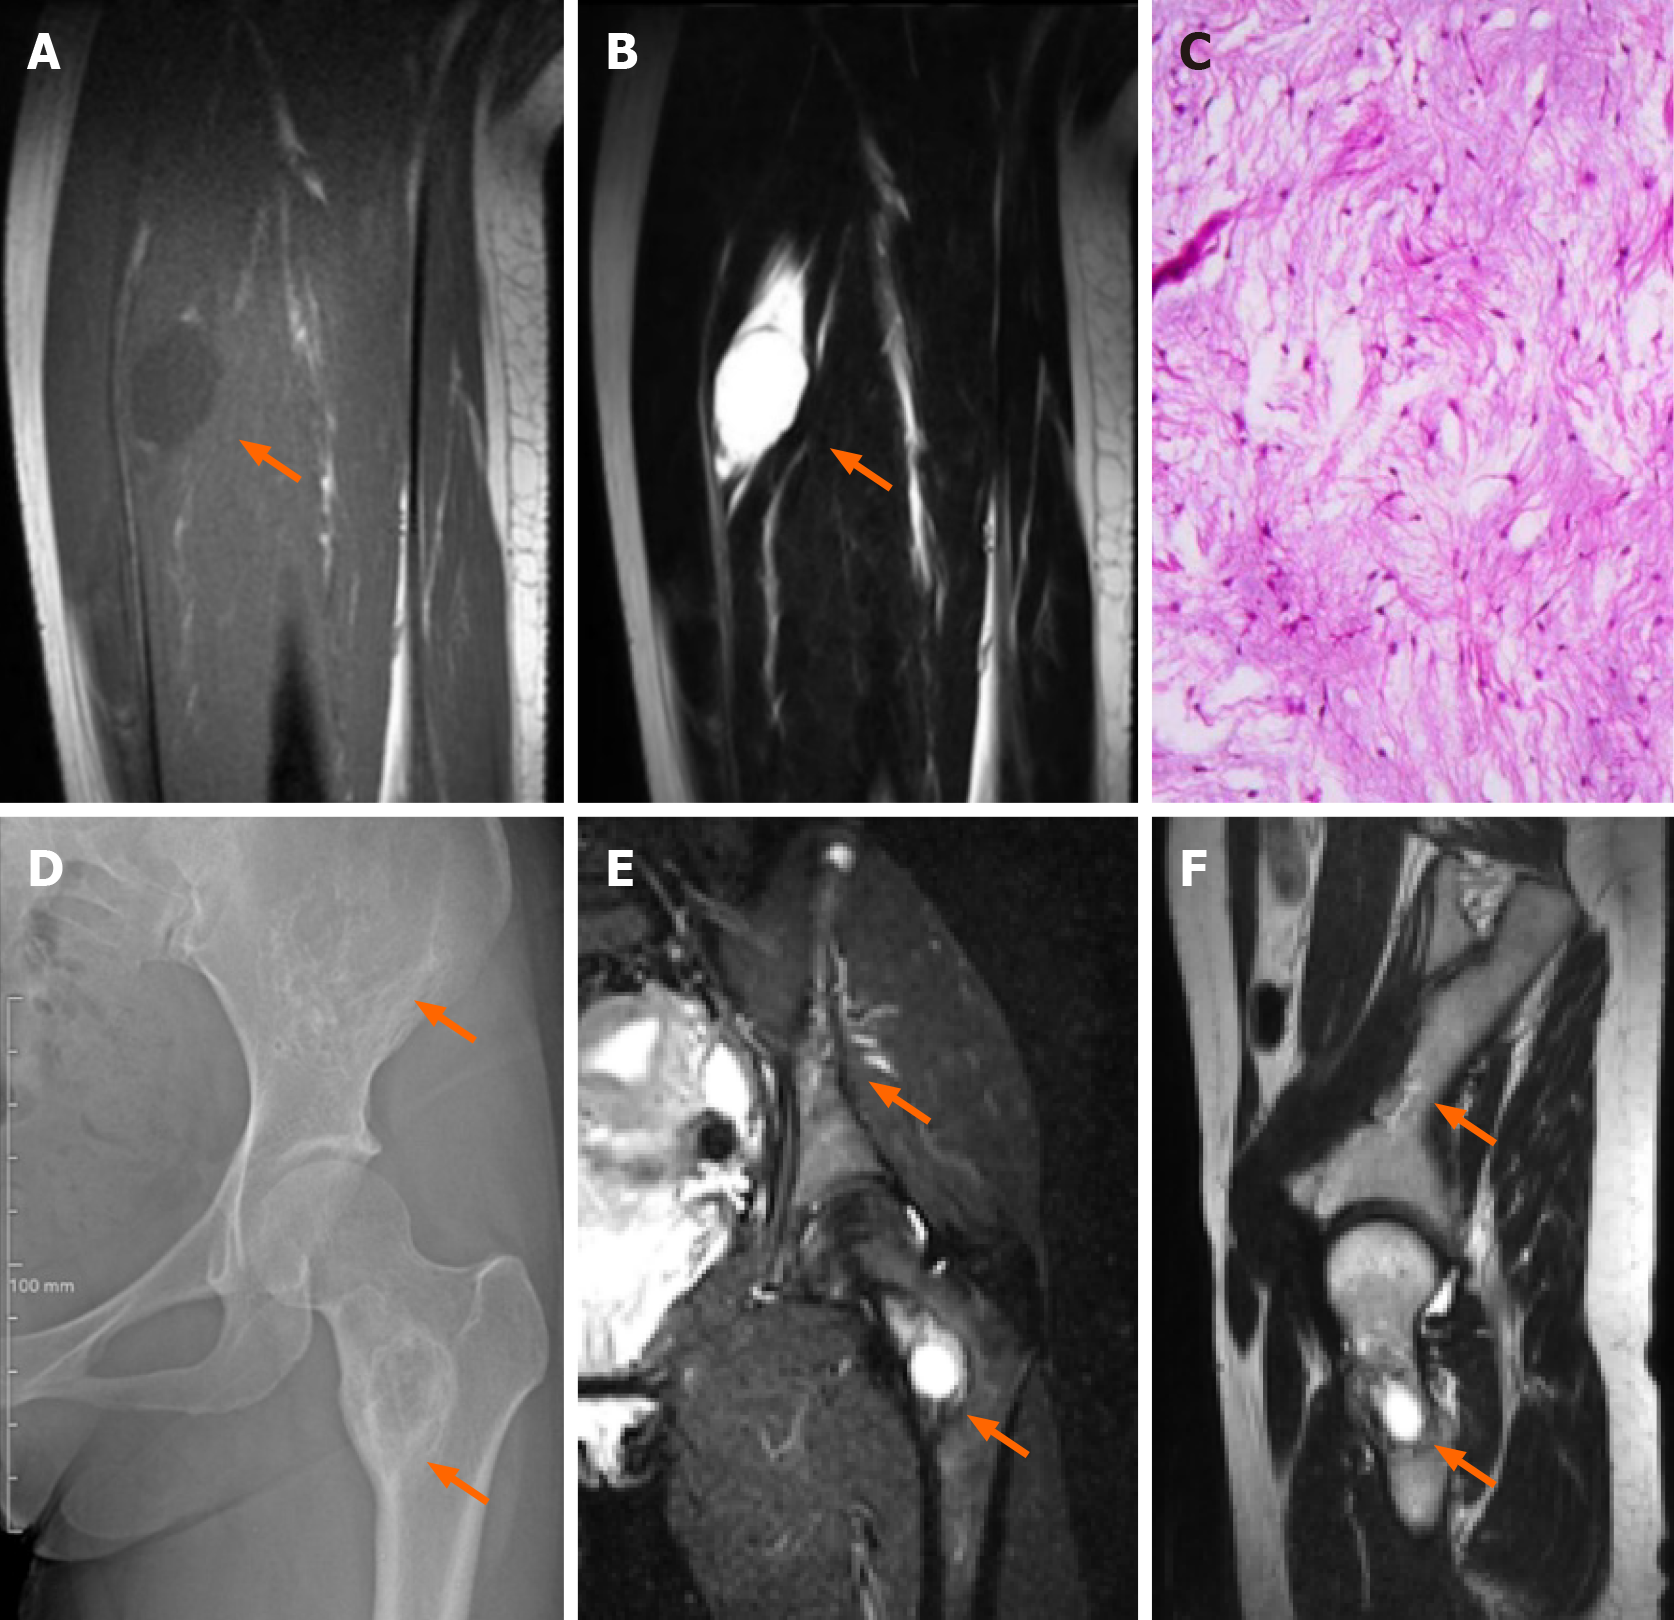
Figure 2 Representative images.
A-C: Representative T1WI (A) and T2WI (B) of MR images, and hematoxylin-eosin staining (C) of the intramuscular lesion (orange arrows) in vastus intermedius muscle; D-F: Representative X-ray (D), T2WI (E) and T1WI images (F) showing bone lesions (orange arrows) in the pelvis and femur.
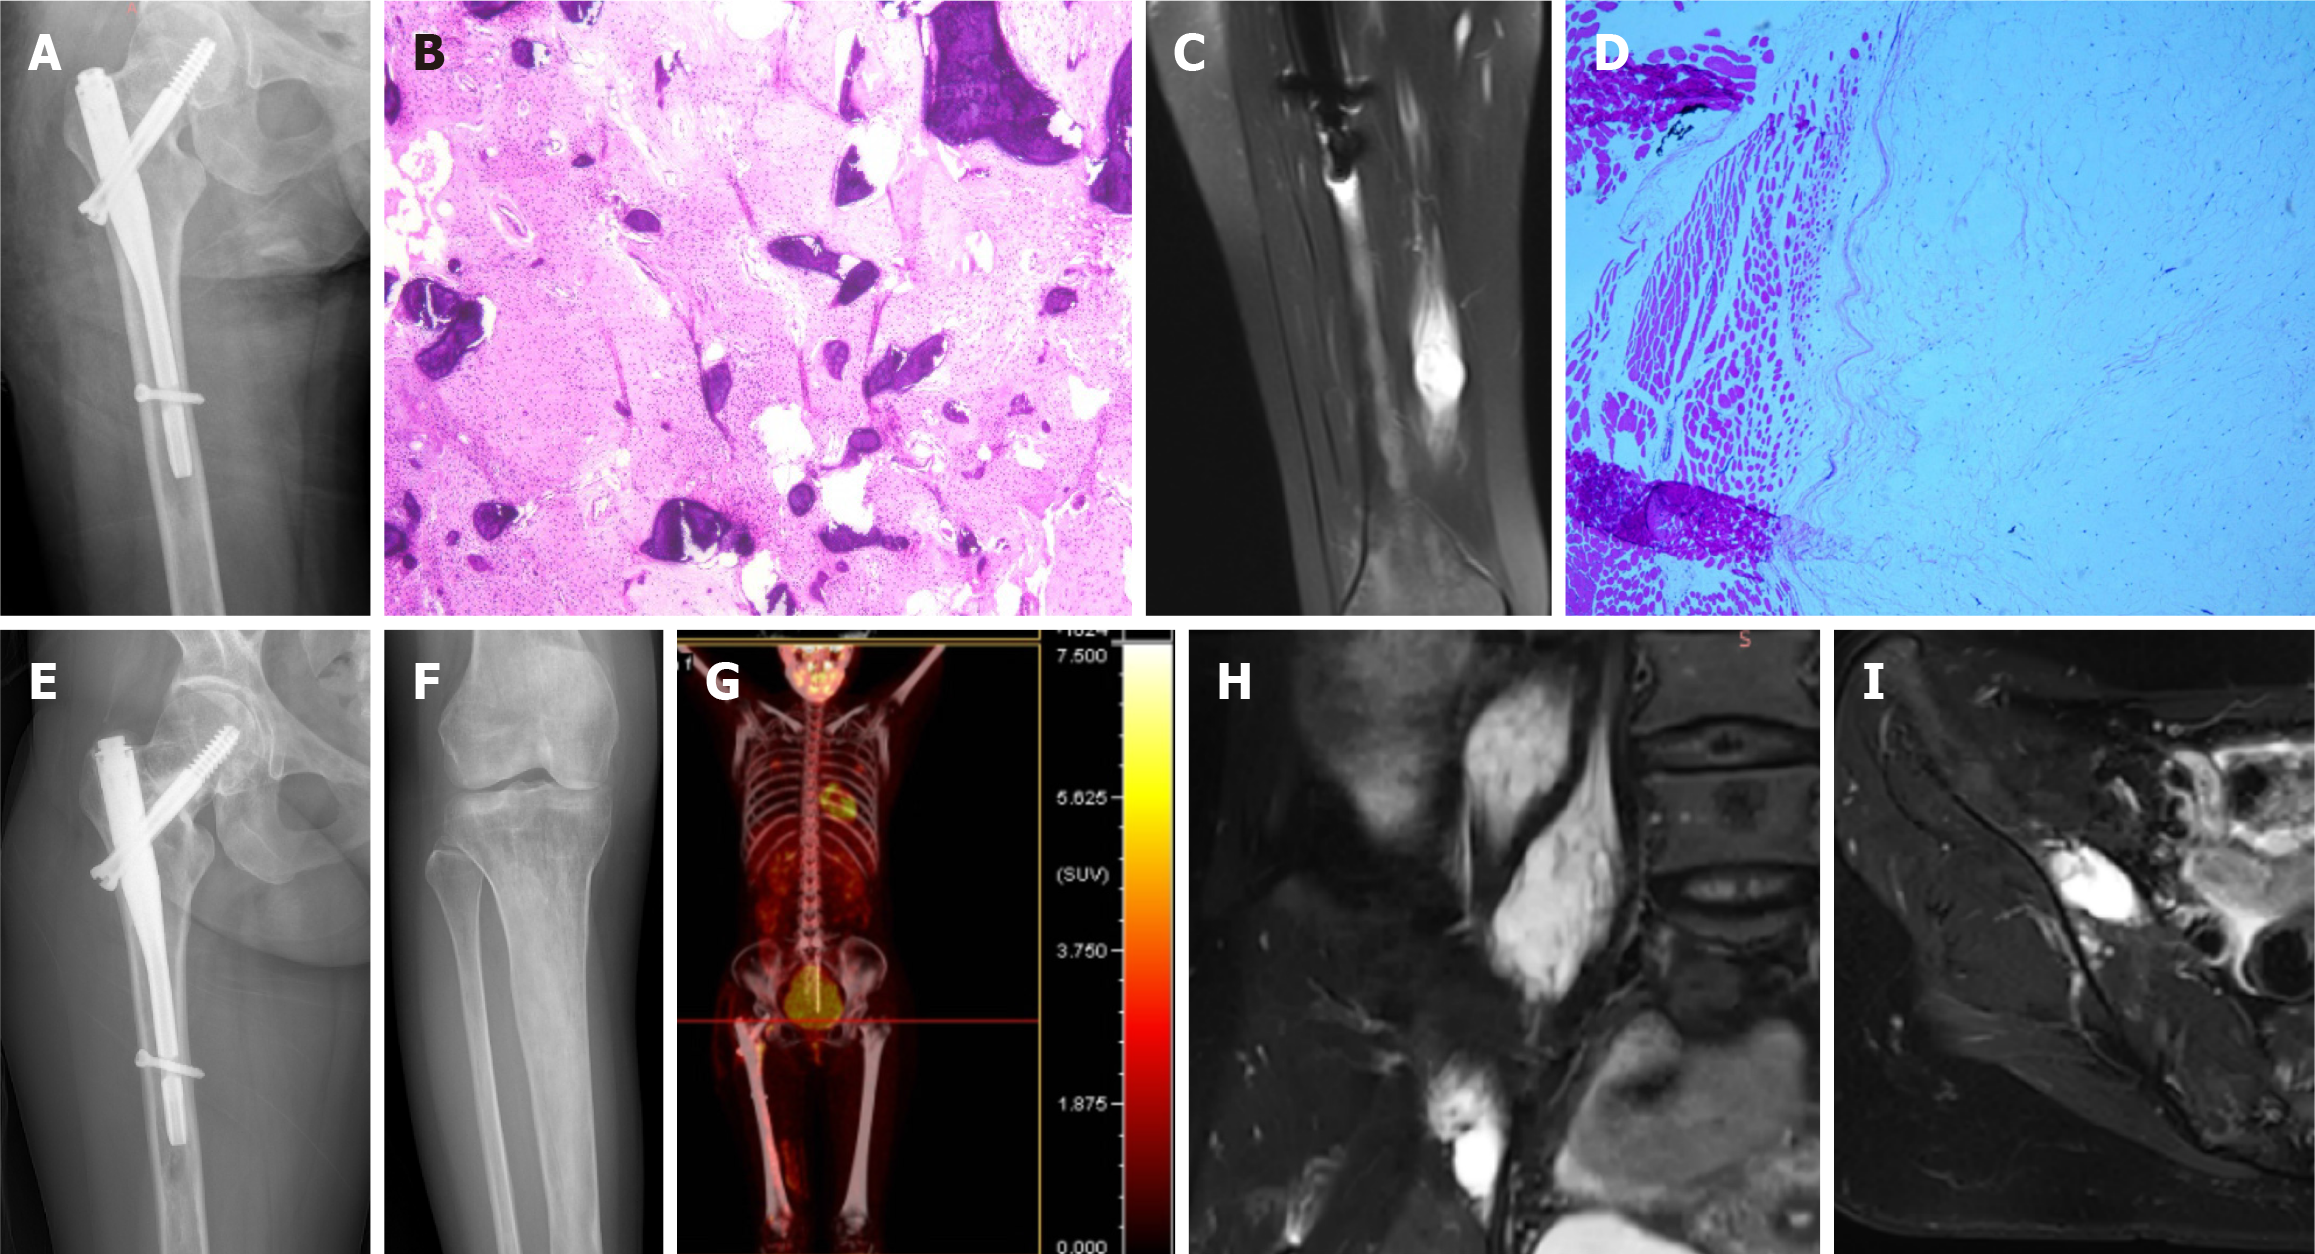
Figure 3 Representative images.
A and B: X-ray image (A) of the right femur after internal fixation, and representative hematoxylin-eosin (HE) staining (B) of postoperative specimen from the femoral fibrous dysplasia; C and D: Representative magnetic resonance (MR) image (C) and HE staining (D) of the intramuscular myxoma in right vastus medialis; E-I: Results of 1-year follow-up of femur X-ray, iliopsoas myxoma and iliac crest fibrous dysplasia. Representative images of femur (E) and tibia (F) X-ray, positron emission tomography-CT (G), iliopsoas myxoma MR (H), and iliac fibrous dysplasia MR (I) at 1-year follow-up.
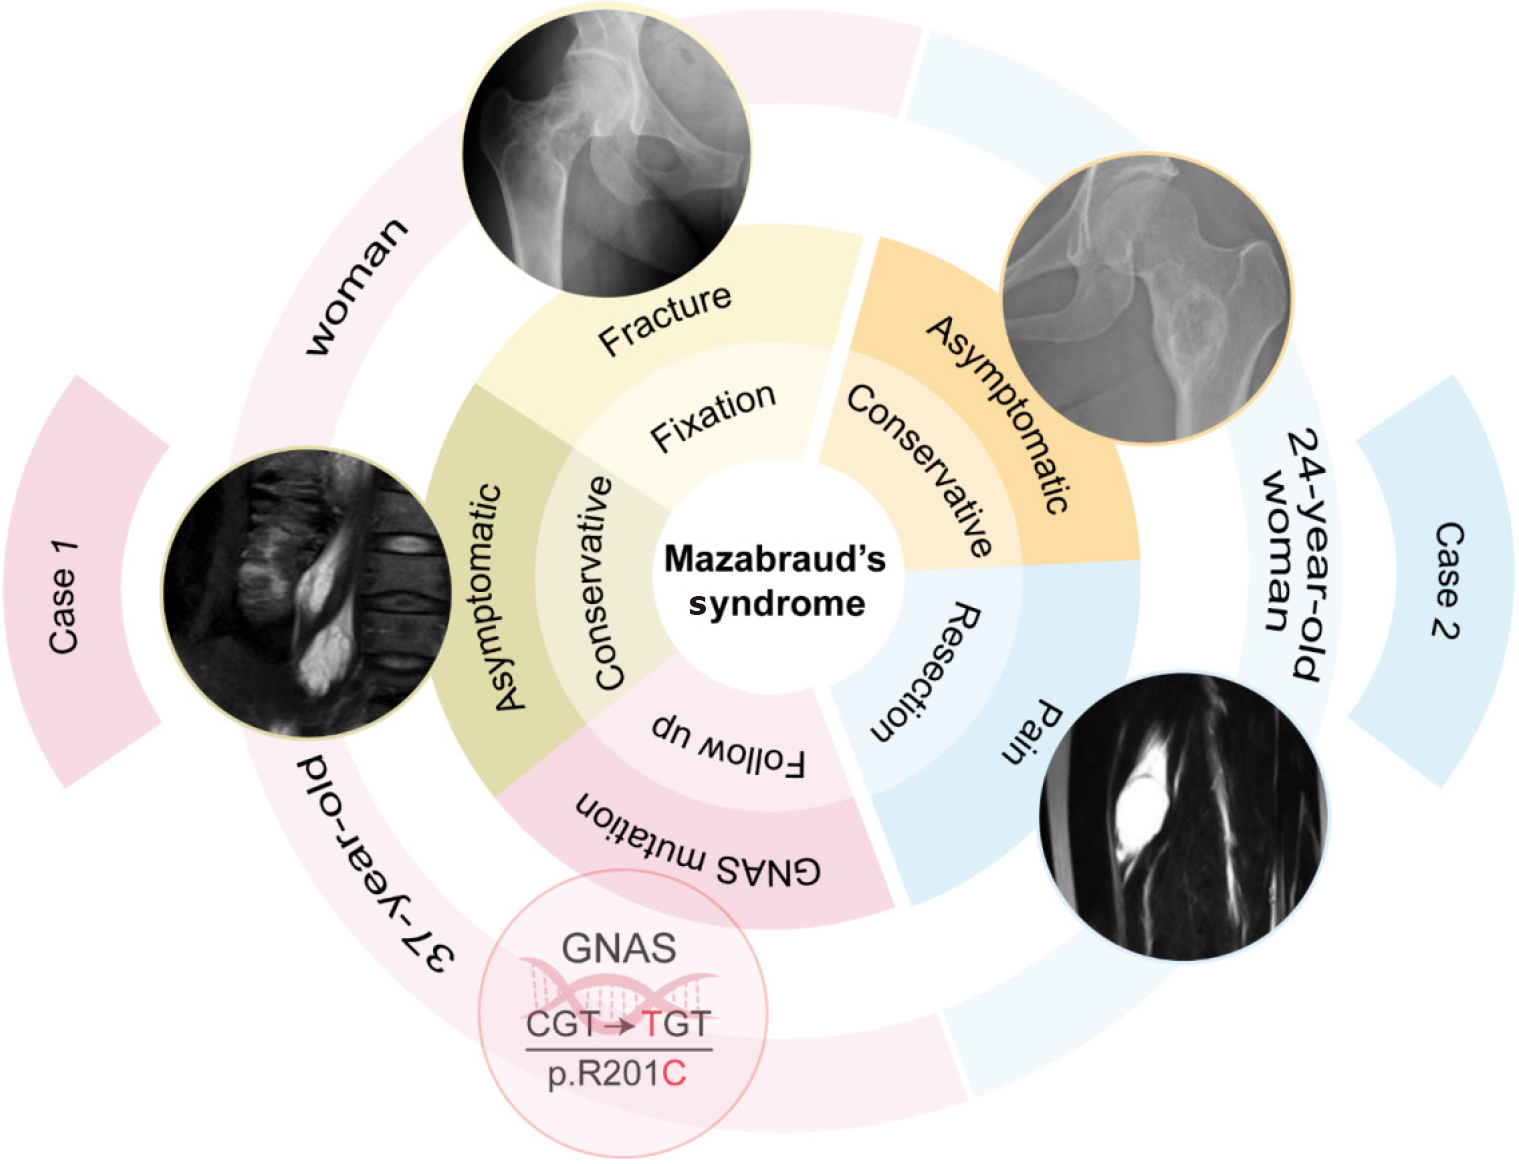
Figure 4
Schematic diagram of the summary on these two cases of Mazabraud’s syndrome.
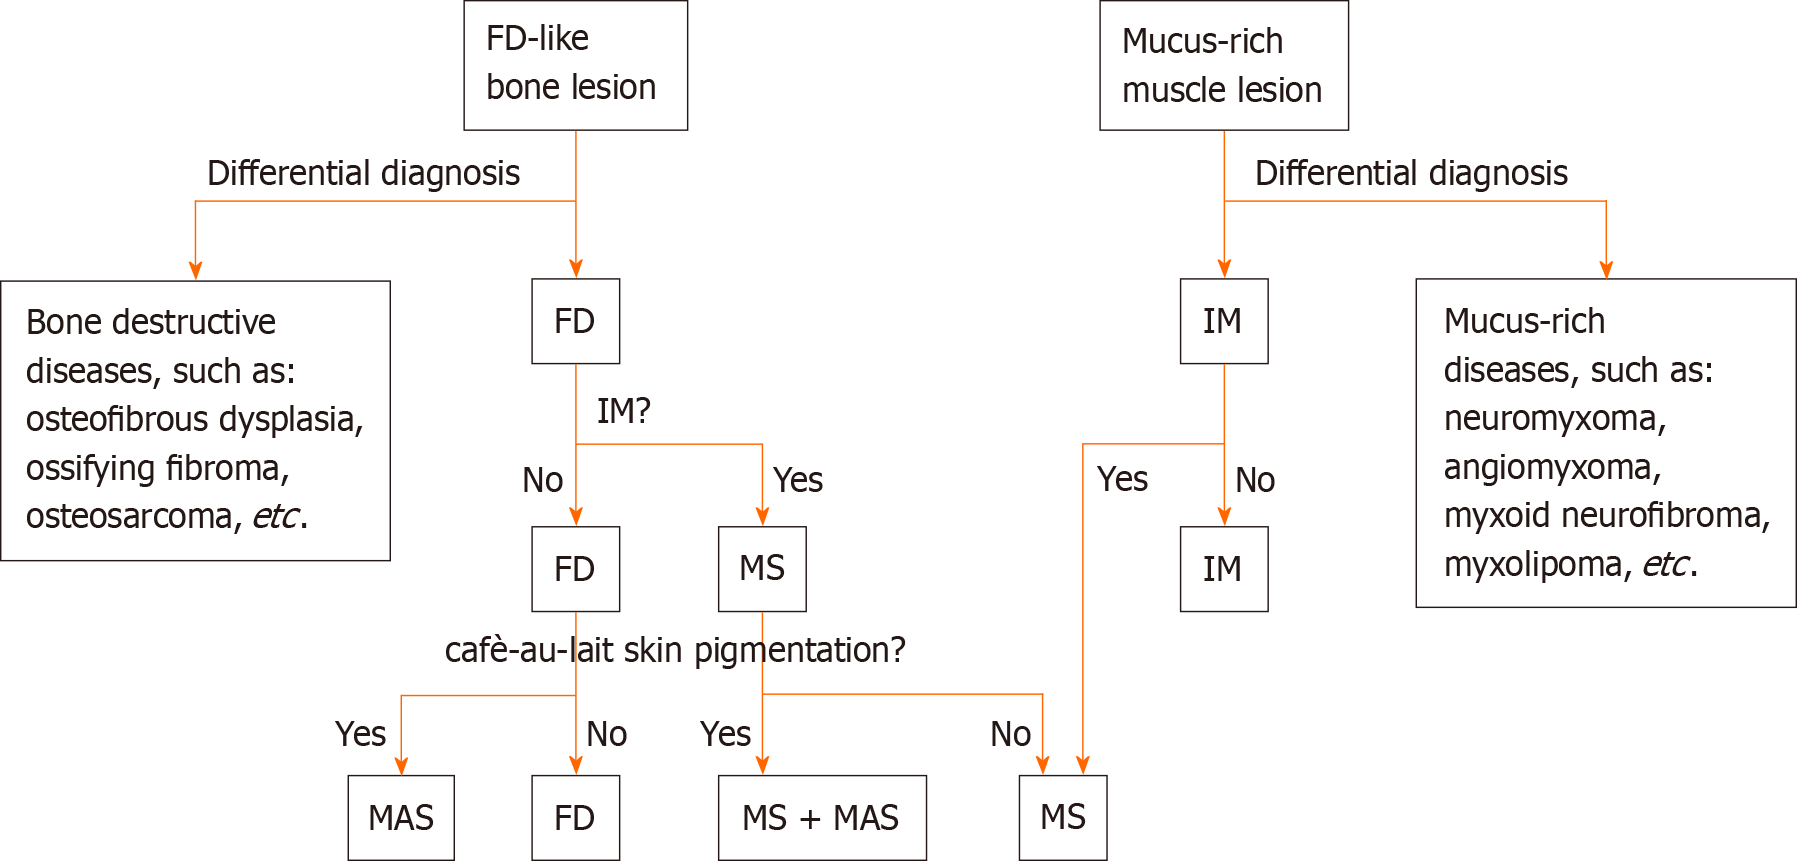
Figure 5 Schematic diagram of the differential diagnoses for Mazabraud’s syndrome.
FD: Fibrous dysplasia; IM: Intramuscular myxoma; MAS: McCune-Albright syndrome; MS: Mazabraud’s syndrome.
- Citation: Li XM, Chen ZH, Wang KY, Chen JN, Yao ZN, Yao YH, Zhou XW, Lin N. Mazabraud’s syndrome in female patients: Two case reports. World J Orthop 2024; 15(6): 593-601
- URL: https://www.wjgnet.com/2218-5836/full/v15/i6/593.htm
- DOI: https://dx.doi.org/10.5312/wjo.v15.i6.593


