Copyright
©The Author(s) 2024.
World J Orthop. Mar 18, 2024; 15(3): 293-301
Published online Mar 18, 2024. doi: 10.5312/wjo.v15.i3.293
Published online Mar 18, 2024. doi: 10.5312/wjo.v15.i3.293
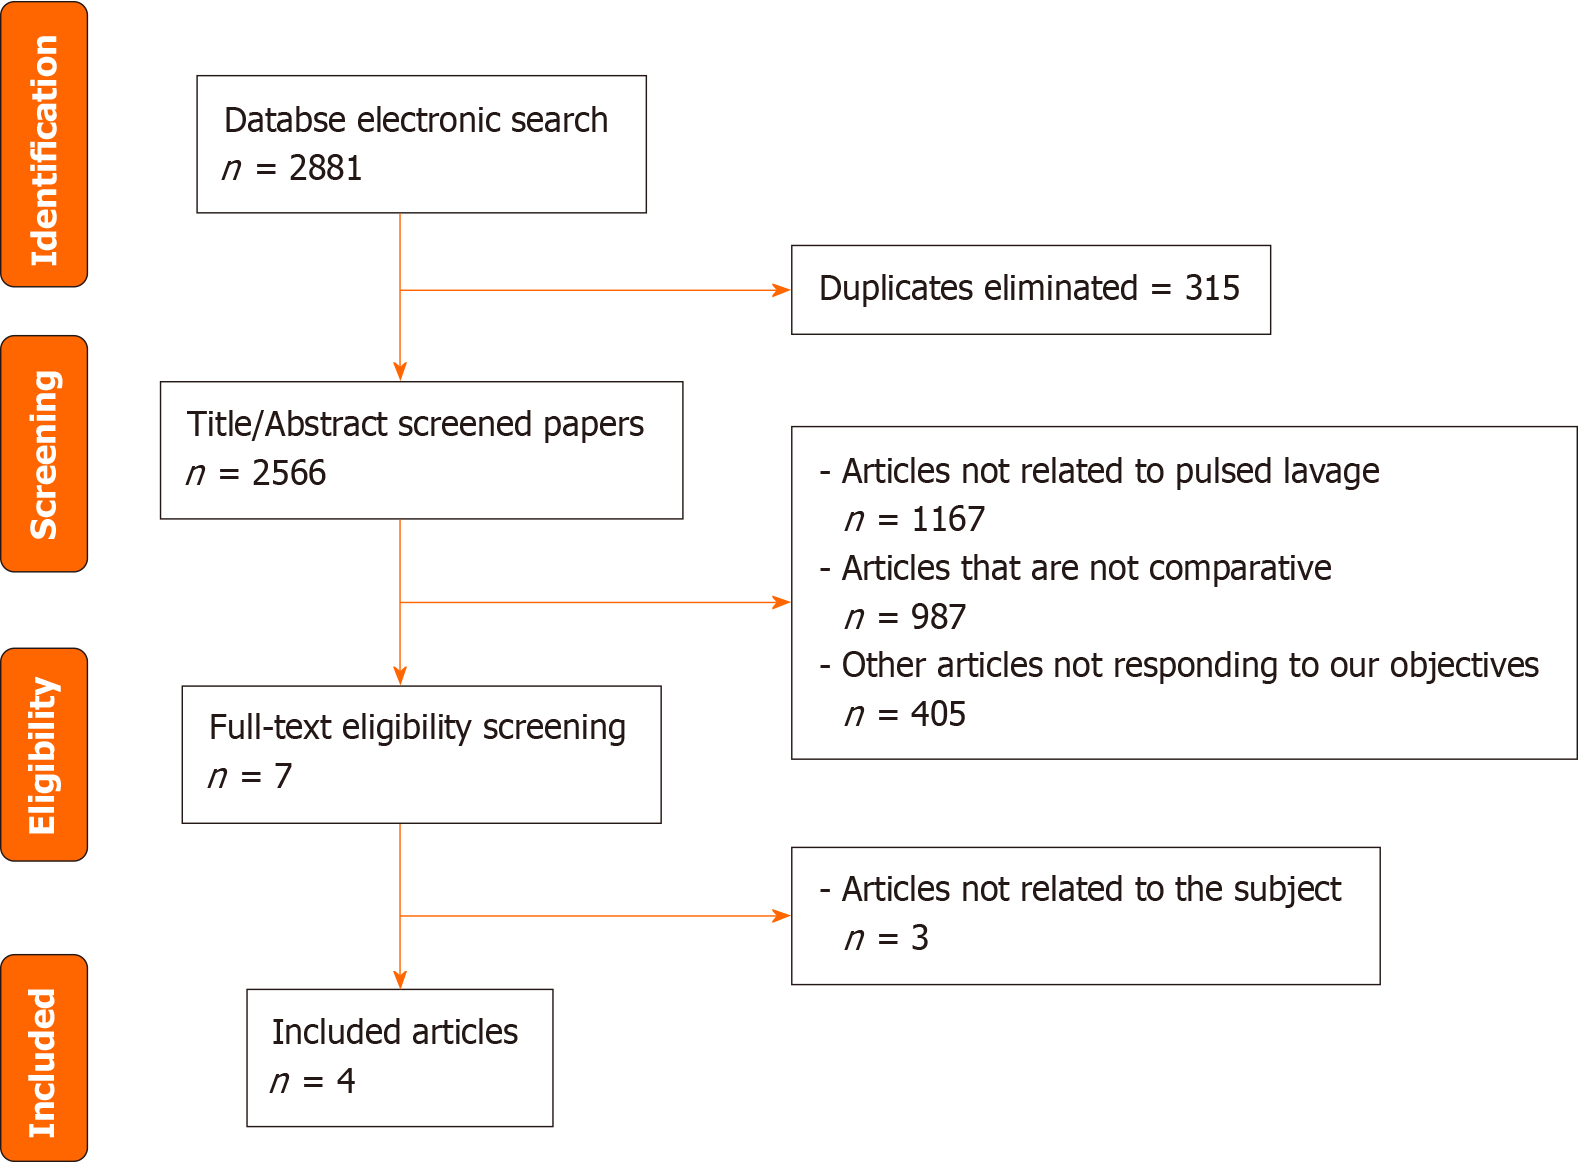
Figure 1 PRISMA flowchart for article selection process.
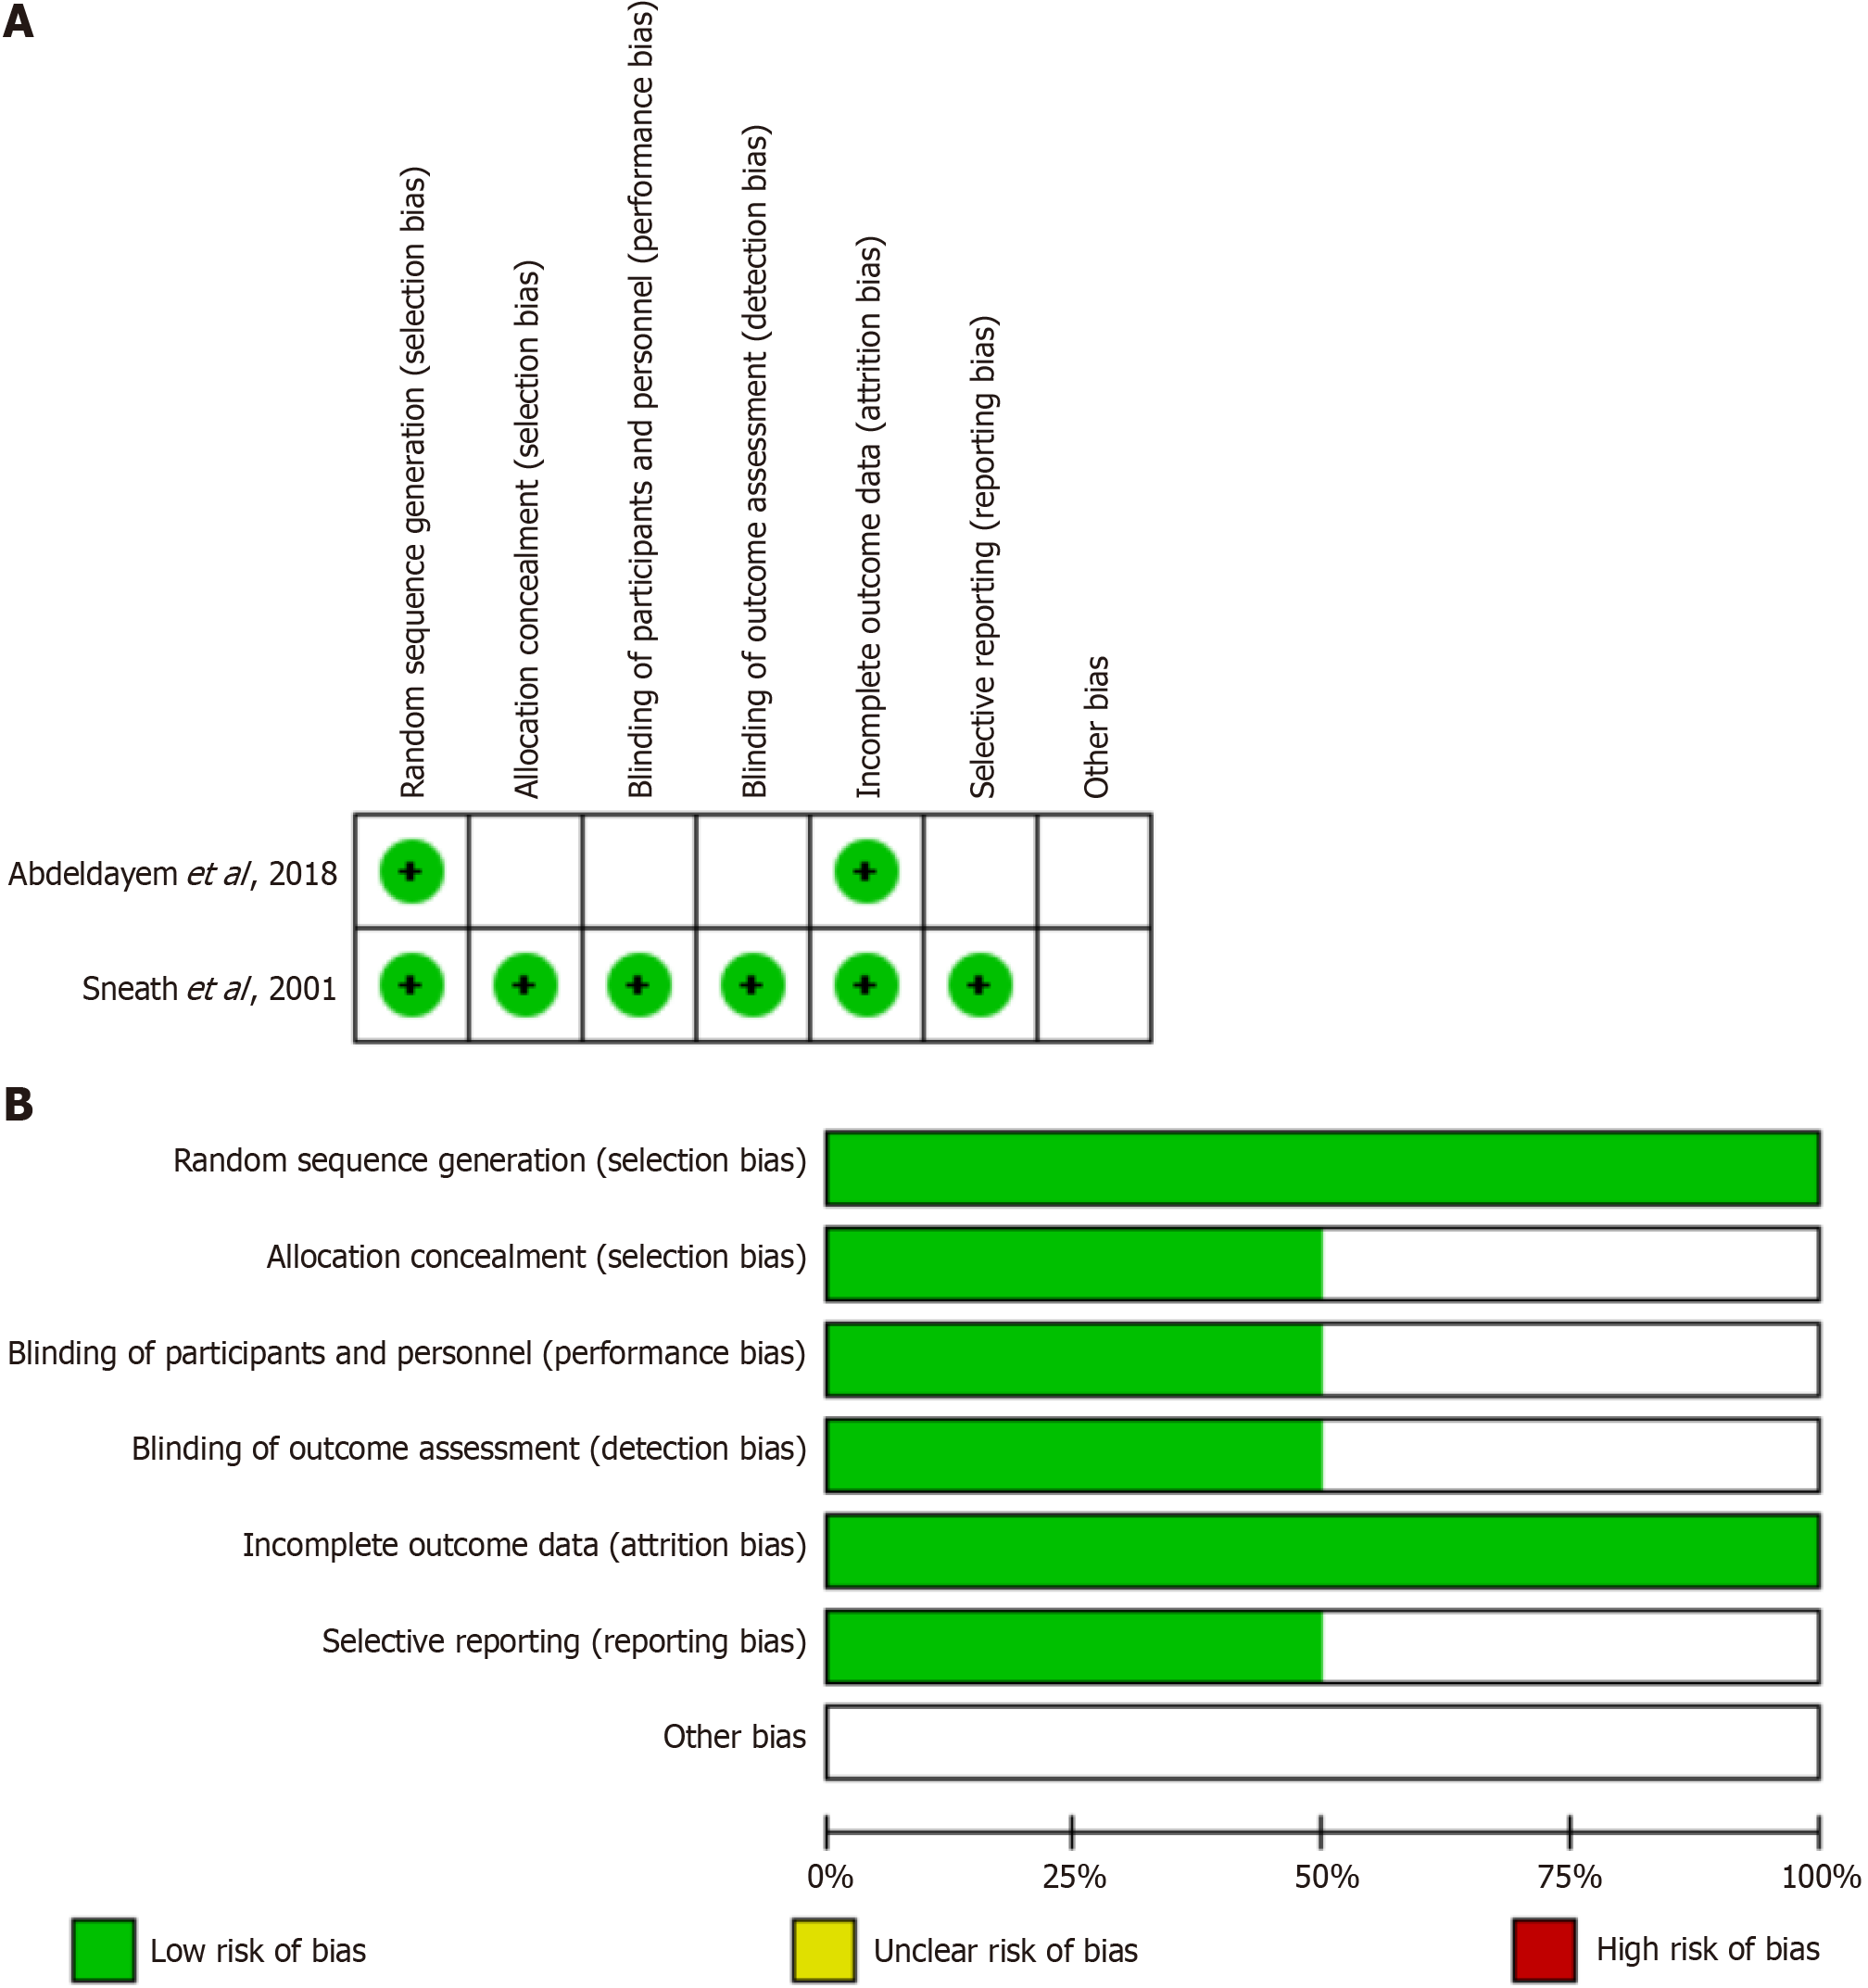
Figure 2 Risk of bias.
A: Risk of bias summary: review authors' judgements about each risk of bias item for each included study; B: Risk of bias summary: review authors' judgements about each risk of bias item for each included study.
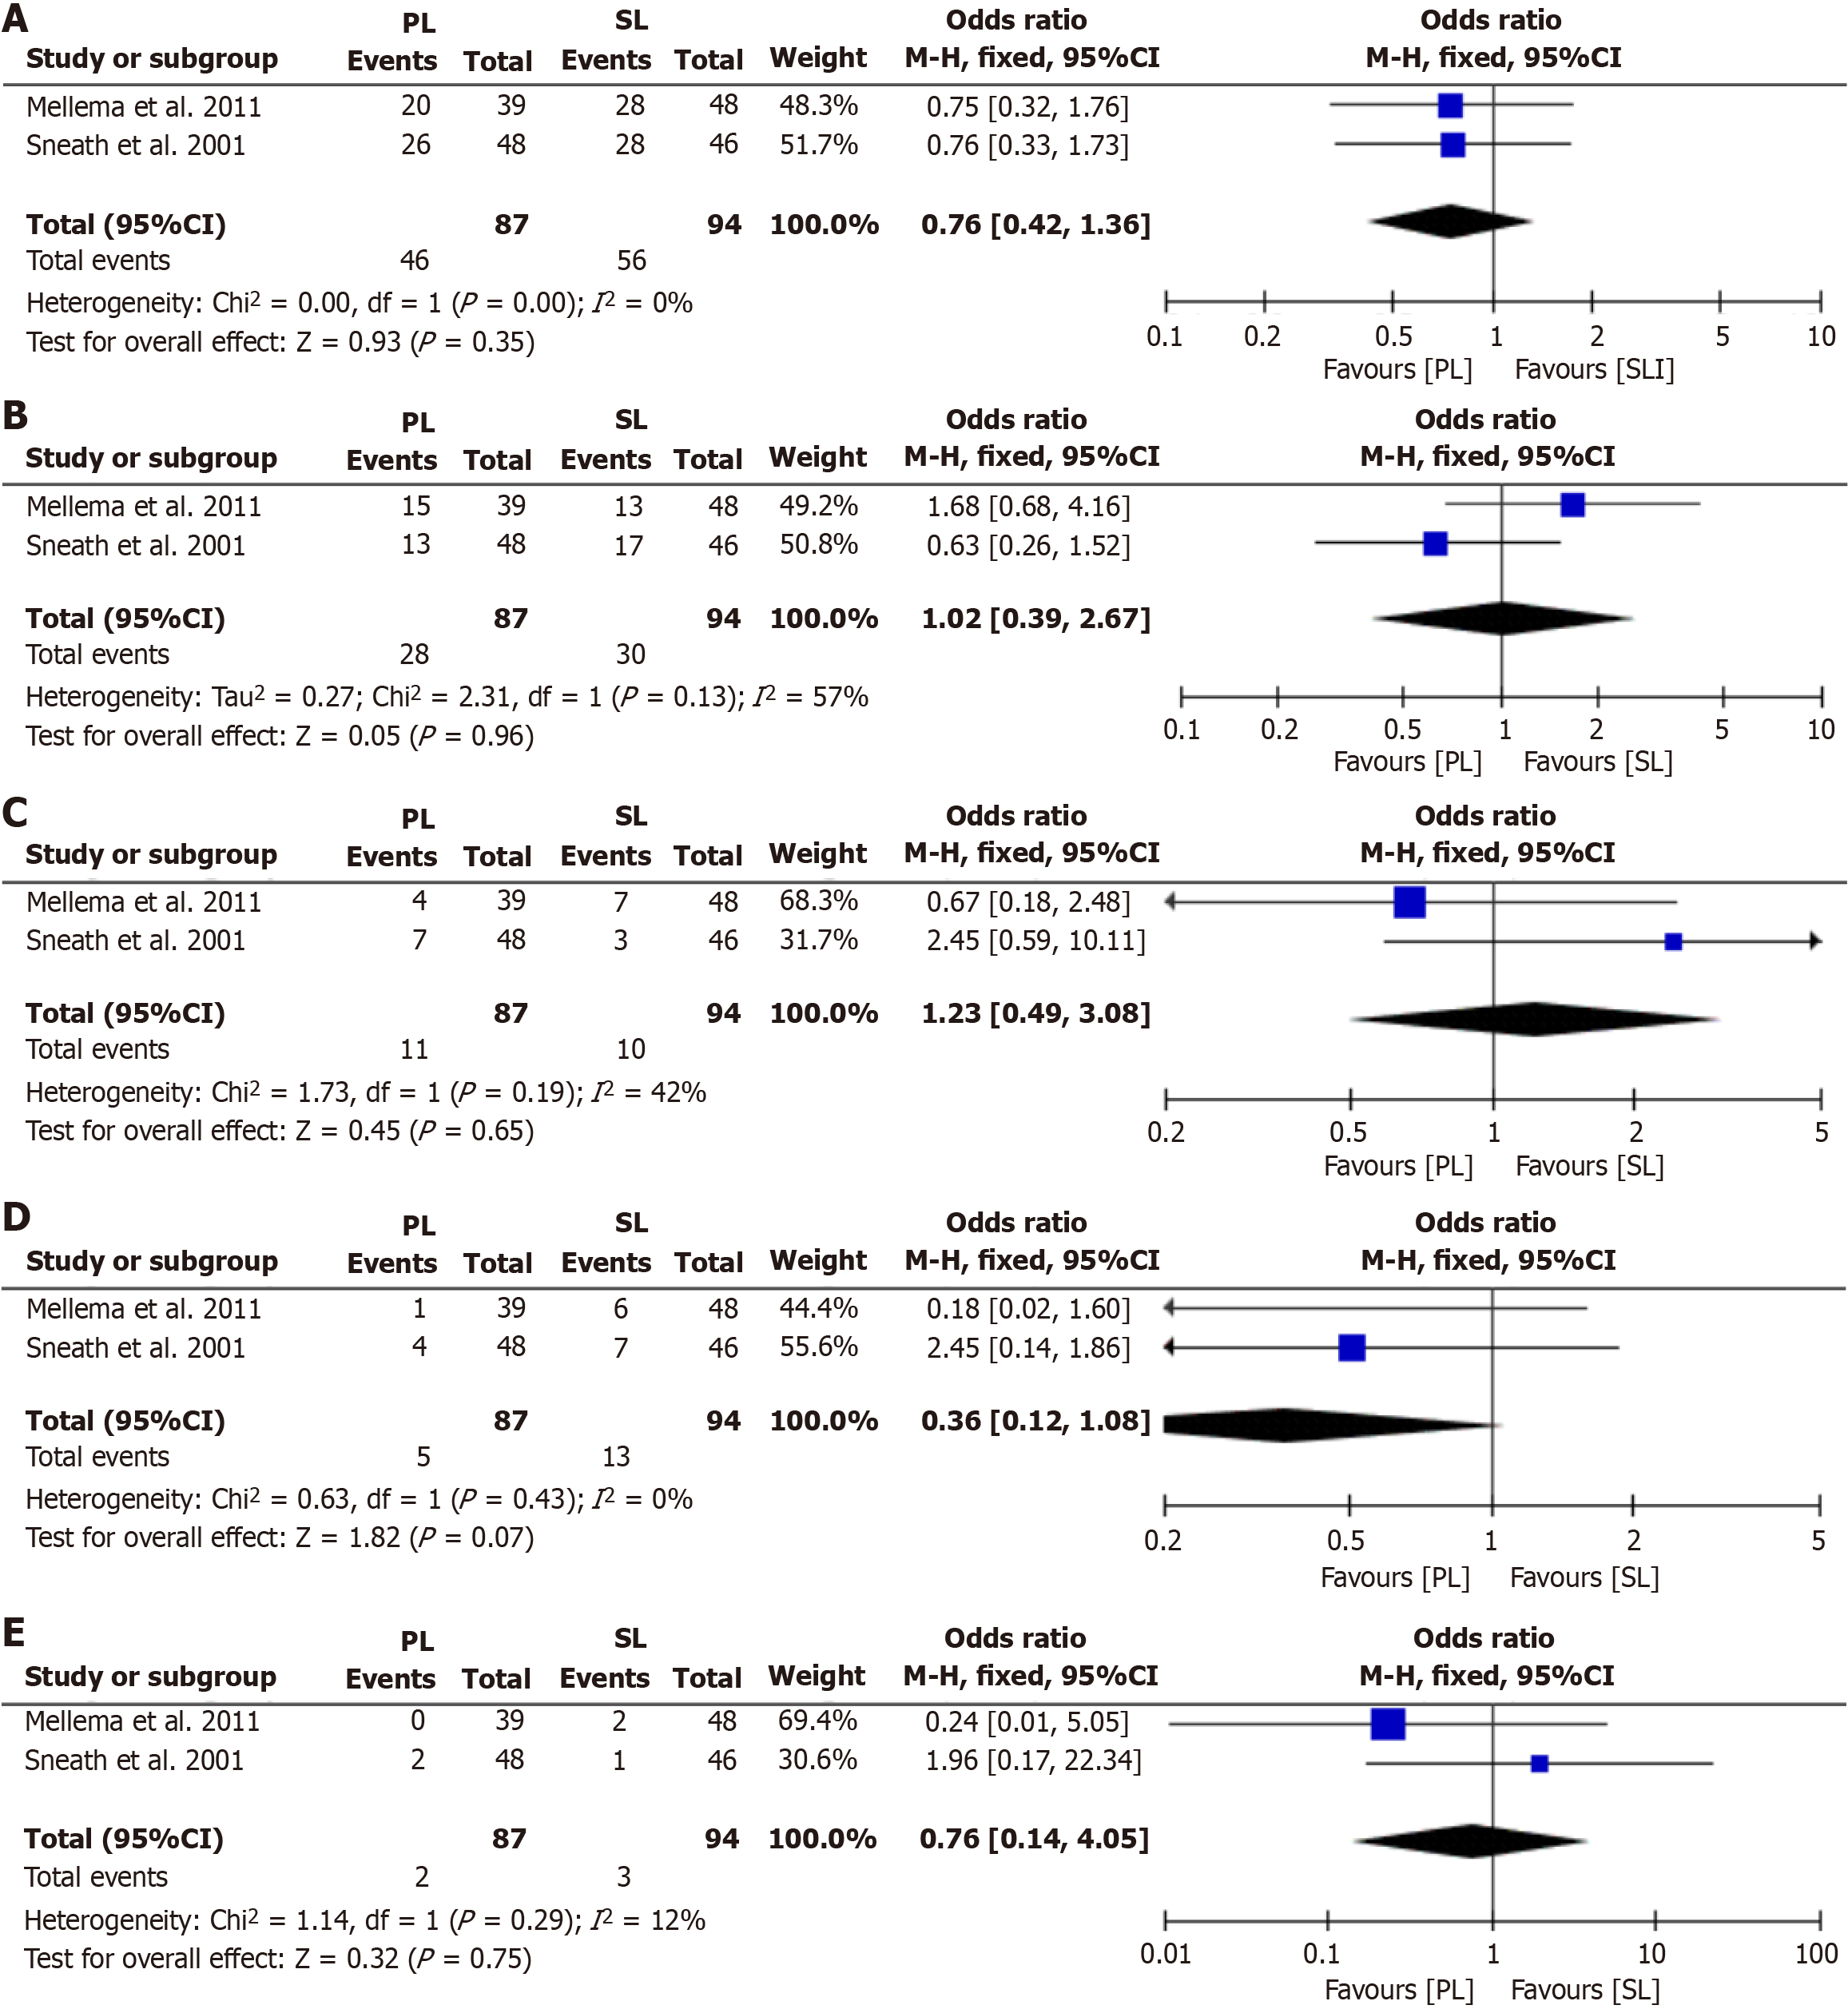
Figure 3 Forest plot.
A: Forest plot showing the overall heterotopic ossification (HO) formation in pulsed lavage (PL) and standard lavage (SL); B: Forest plot showing the Brooker grade 1 HO formation in PL and SL; C: Forest plot showing the Brooker grade 2 HO formation in PL and SL; D: Forest plot showing the Brooker grade 3 HO formation in PL and SL; E: Forest plot showing the Brooker grade 4 HO formation in PL and SL.
Figure 4 Forest plot showing the formation of radiolucent lines in pulsed lavage and standard lavage.
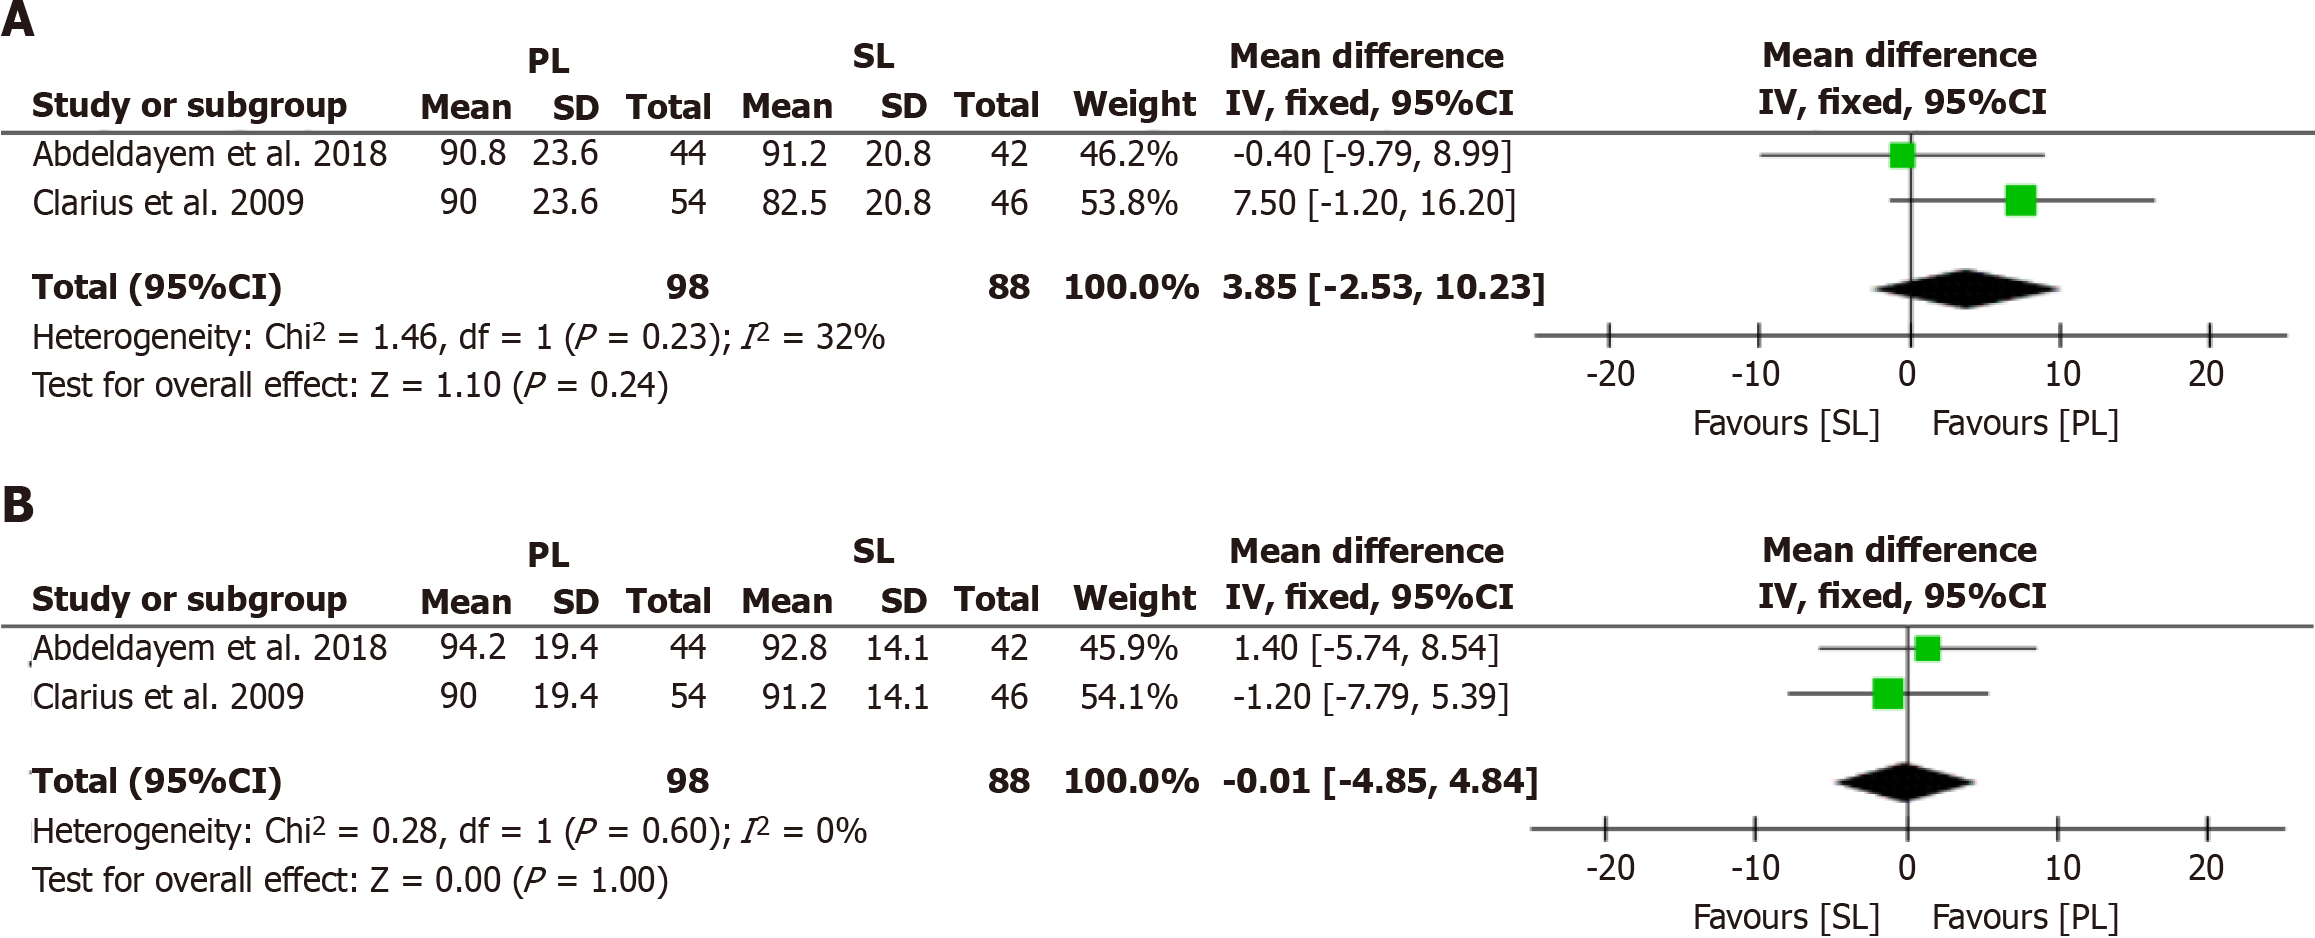
Figure 5 Forest plot.
A: Forest plot showing the knee society score in pulsed lavage (PL) and standard lavage (SL); B: Forest plot showing the knee function score in PL and SL.
- Citation: Daher M, Haykal G, Aoun M, Moussallem M, Ghoul A, Tarchichi J, Sebaaly A. Pulsed lavage in joint arthroplasty: A systematic review and meta-analysis. World J Orthop 2024; 15(3): 293-301
- URL: https://www.wjgnet.com/2218-5836/full/v15/i3/293.htm
- DOI: https://dx.doi.org/10.5312/wjo.v15.i3.293


