Copyright
©The Author(s) 2024.
World J Orthop. Feb 18, 2024; 15(2): 180-191
Published online Feb 18, 2024. doi: 10.5312/wjo.v15.i2.180
Published online Feb 18, 2024. doi: 10.5312/wjo.v15.i2.180
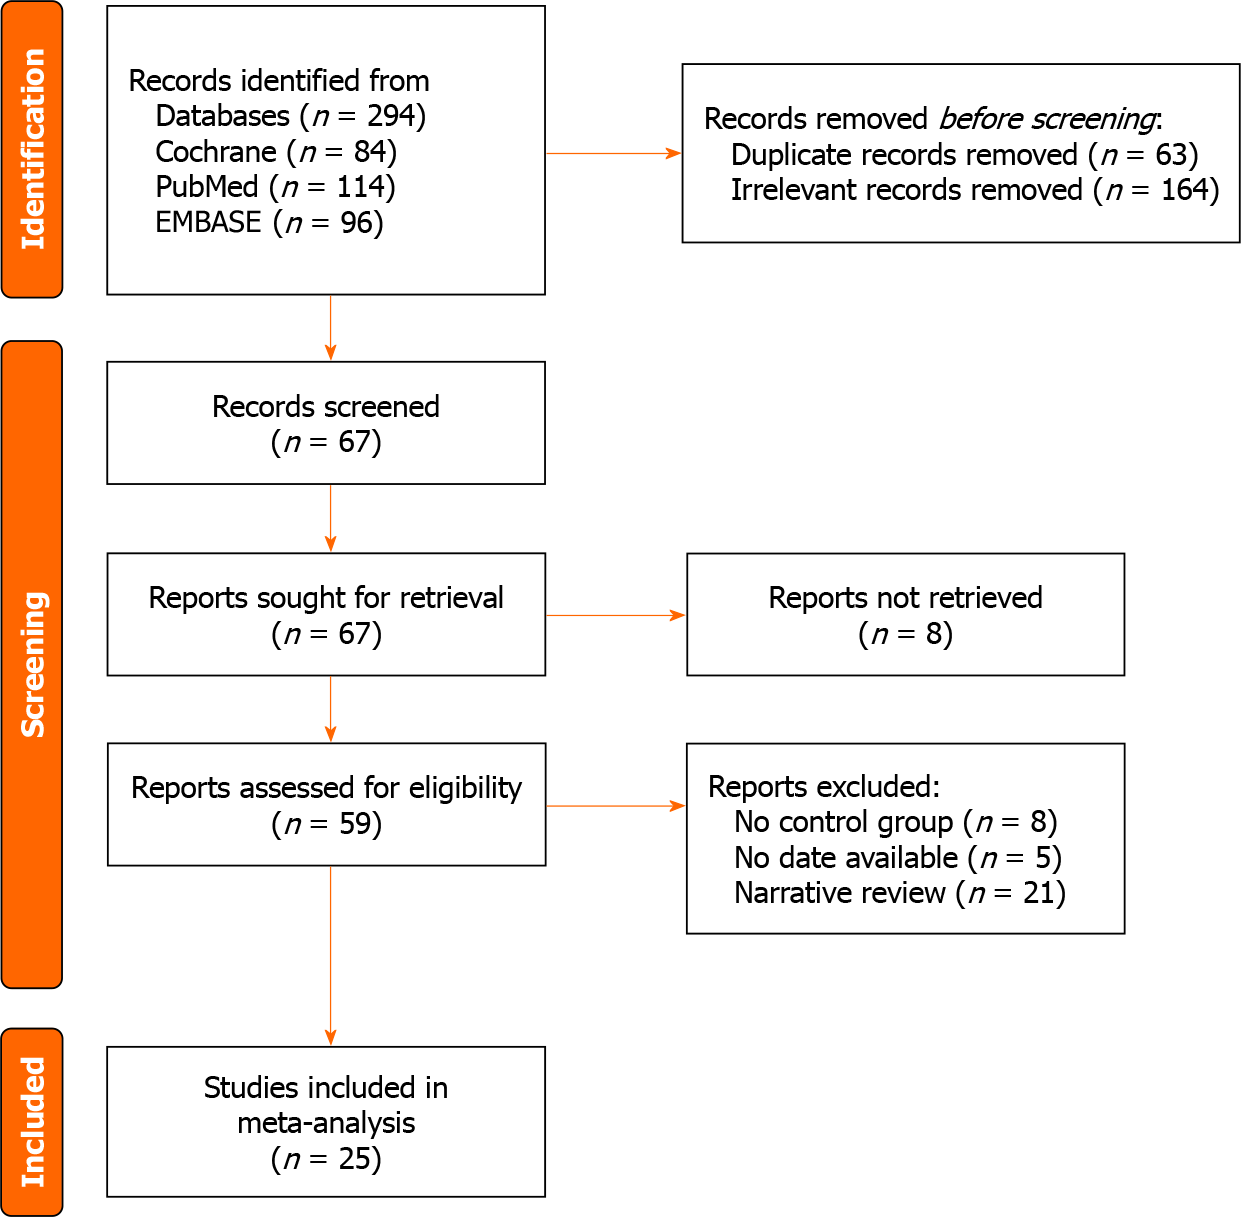
Figure 1 Flowchart of included studies.
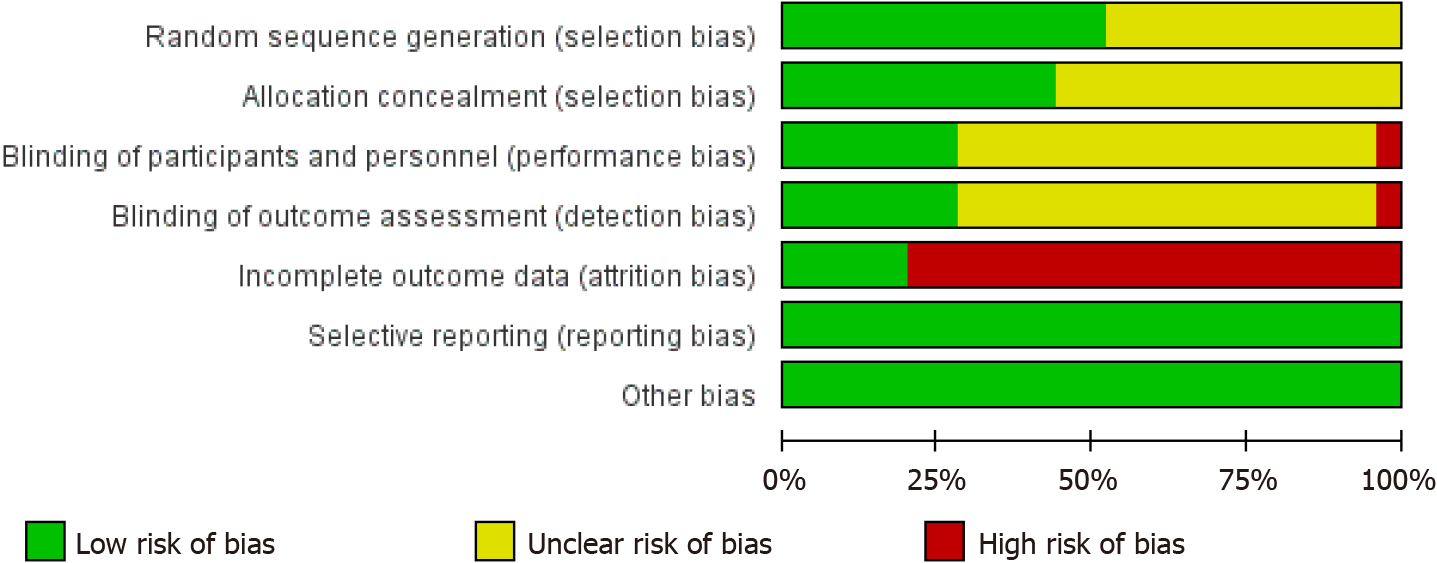
Figure 2 Proportions in the methodological quality assessment.
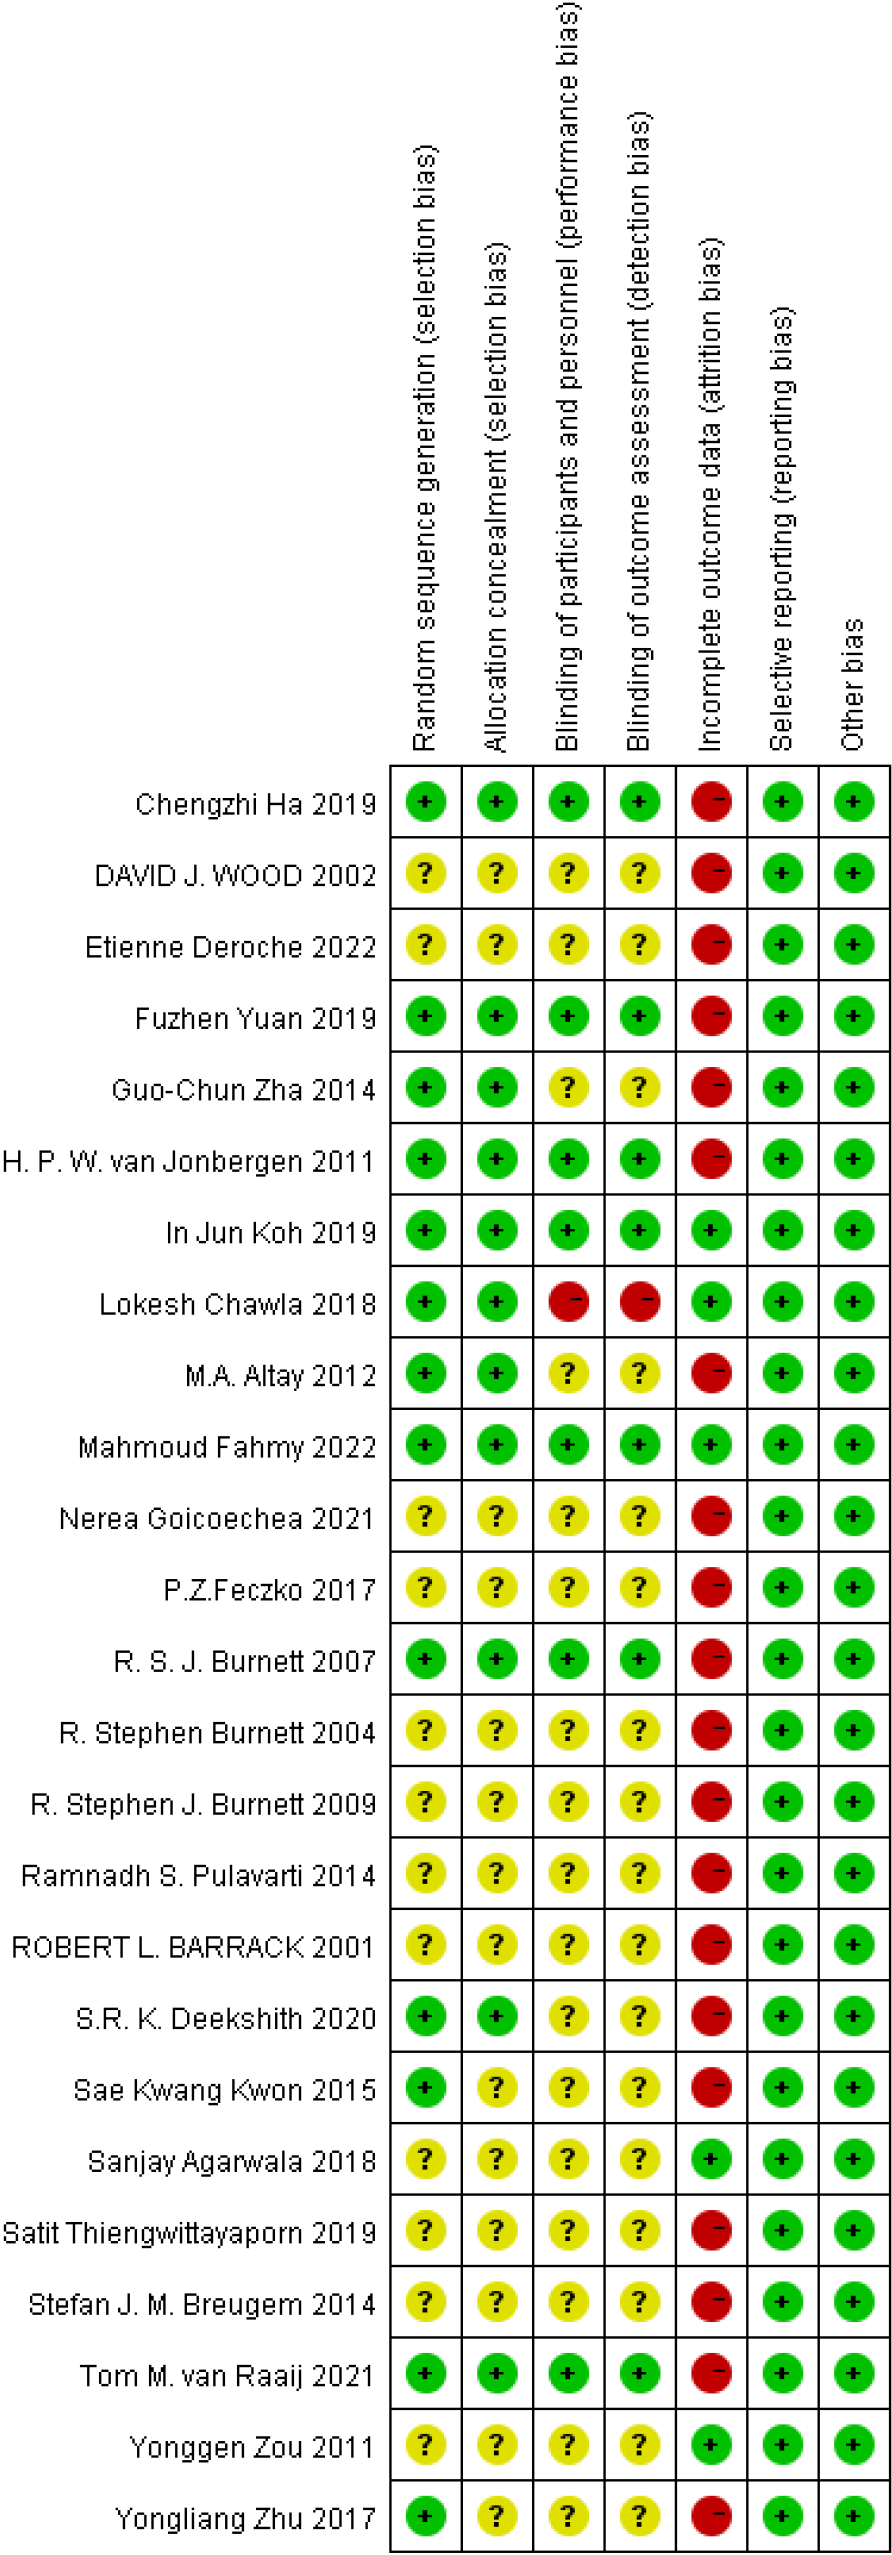
Figure 3 Methodological quality.
Figure 4 Forest plot for patellar resurfacing vs no resurfacing.
95%CI: 95% confidence interval.
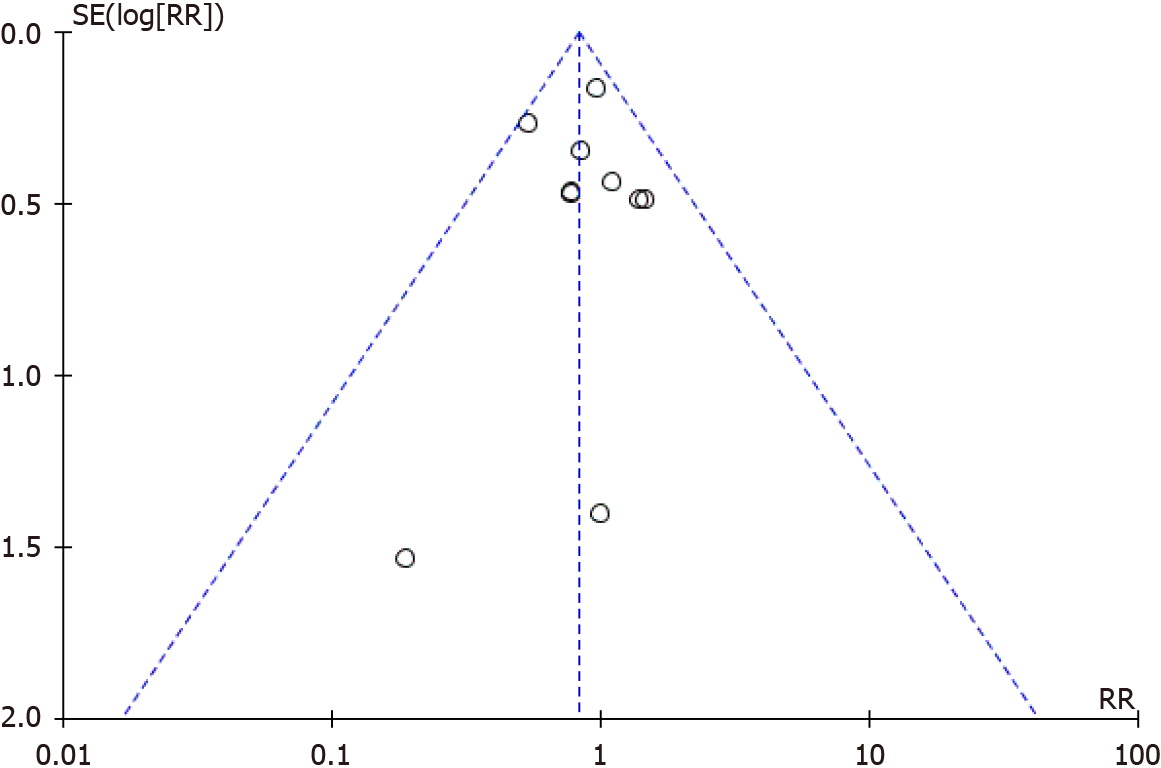
Figure 5 Funnel plot for patellar resurfacing vs no resurfacing.
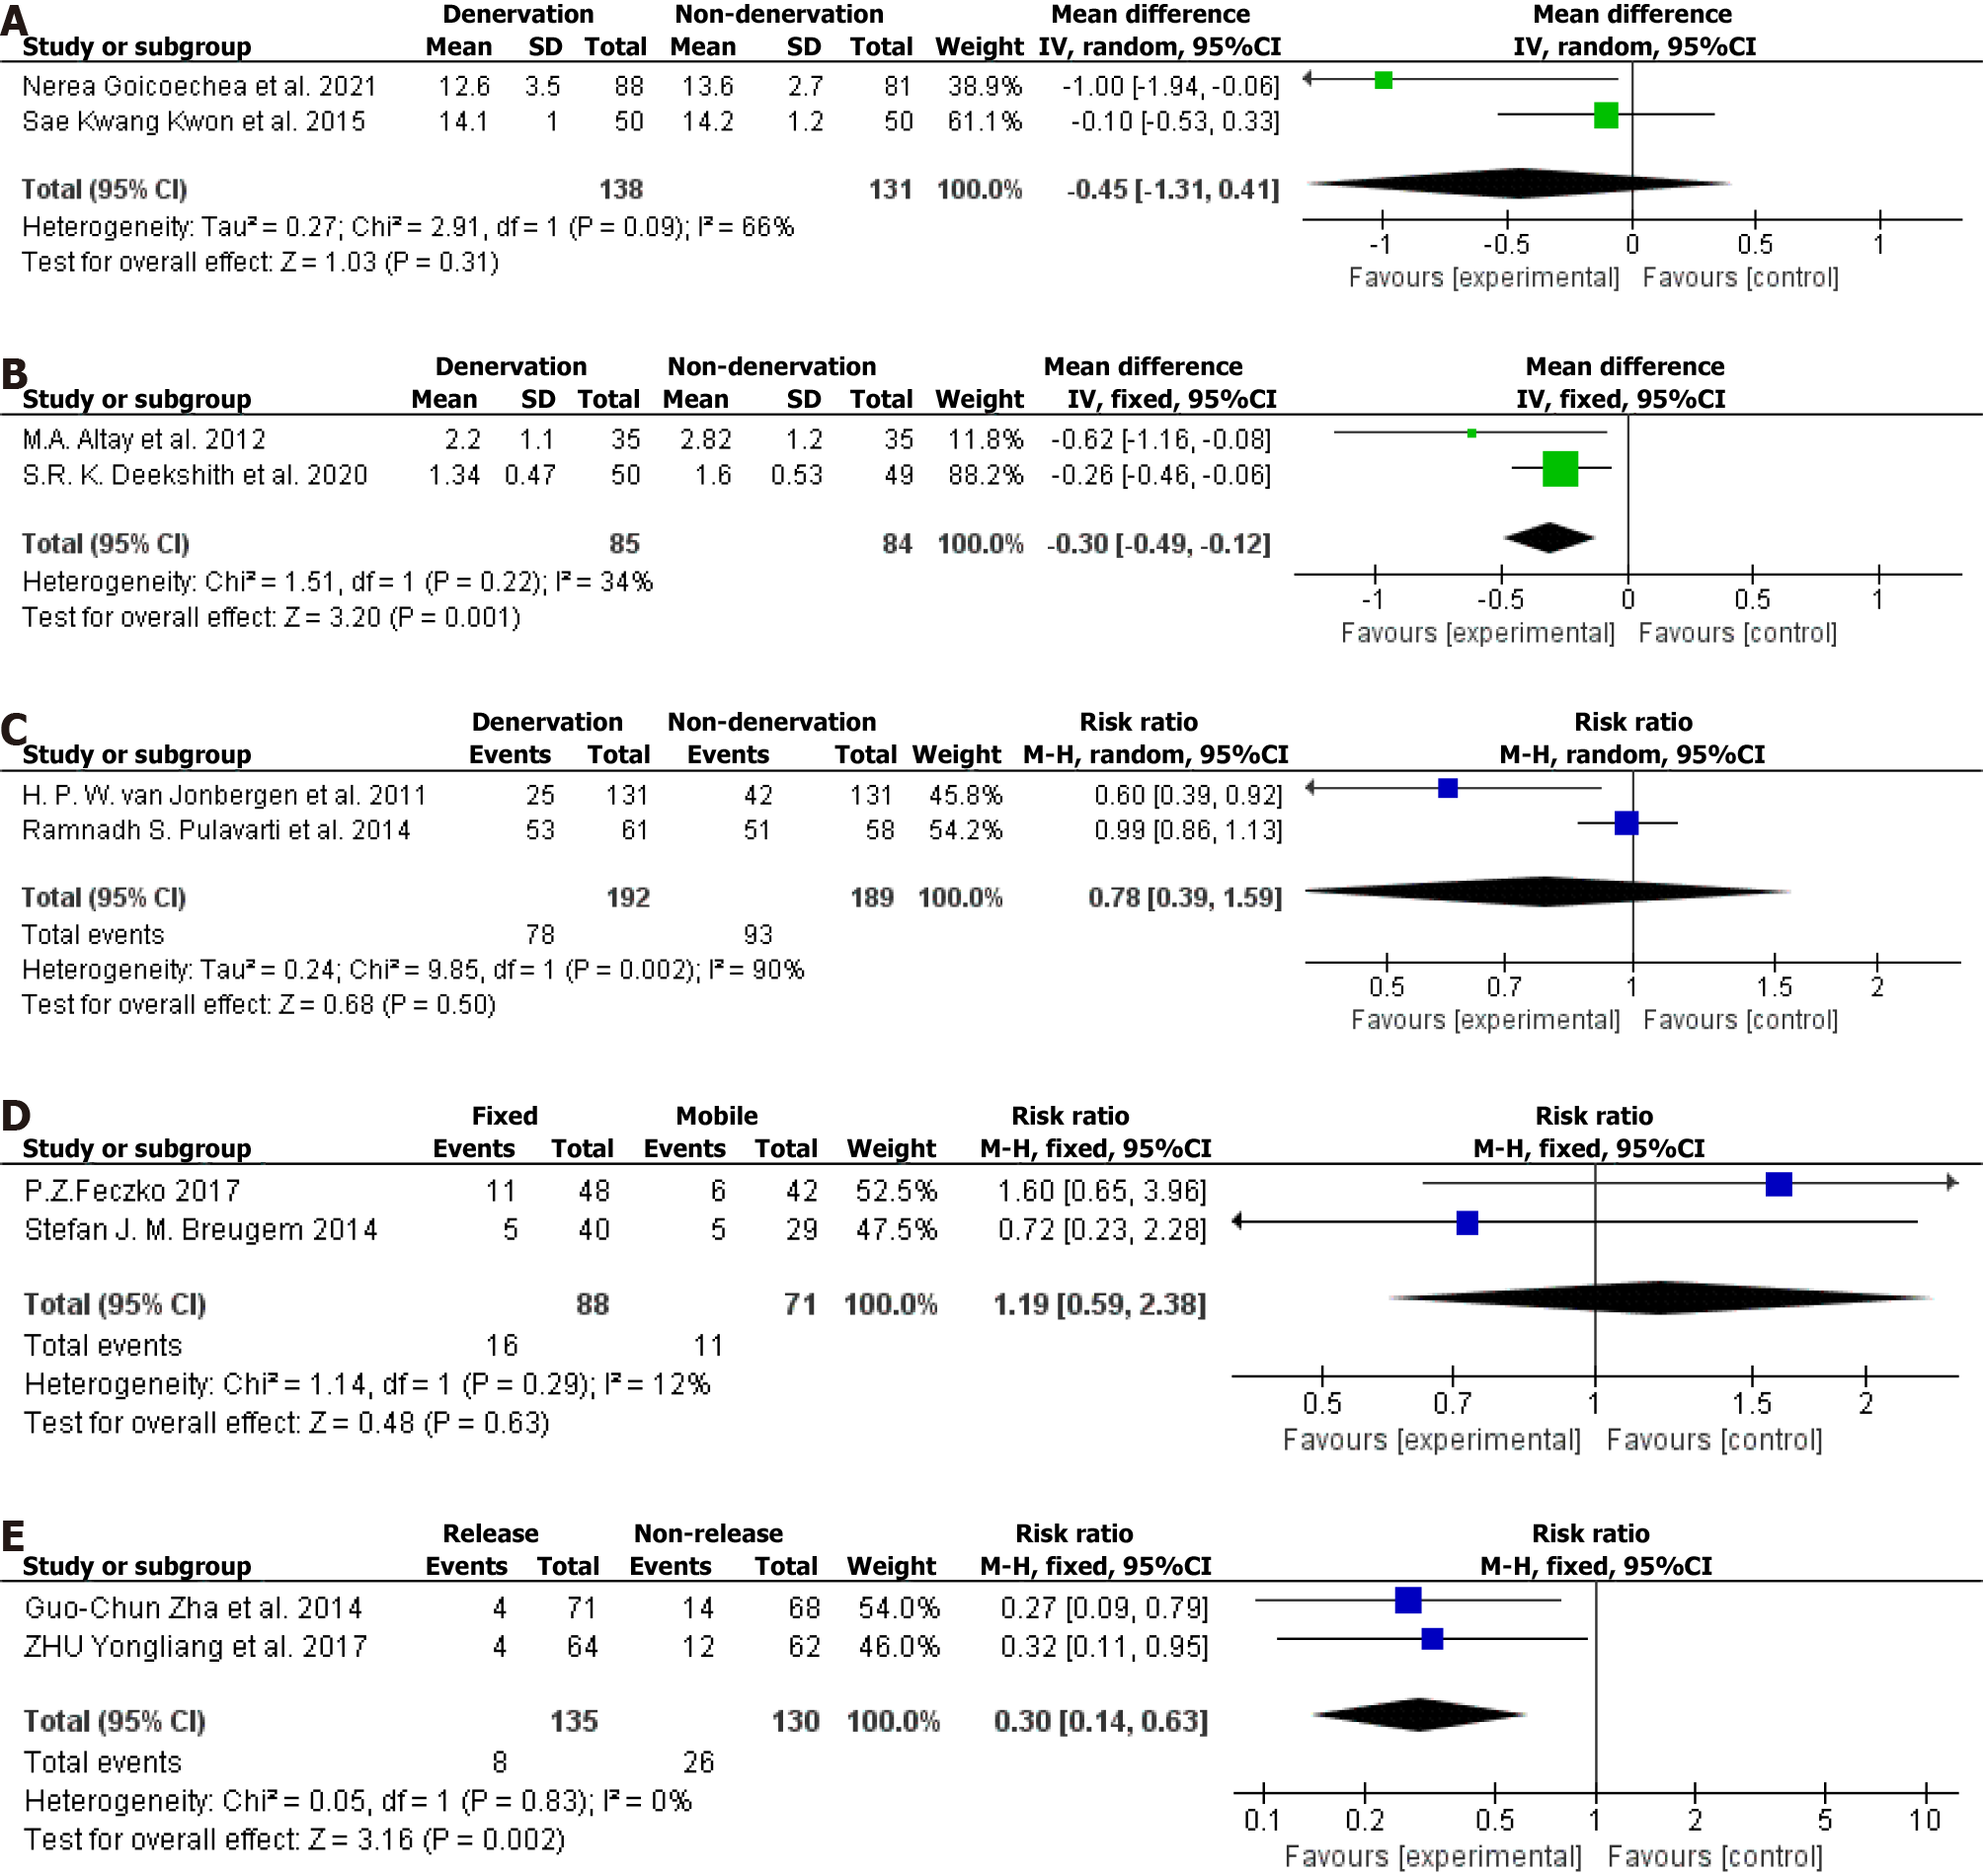
Figure 6 Forest plot.
A: Forest plot for patellofemoral Feller score subgroups; B: Forest plot for the visual analog scale score subgroup; C: Forest plot for the subgroup of patients with anterior knee pain; D: Forest plot for using fixed or mobile-bearing total knee arthroplasty; E: Forest plot for lateral retinacular release vs non-release. 95%CI: 95% confidence interval.
- Citation: Feng H, Feng ML, Cheng JB, Zhang X, Tao HC. Meta-analysis of factors influencing anterior knee pain after total knee arthroplasty. World J Orthop 2024; 15(2): 180-191
- URL: https://www.wjgnet.com/2218-5836/full/v15/i2/180.htm
- DOI: https://dx.doi.org/10.5312/wjo.v15.i2.180


