Copyright
©The Author(s) 2024.
World J Orthop. Dec 18, 2024; 15(12): 1164-1174
Published online Dec 18, 2024. doi: 10.5312/wjo.v15.i12.1164
Published online Dec 18, 2024. doi: 10.5312/wjo.v15.i12.1164
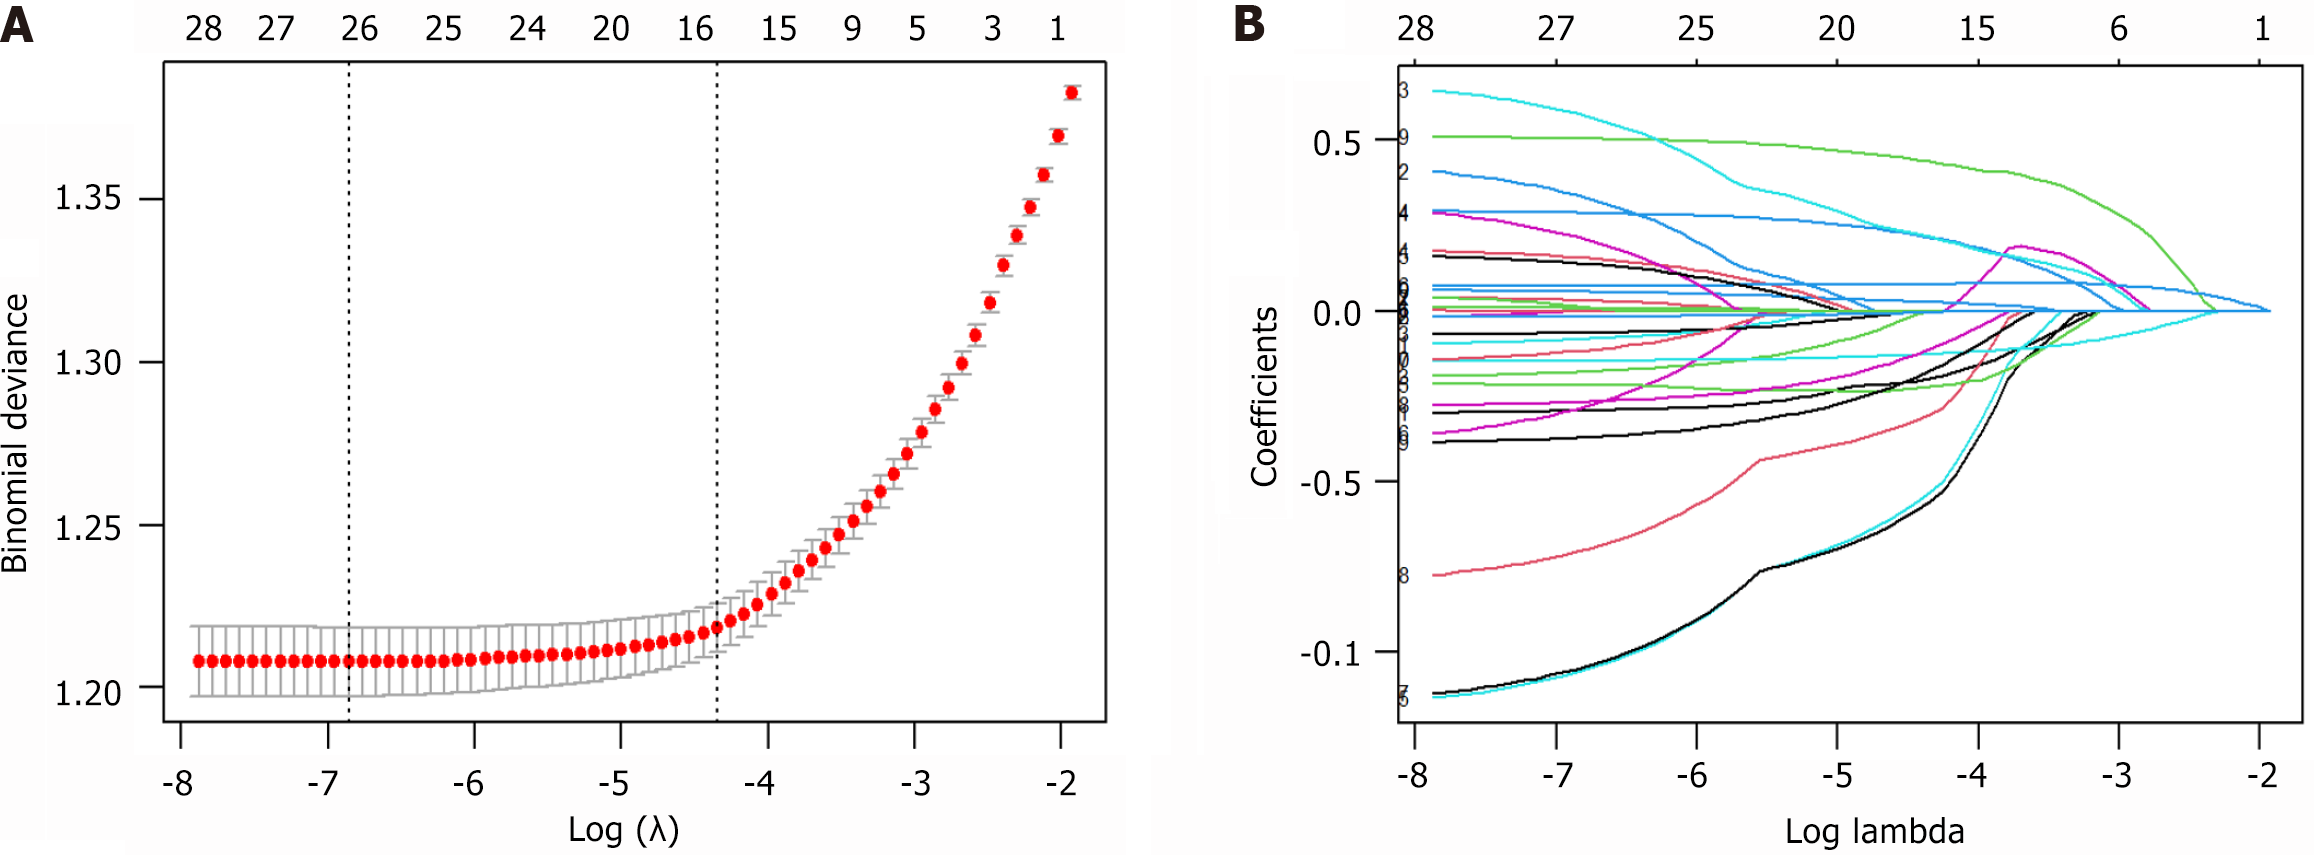
Figure 1 Least absolute shrinkage and selection regression model.
A: The least absolute shrinkage and selection regression model uses log(lambda) sequences with nonzero coefficients produced by the optimal lambda to create coefficient distributions for the selection of clinical and demographic characteristics; B: The log(lambda) sequence was used to generate the coefficient distribution, and vertical lines were created at the values determined by 10-fold cross-validation. Lambda.1-se was chosen as the ideal lambda in this study, resulting in 16 features with non-zero coefficients.
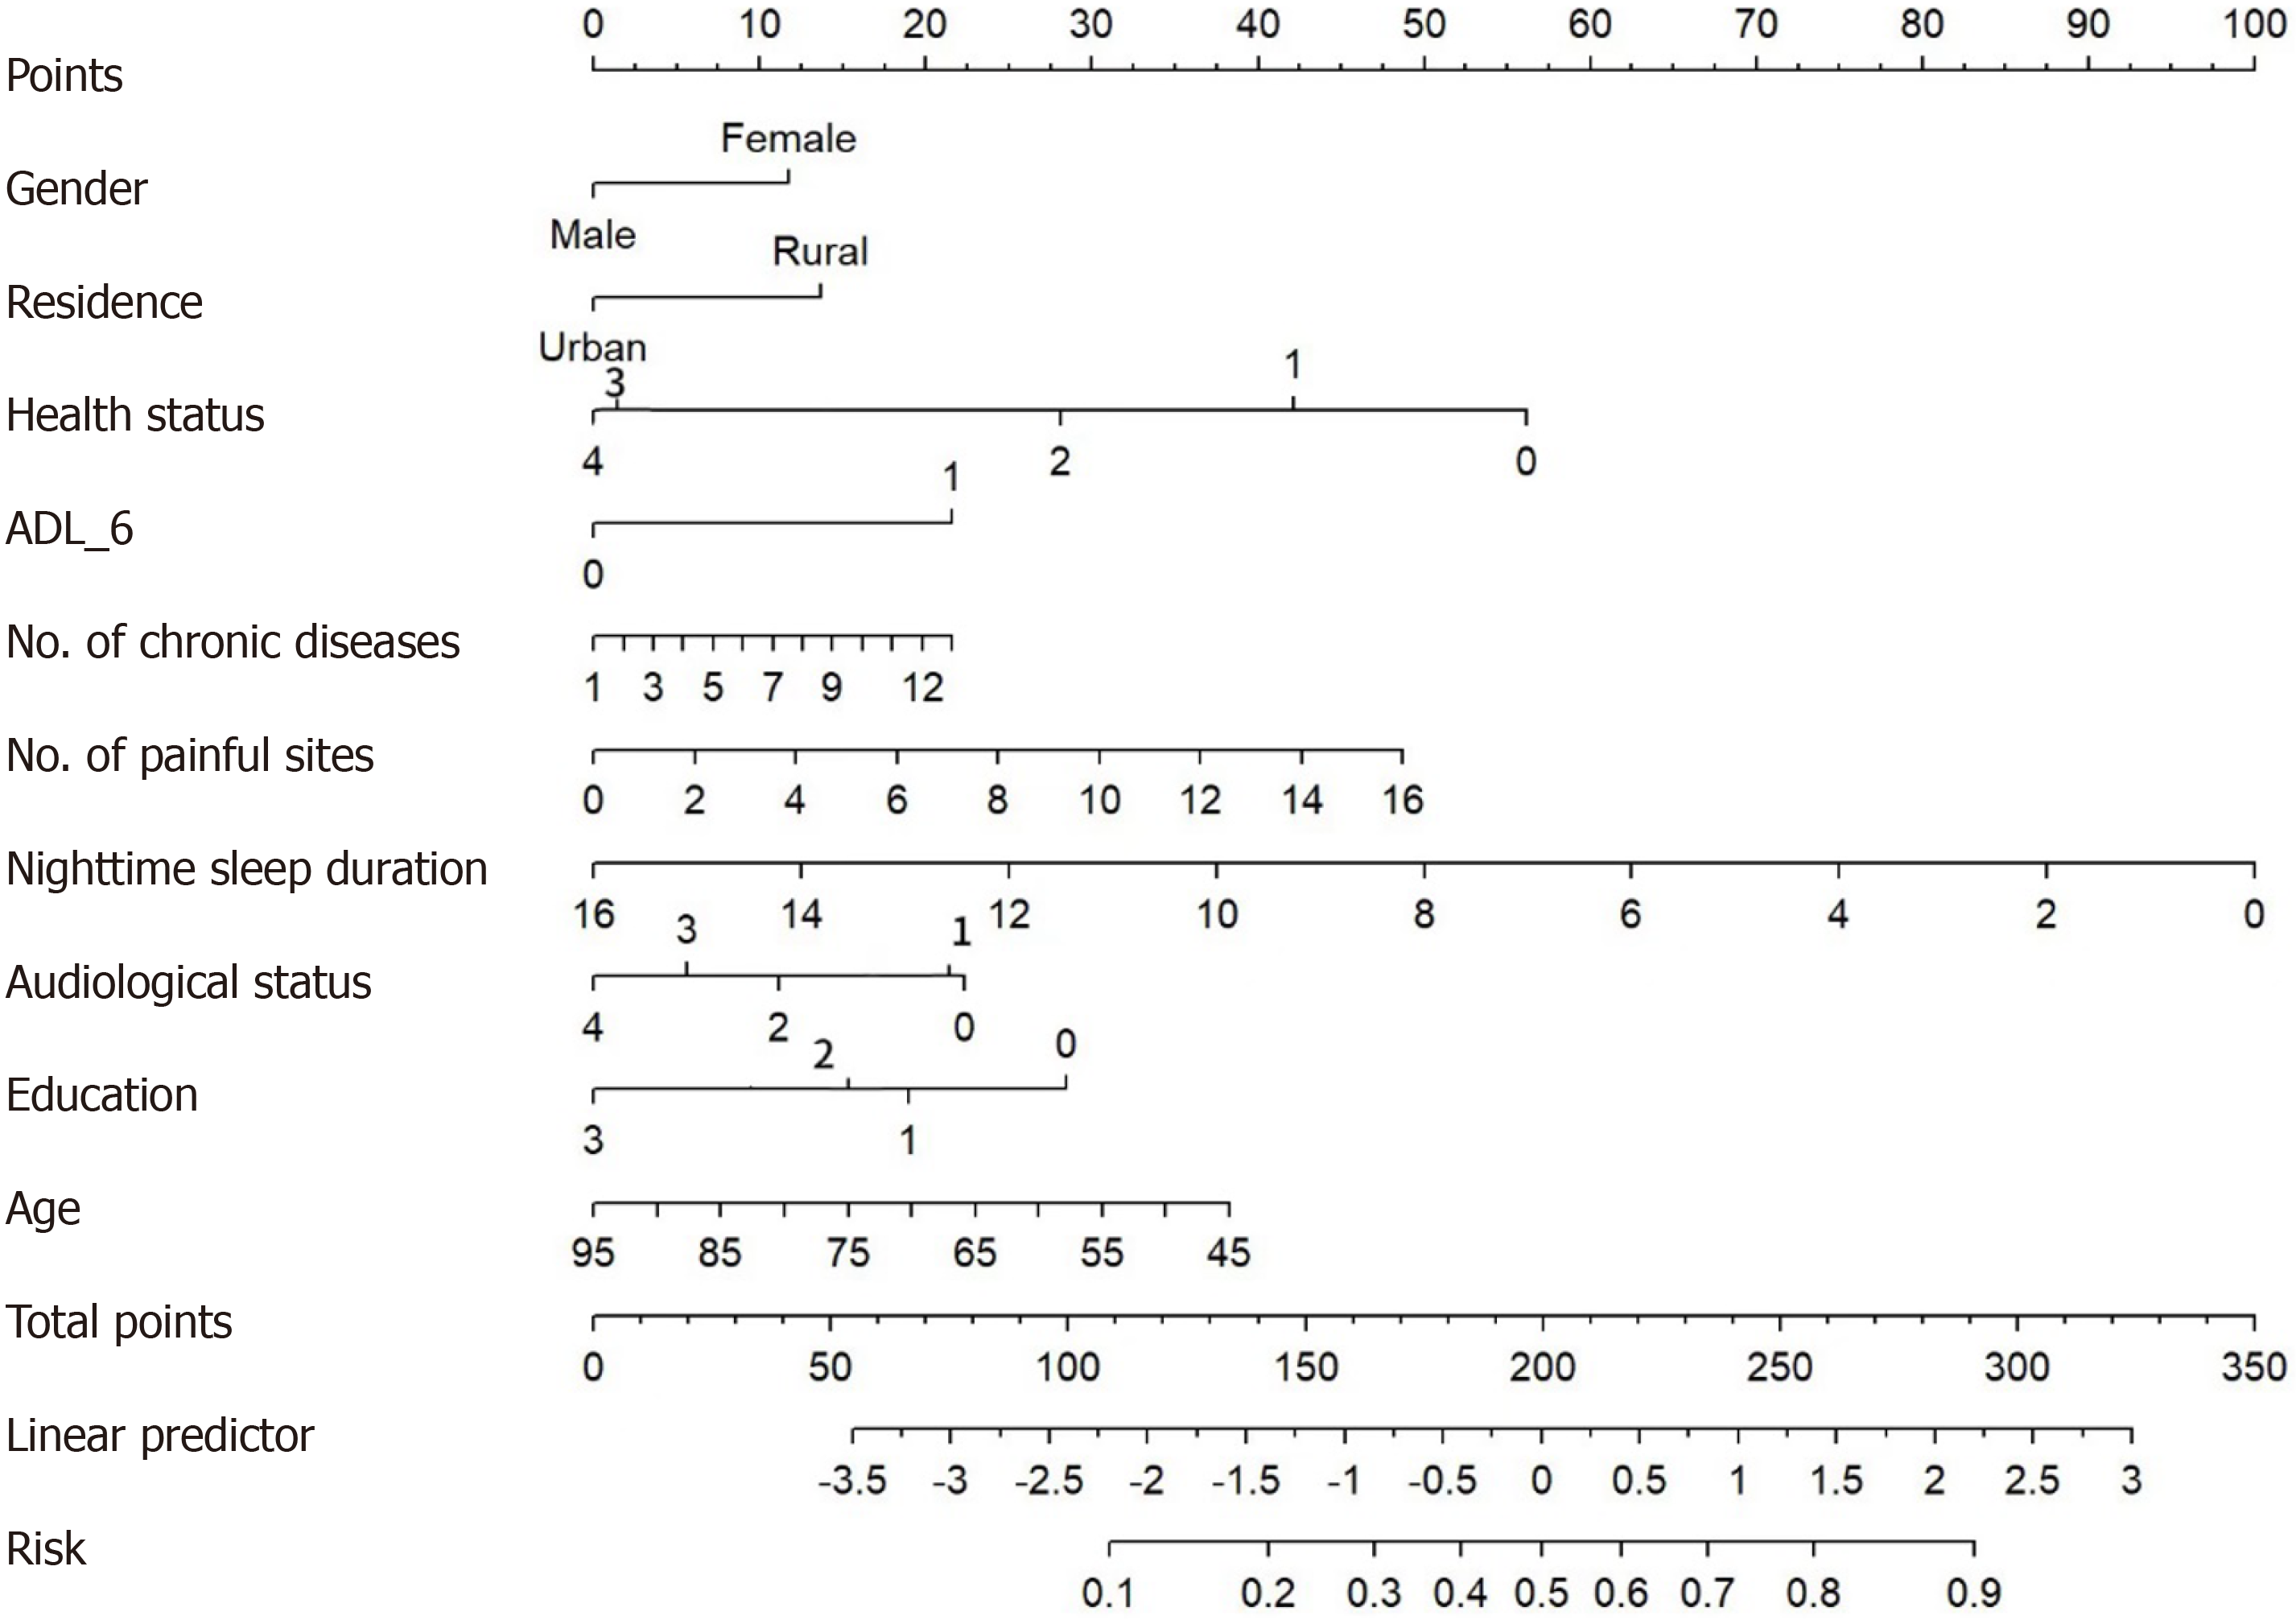
Figure 2 A risk prediction model for depression in a middle-aged and elderly arthritic population.
ADL: Activities of daily living.
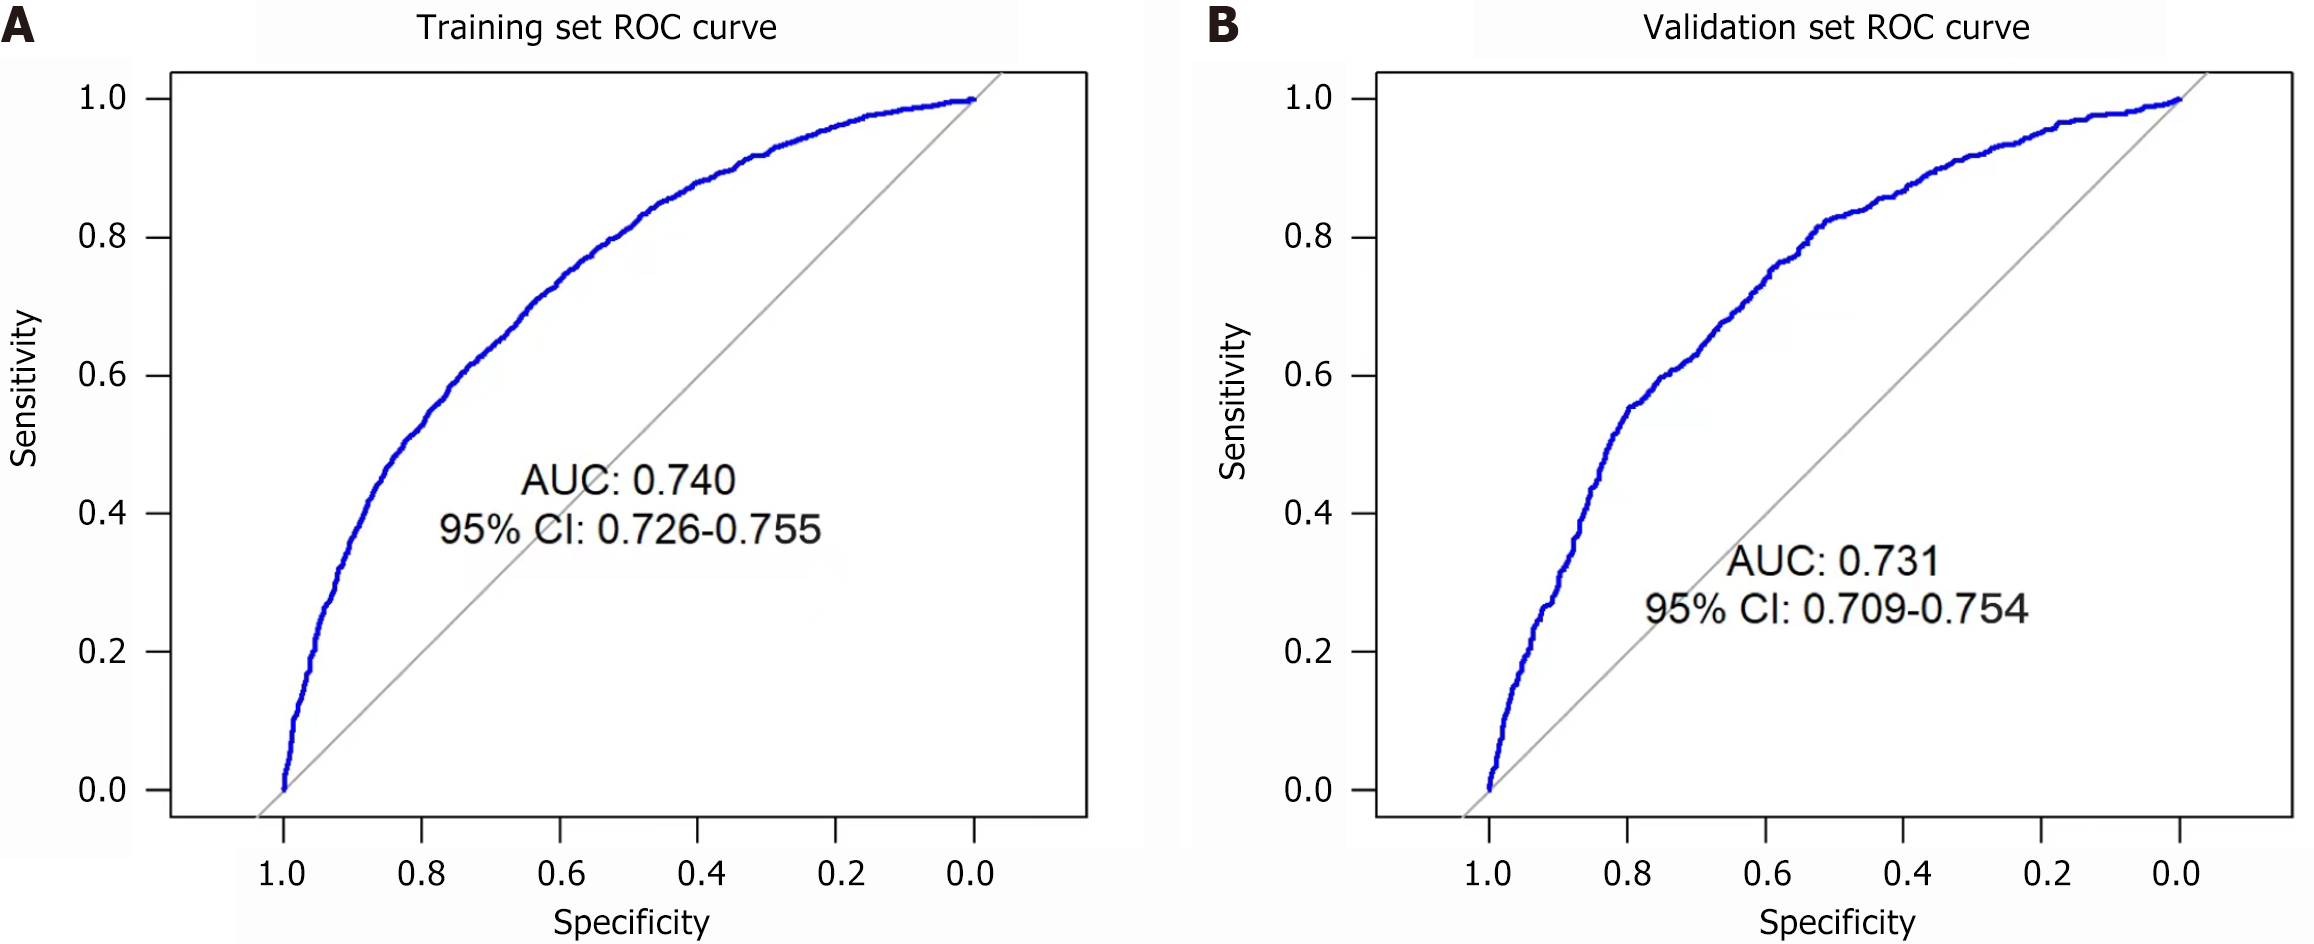
Figure 3 Training set, and validation set receiver operating characteristic curves.
A: Receiver operating characteristic curves for the training set; B: Receiver operating characteristic curves for the validation set. ROC: Receiver operating characteristic; CI: Confidence interval; AUC: Area under the curve.
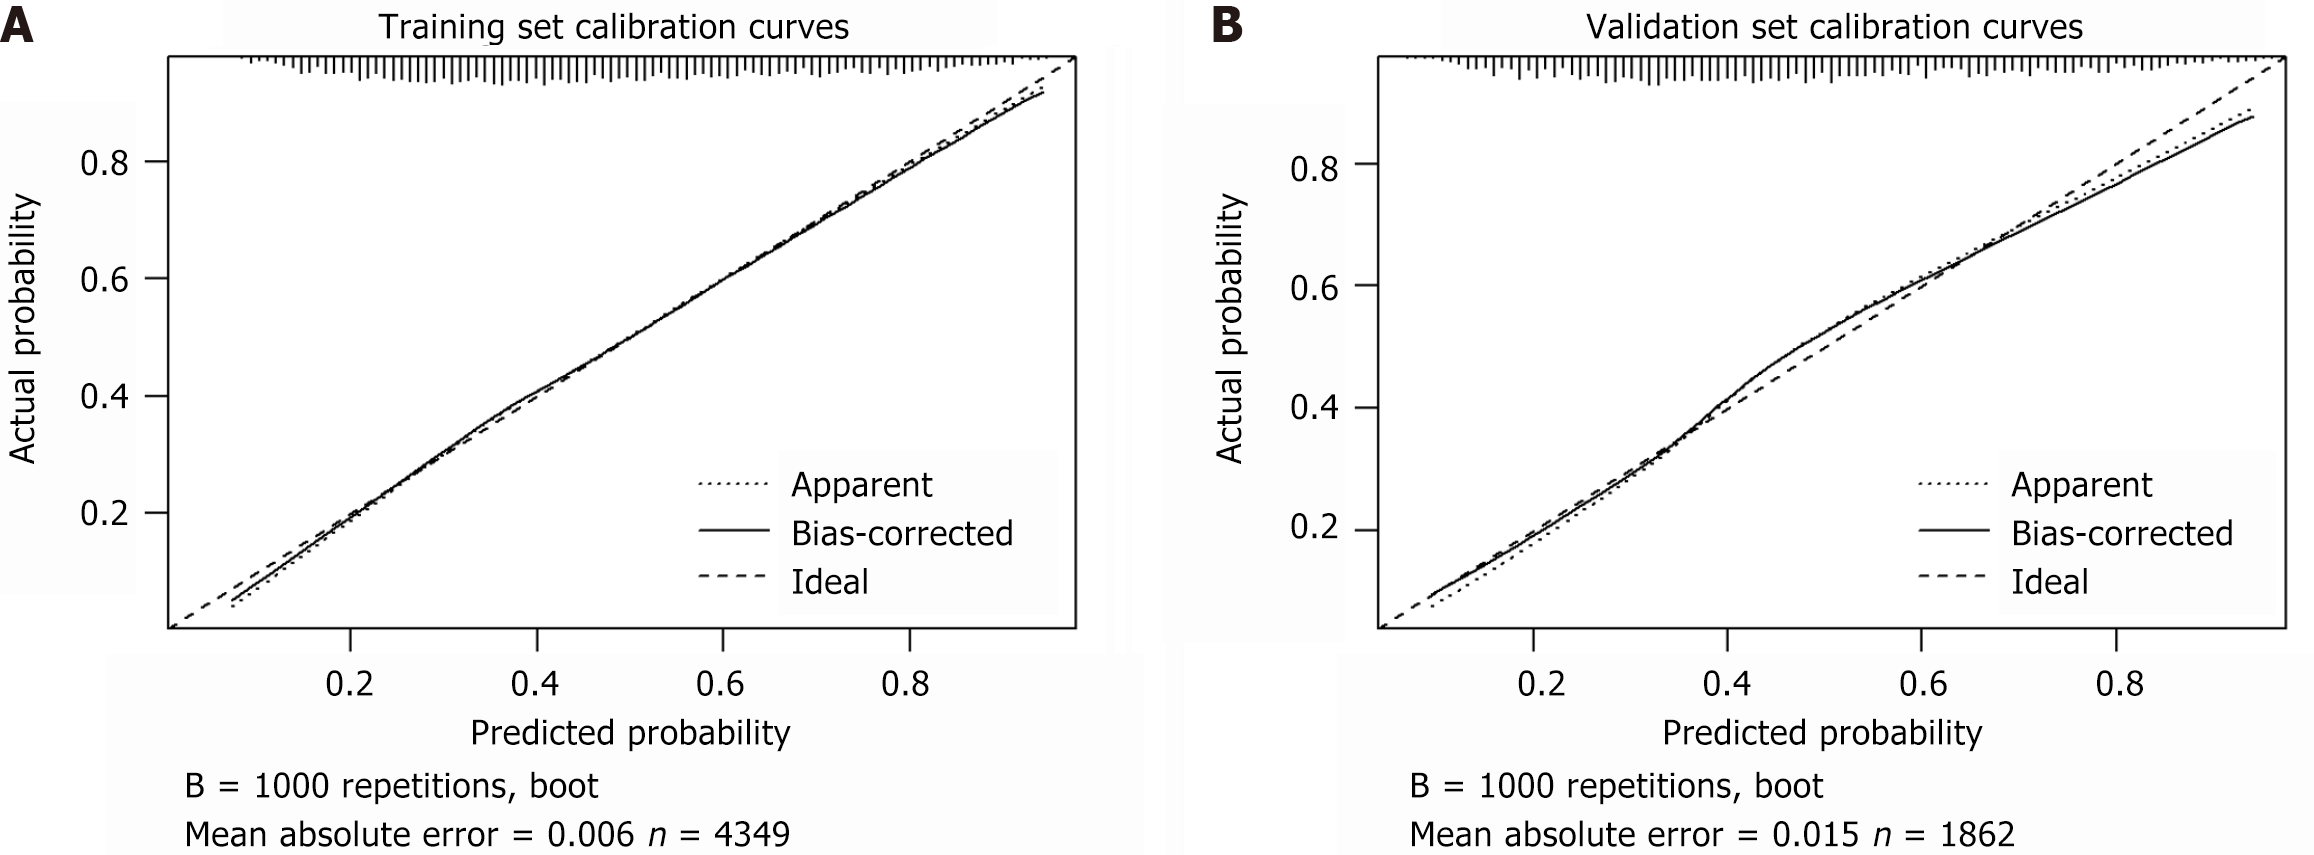
Figure 4 Calibration curves for the training set, and the validation set depression risk model.
A: Calibration curves for the training set; B: Calibration curves for the validation set.
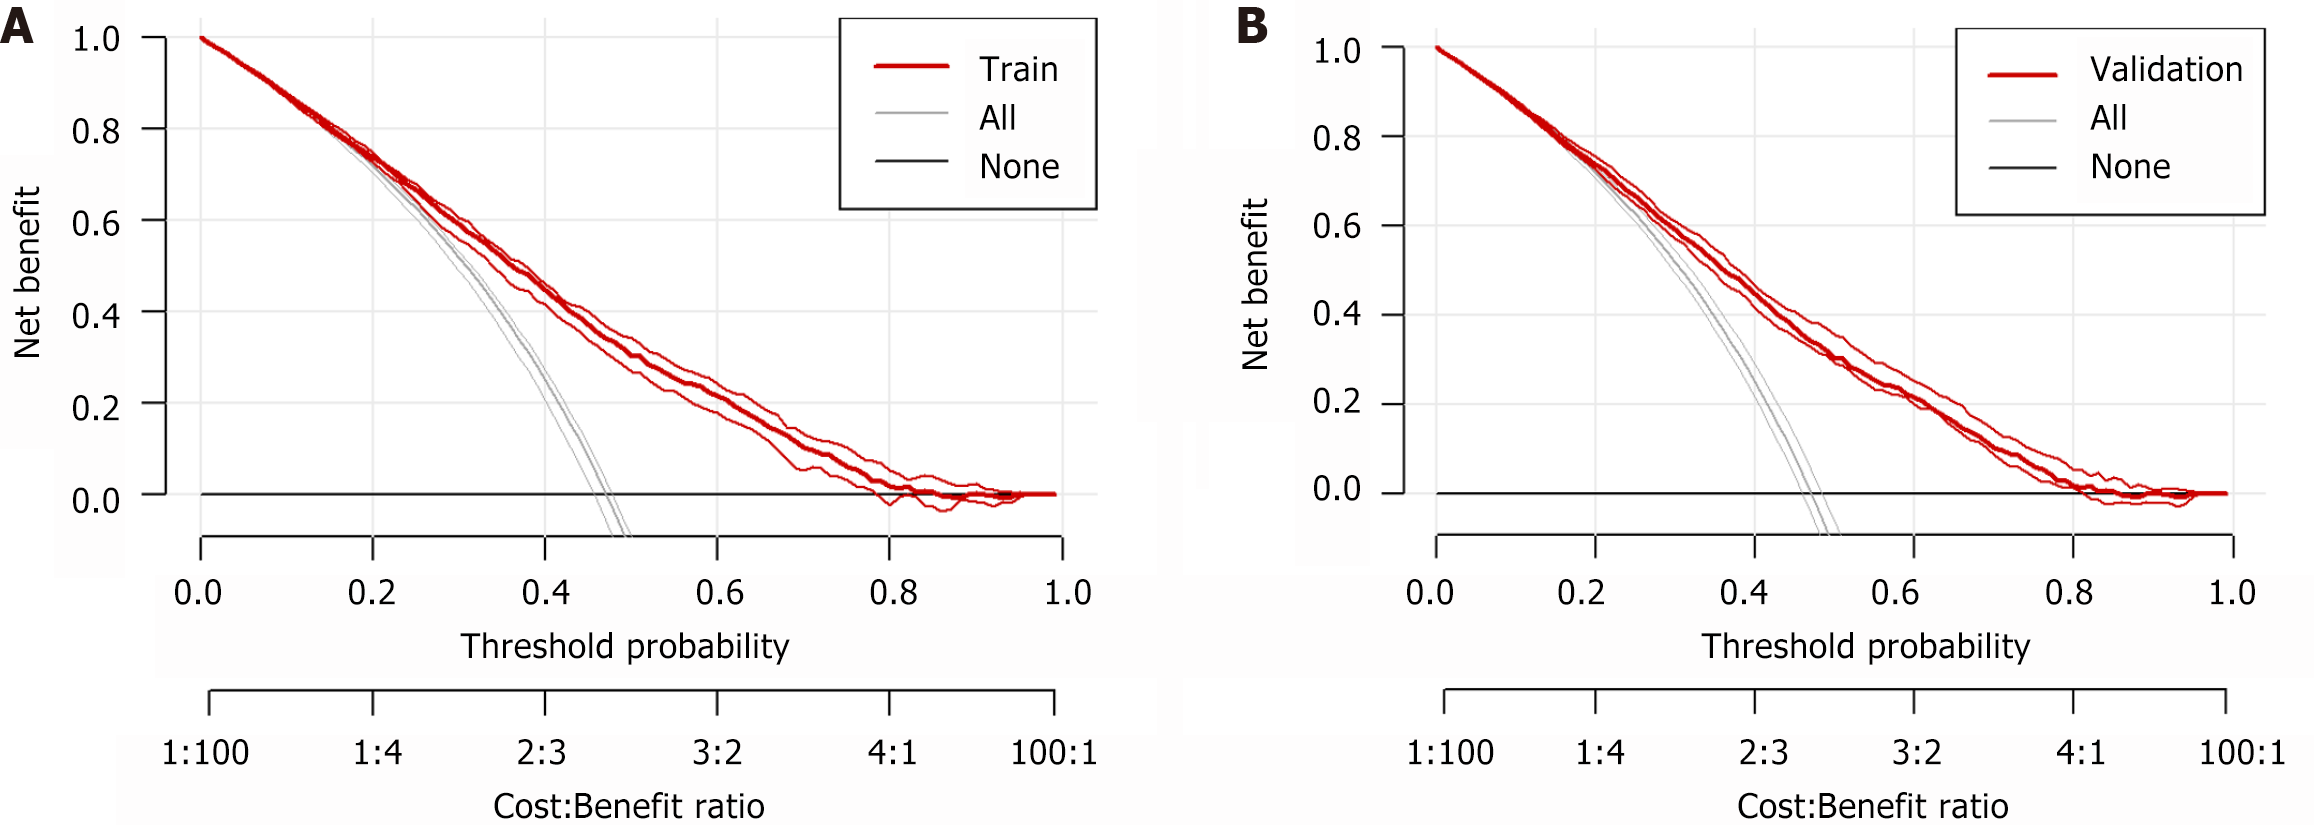
Figure 5 Decision curve analysis curves for the training set, and the validation set depression risk model.
A: Decision curve analysis curves for the training set; B: Decision curve analysis curves for the validation set.
- Citation: Shi JW, Kang W, Wang XH, Zheng JL, Xu W. Construction and validation of a risk prediction model for depressive symptoms in a middle-aged and elderly arthritis population. World J Orthop 2024; 15(12): 1164-1174
- URL: https://www.wjgnet.com/2218-5836/full/v15/i12/1164.htm
- DOI: https://dx.doi.org/10.5312/wjo.v15.i12.1164


