Copyright
©The Author(s) 2024.
World J Orthop. Dec 18, 2024; 15(12): 1146-1154
Published online Dec 18, 2024. doi: 10.5312/wjo.v15.i12.1146
Published online Dec 18, 2024. doi: 10.5312/wjo.v15.i12.1146
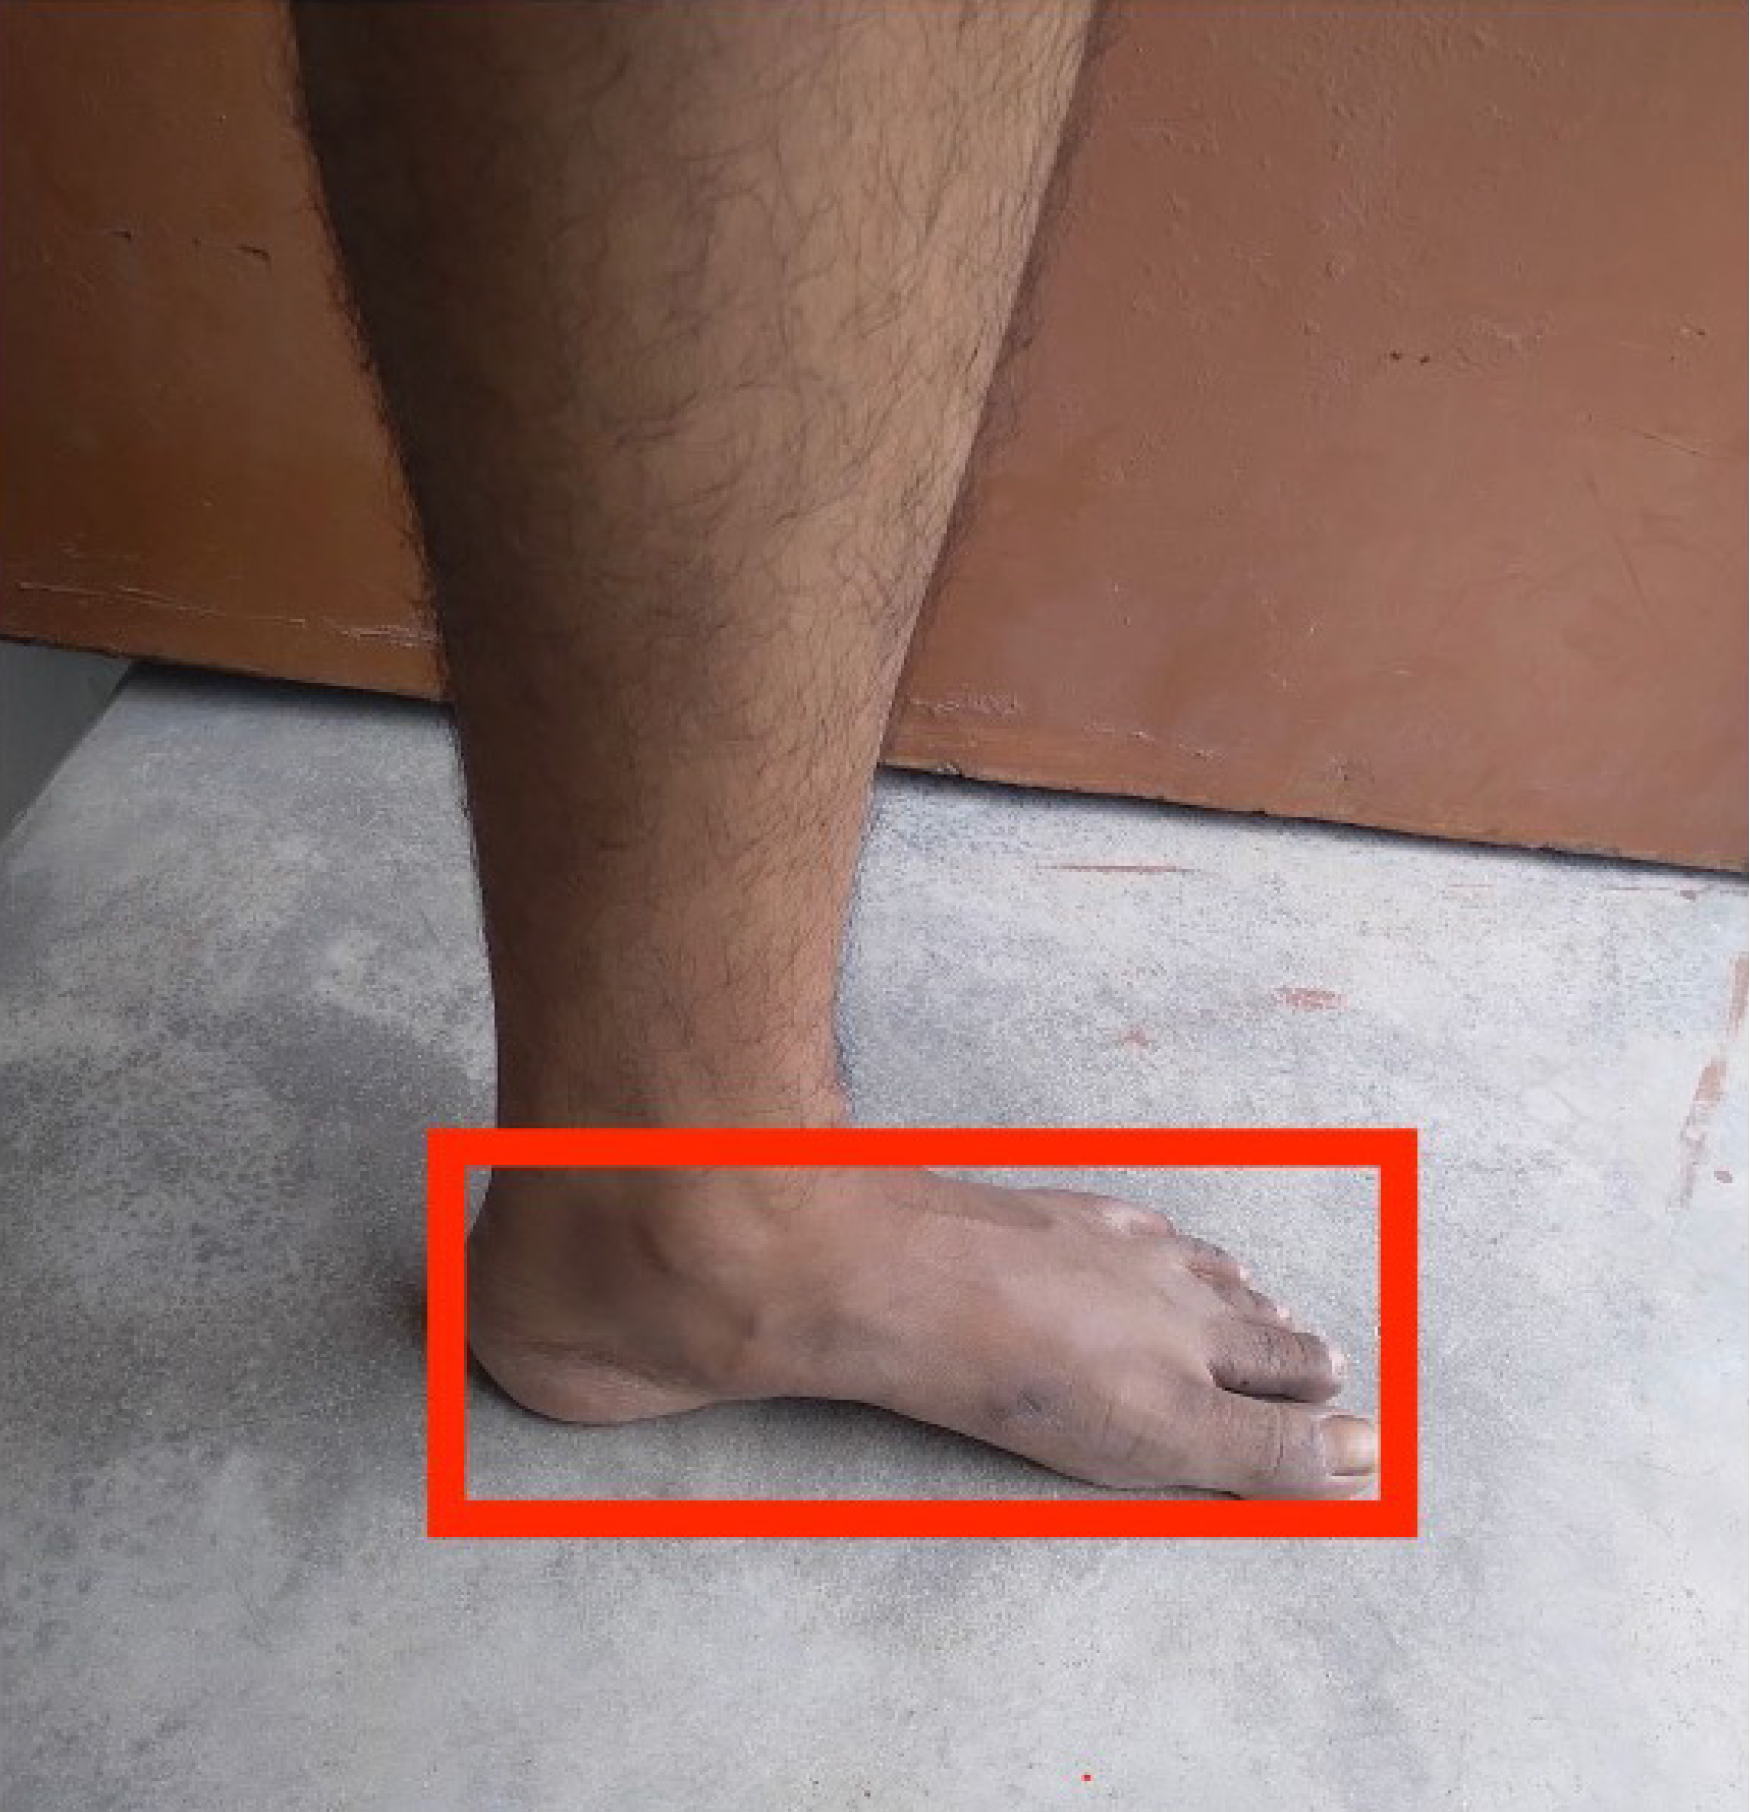
Figure 1 An example of an unscaled rectangular box that bounds the entire foot and ankle for images collected for deep learning algorithm training.
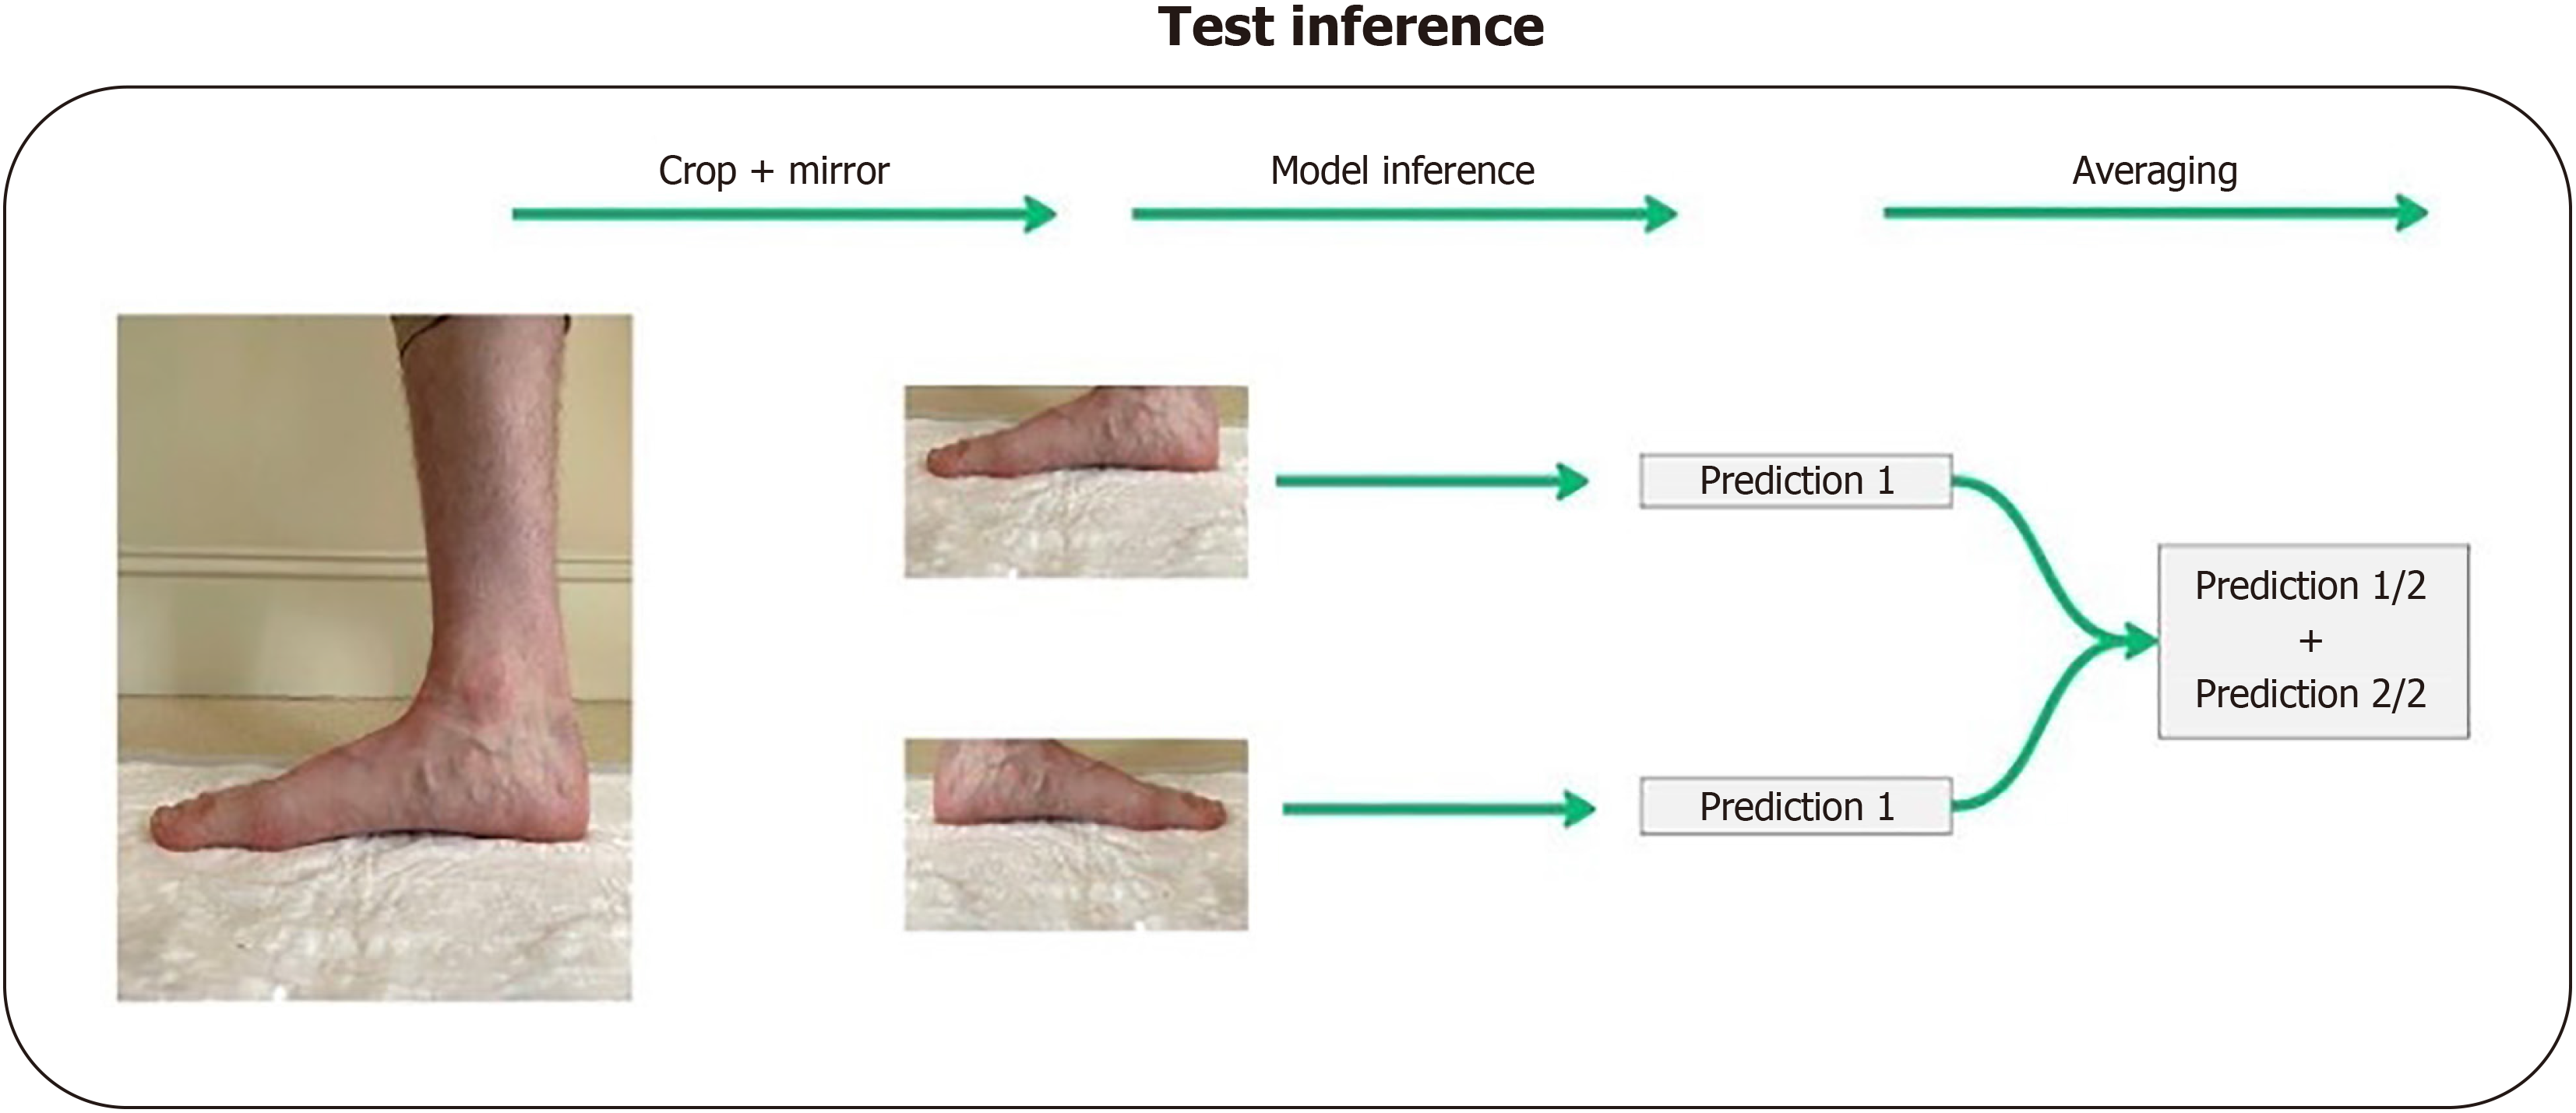
Figure 2 Flowchart showing the deep learning inference data processing pathway for the testing (offline) set.
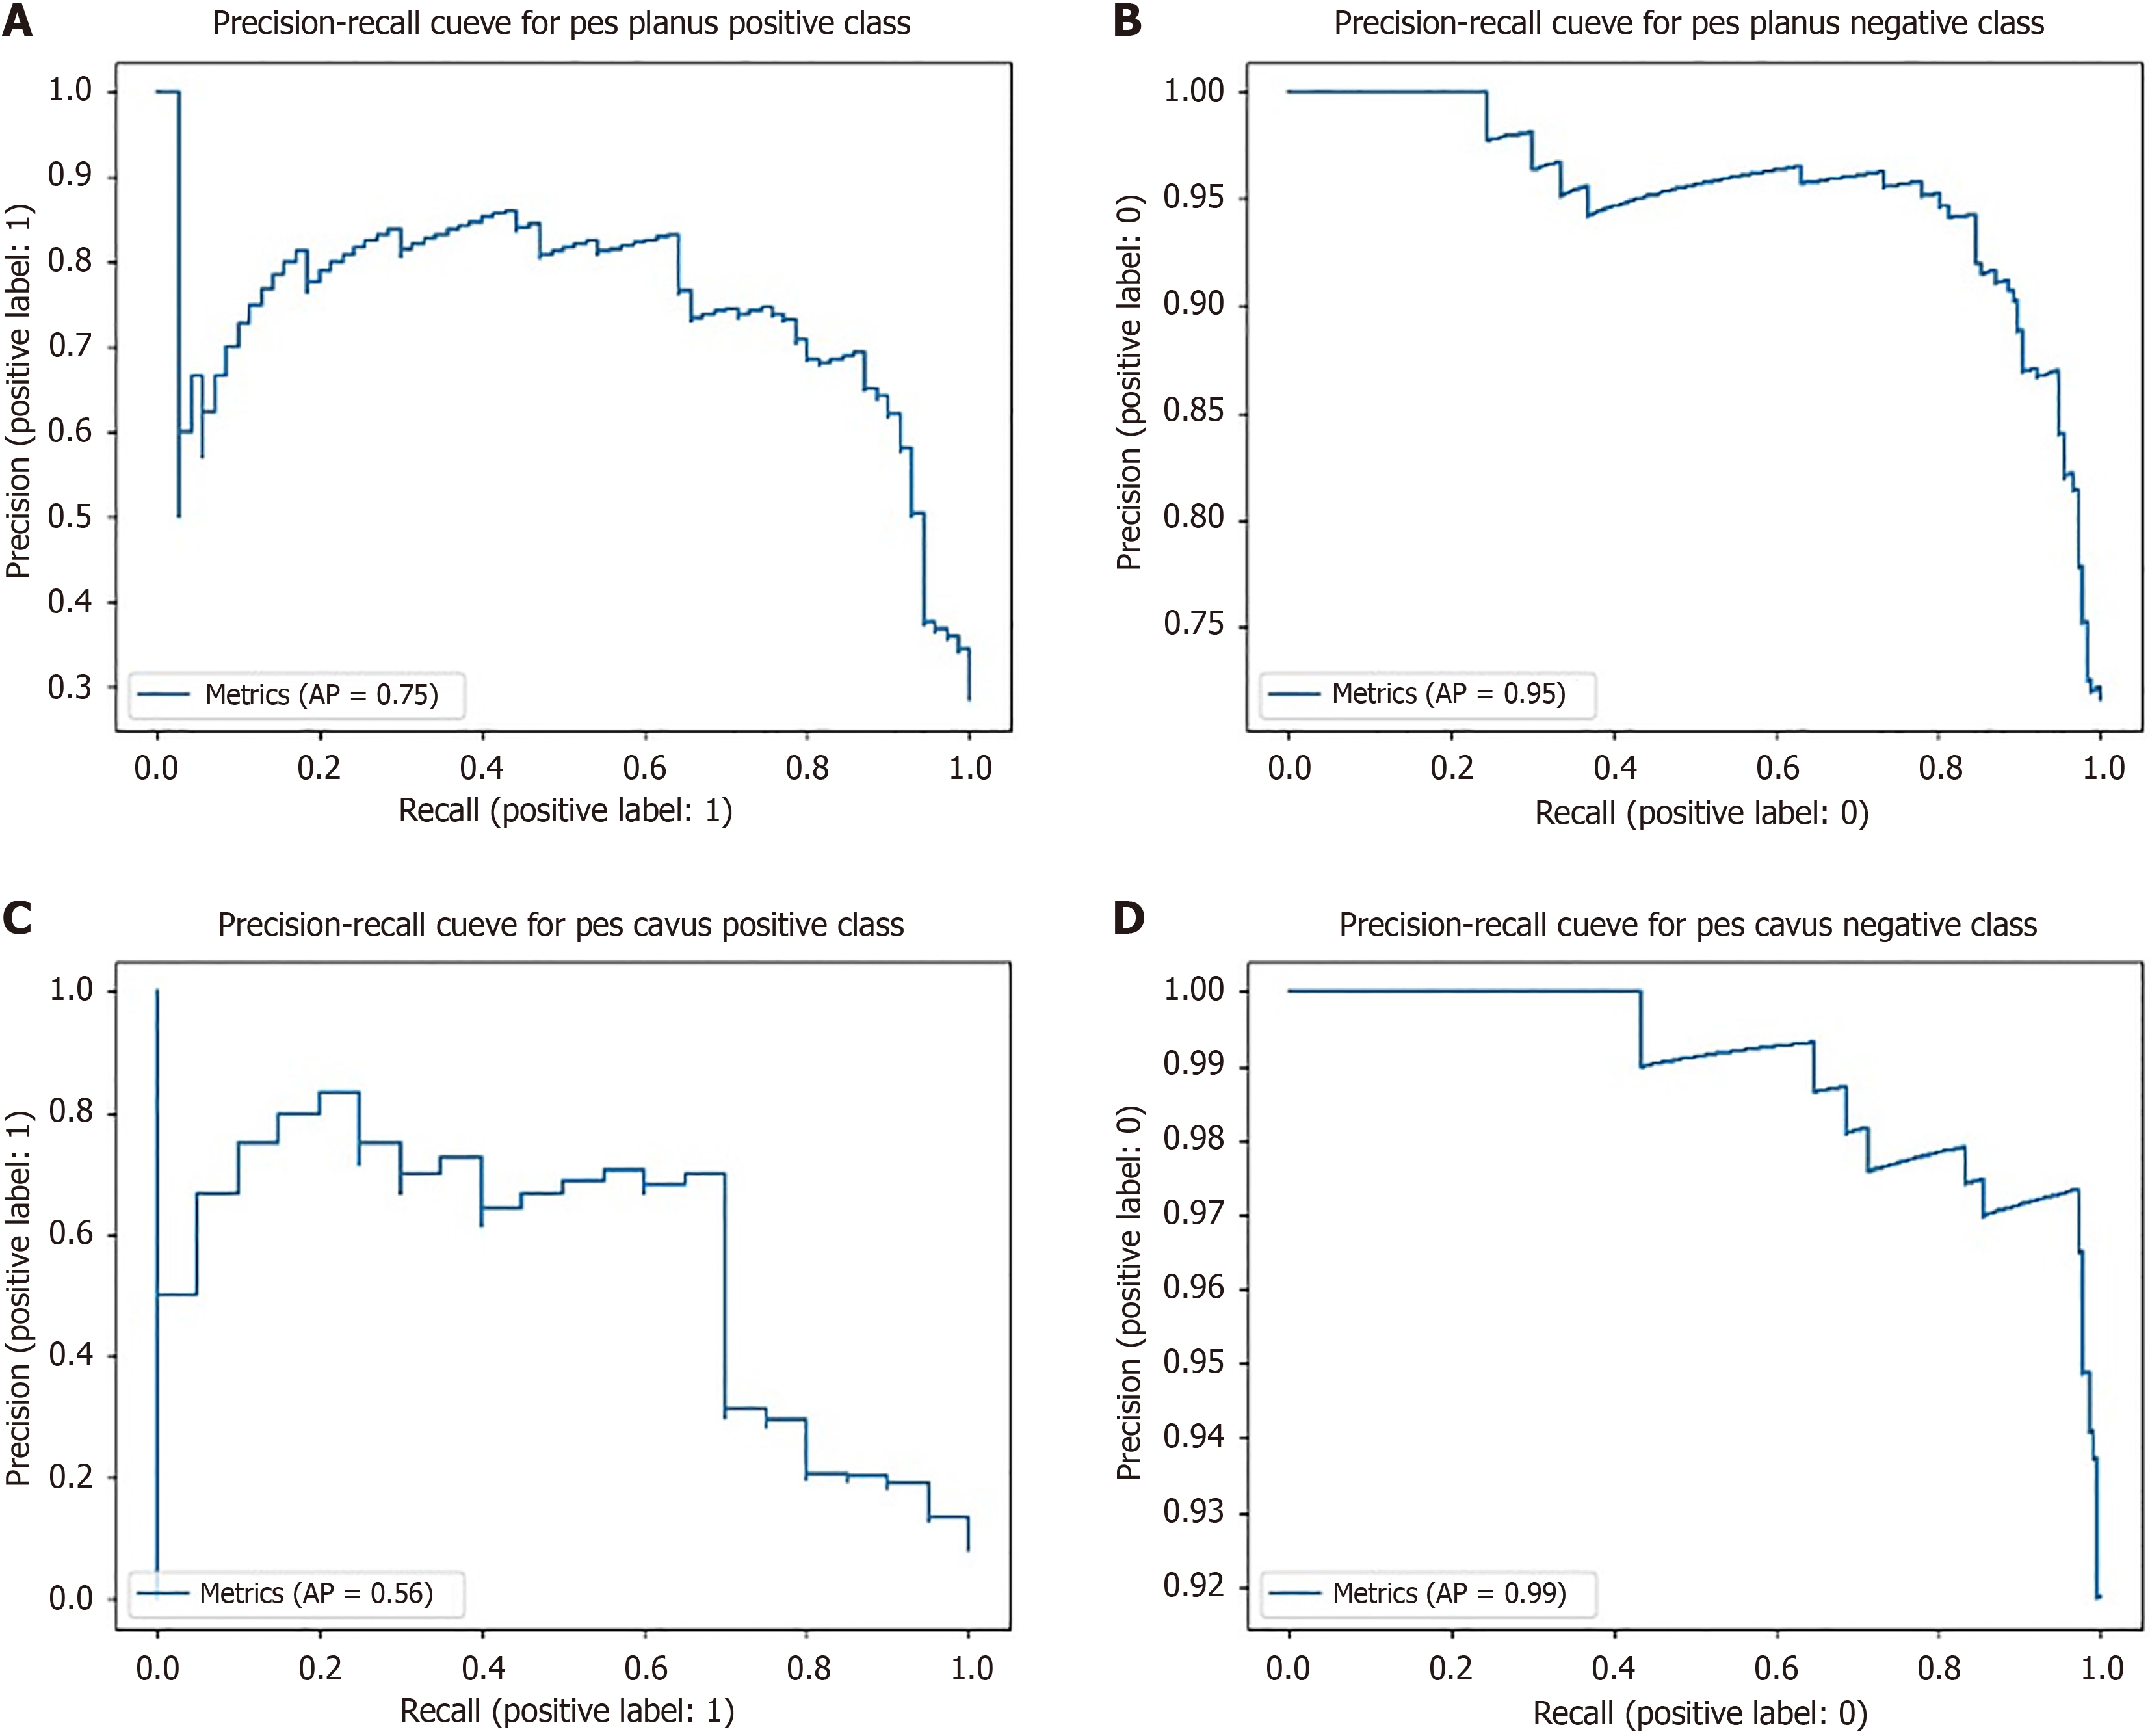
Figure 3 Precision-recall curves.
A: Positive class for pes planus; B: Negative class for pes planus; C: Positive class for pes cavus; D: Negative class for pes cavus.
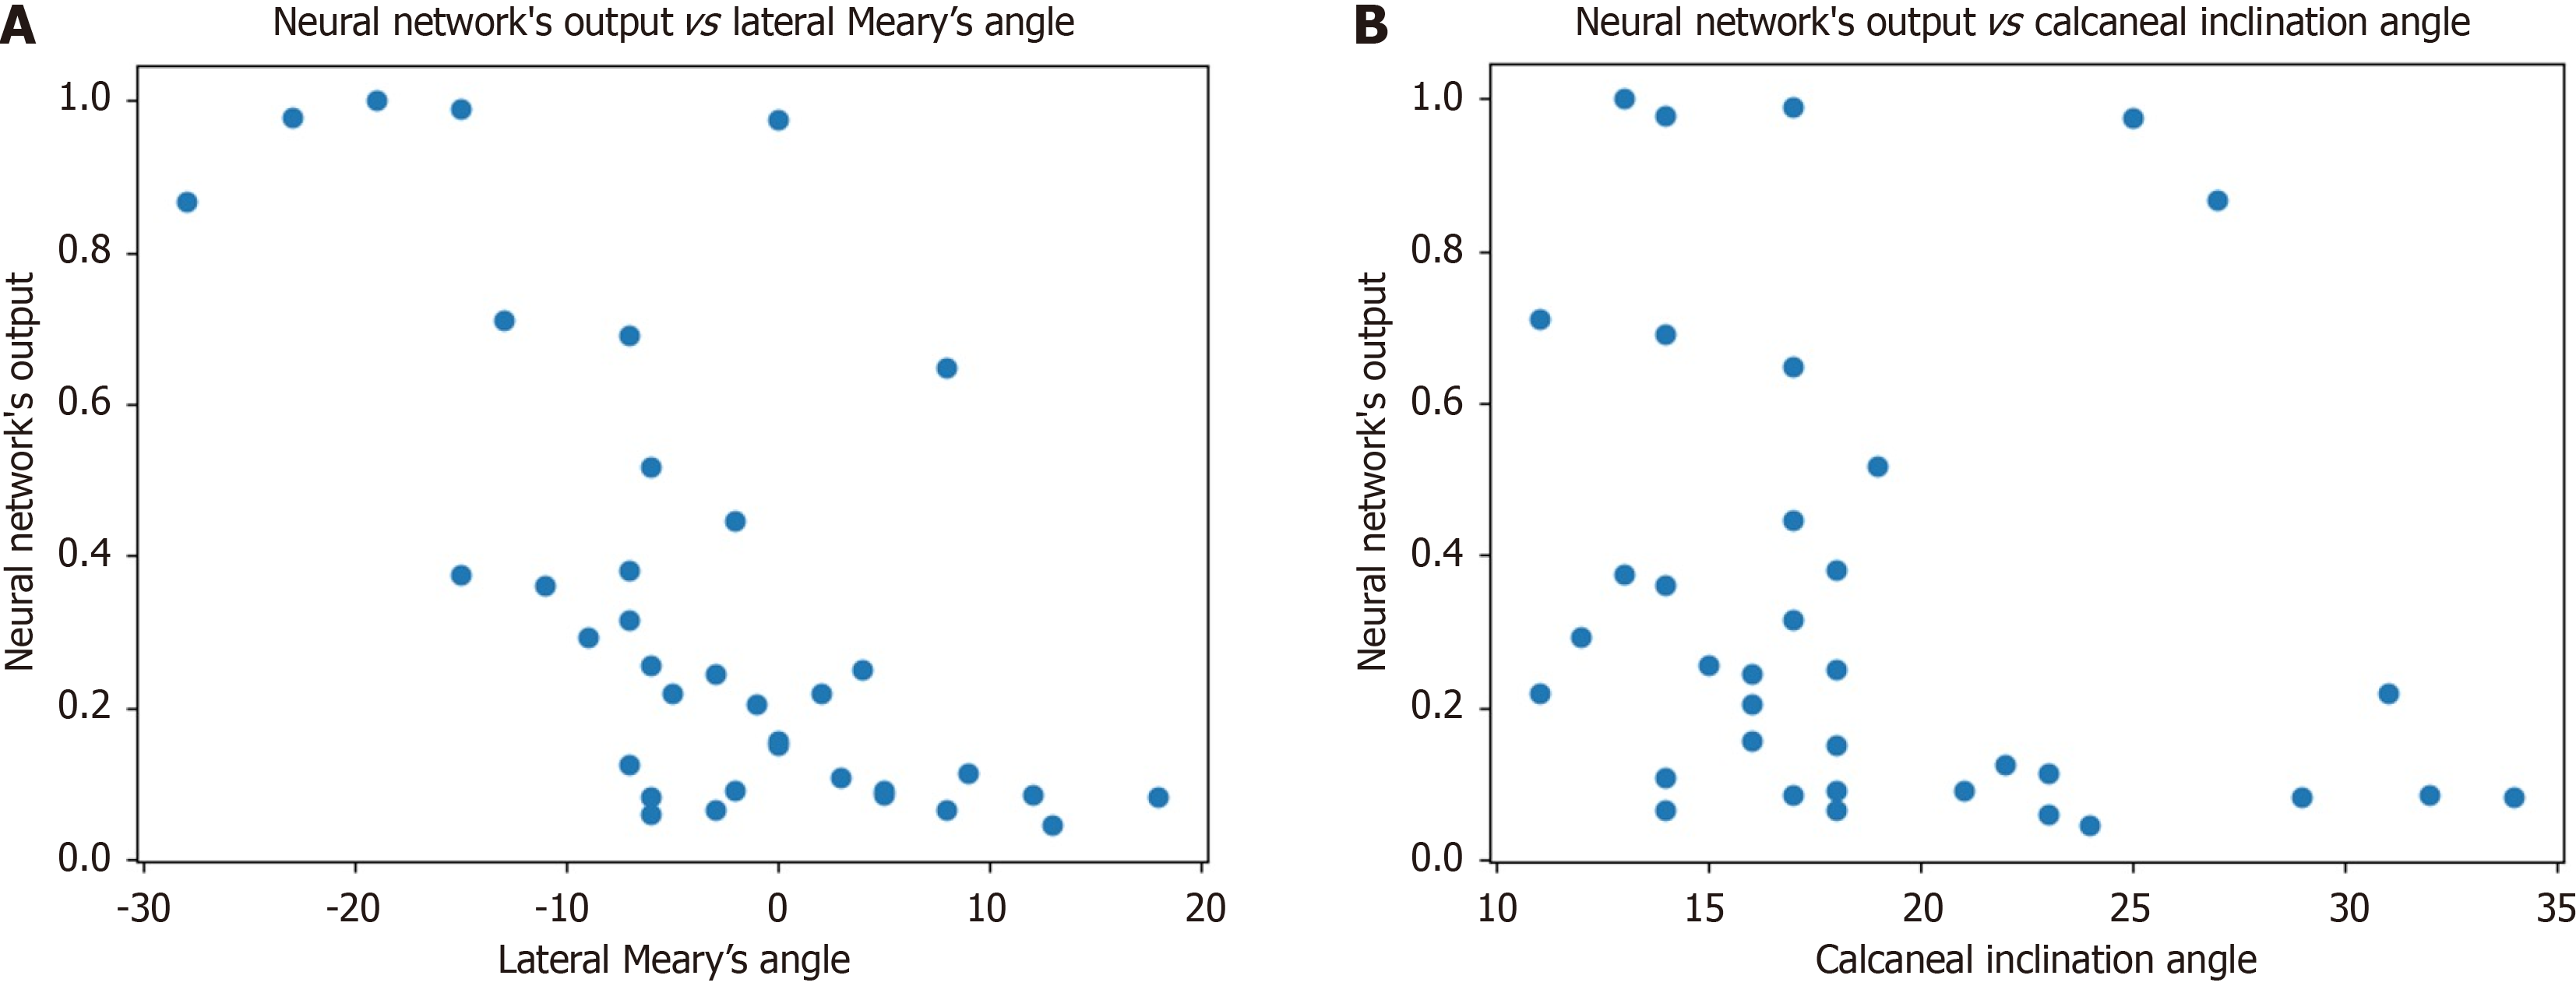
Figure 4 Cluster plot.
A: It showing the neural network's output when compared to lateral tarsal-first metatarsal angle, also known as lateral Meary’s angle; B: It showing the neural network's output when compared to calcaneal inclination angle.
- Citation: Ghandour S, Lebedev A, Tung WS, Semianov K, Semjanow A, DiGiovanni CW, Ashkani-Esfahani S, Pineda LB. Utilization of artificial intelligence in the diagnosis of pes planus and pes cavus with a smartphone camera. World J Orthop 2024; 15(12): 1146-1154
- URL: https://www.wjgnet.com/2218-5836/full/v15/i12/1146.htm
- DOI: https://dx.doi.org/10.5312/wjo.v15.i12.1146


