Copyright
©The Author(s) 2024.
World J Orthop. Nov 18, 2024; 15(11): 1075-1087
Published online Nov 18, 2024. doi: 10.5312/wjo.v15.i11.1075
Published online Nov 18, 2024. doi: 10.5312/wjo.v15.i11.1075
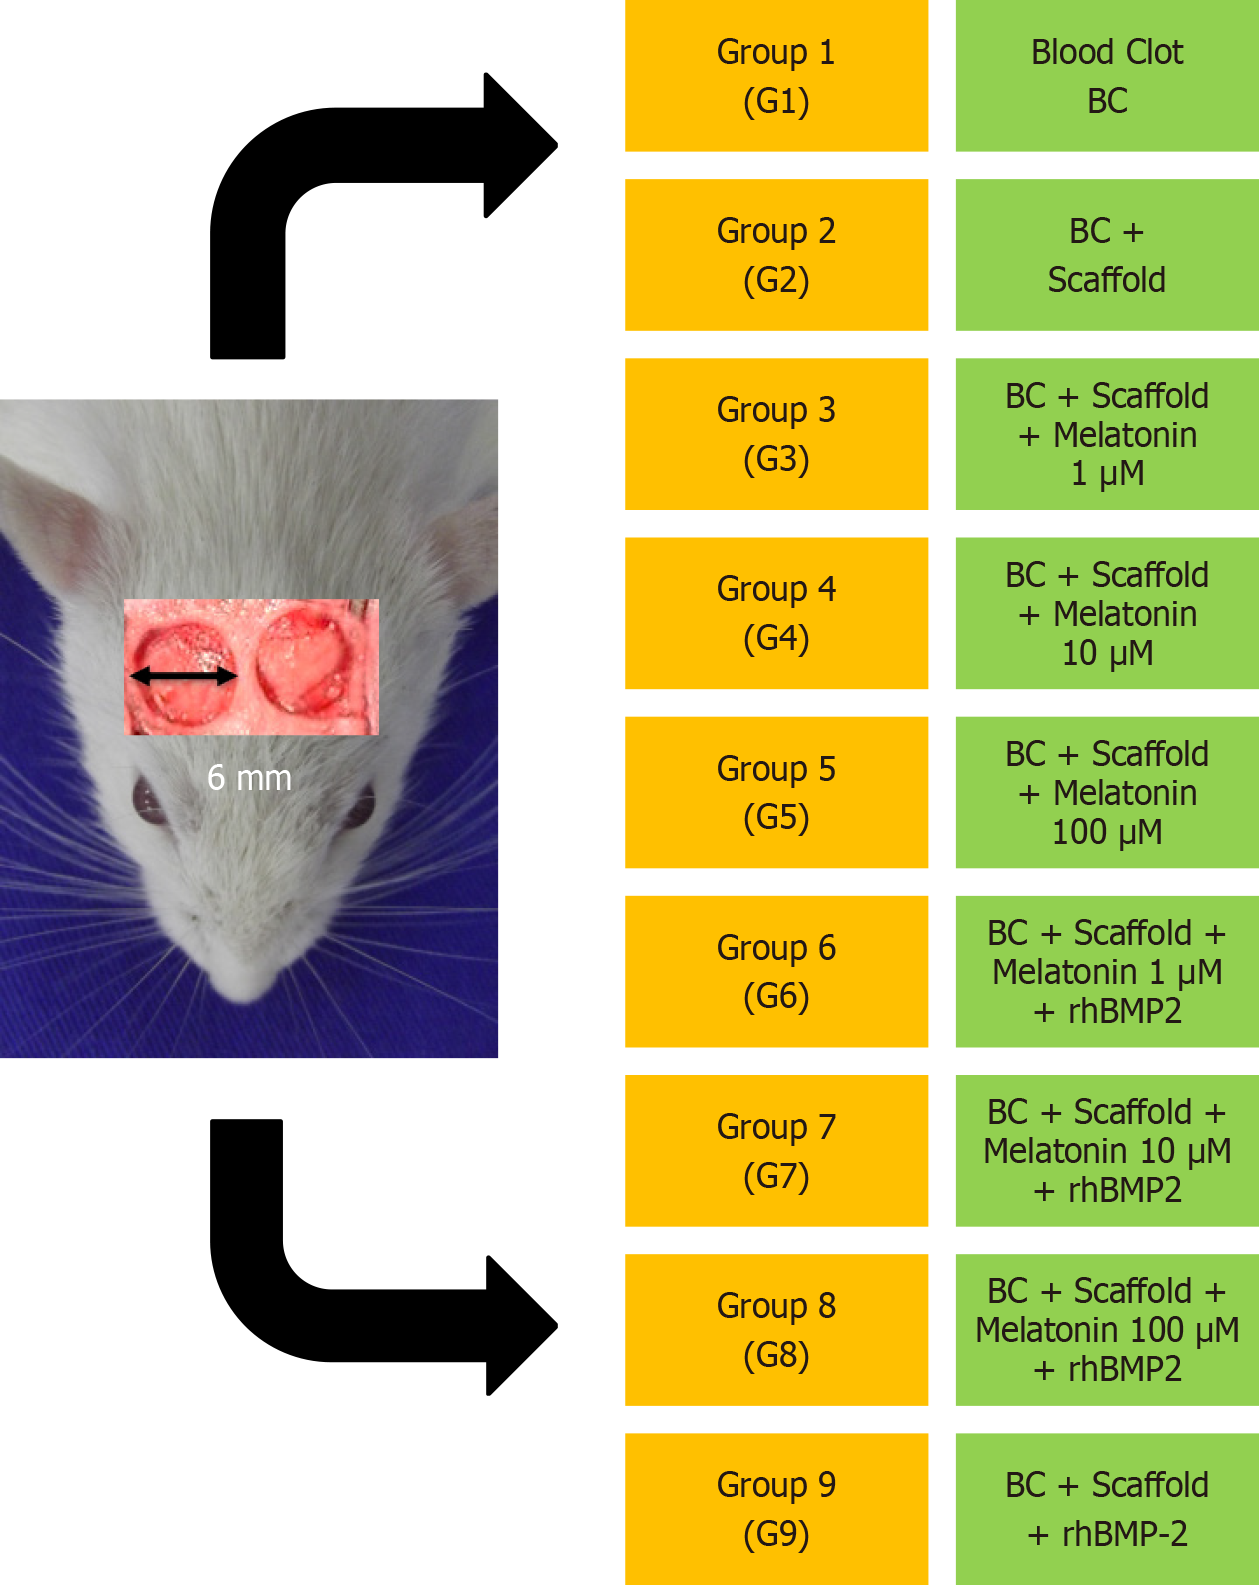
Figure 1 Schematic representation of the procedure for creating the defect in the calvarial bone.
The bone defects were created bilaterally, both equidistant from the median sagittal suture, using a 6 mm diameter trephine surgical drill.
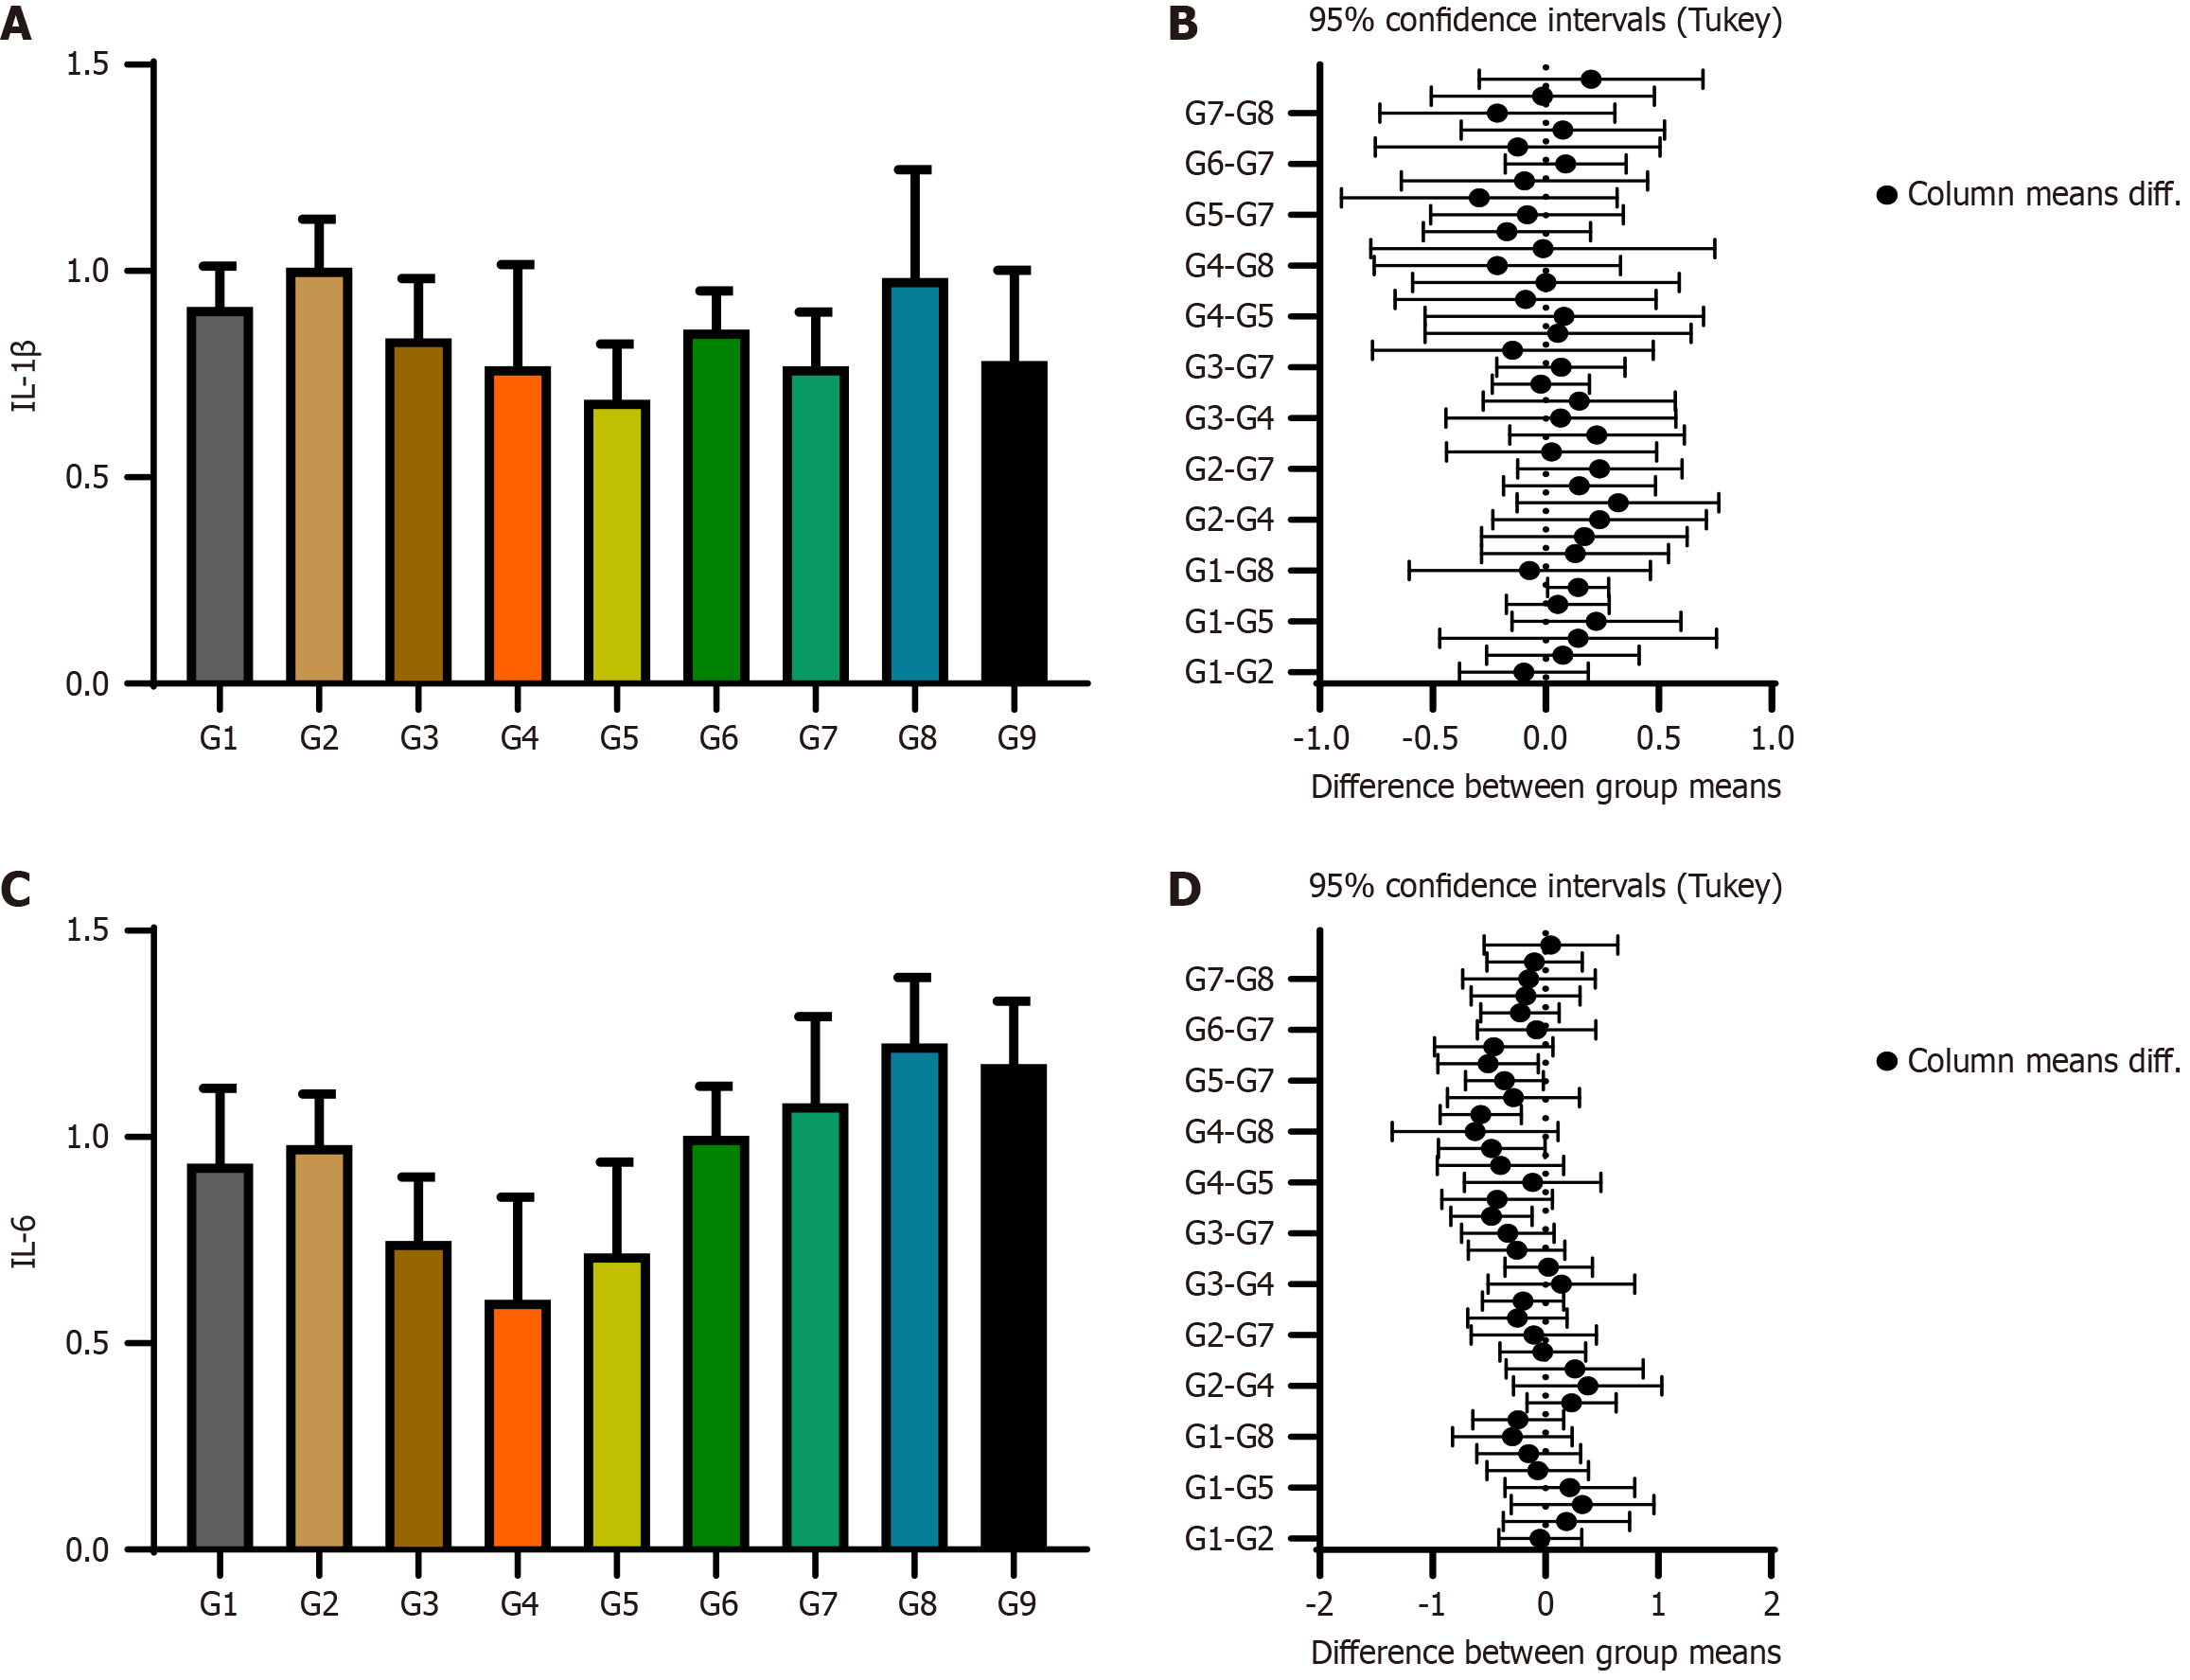
Figure 2 Expression of IL-1β and IL-6 genes.
A and B: Expression of IL-1β: Mean and standard deviation column graph with the confidence intervals in their respective groups (G1-G9); C and D: Expression of IL-6: Mean and standard deviation column graph with the confidence intervals in their respective groups (G1-G9). G1: Control; G2: Blood clot and Scaffold; G3: Blood clot + Scaffold + Melatonin 1 μg; G4: Blood clot + Scaffold + Melatonin 10 μg; G5: Blood clot + Scaffold + Melatonin 100 μg; G6: Blood clot + Scaffold + Melatonin 1 μg + rhBMP2; G7: Blood clot + Scaffold + Melatonin 10 μg + rhBMP2; G8: Blood clot + Scaffold + Melatonin 100 μg + rhBMP2; G9: Blood clot + Scaffold + rhBMP2.
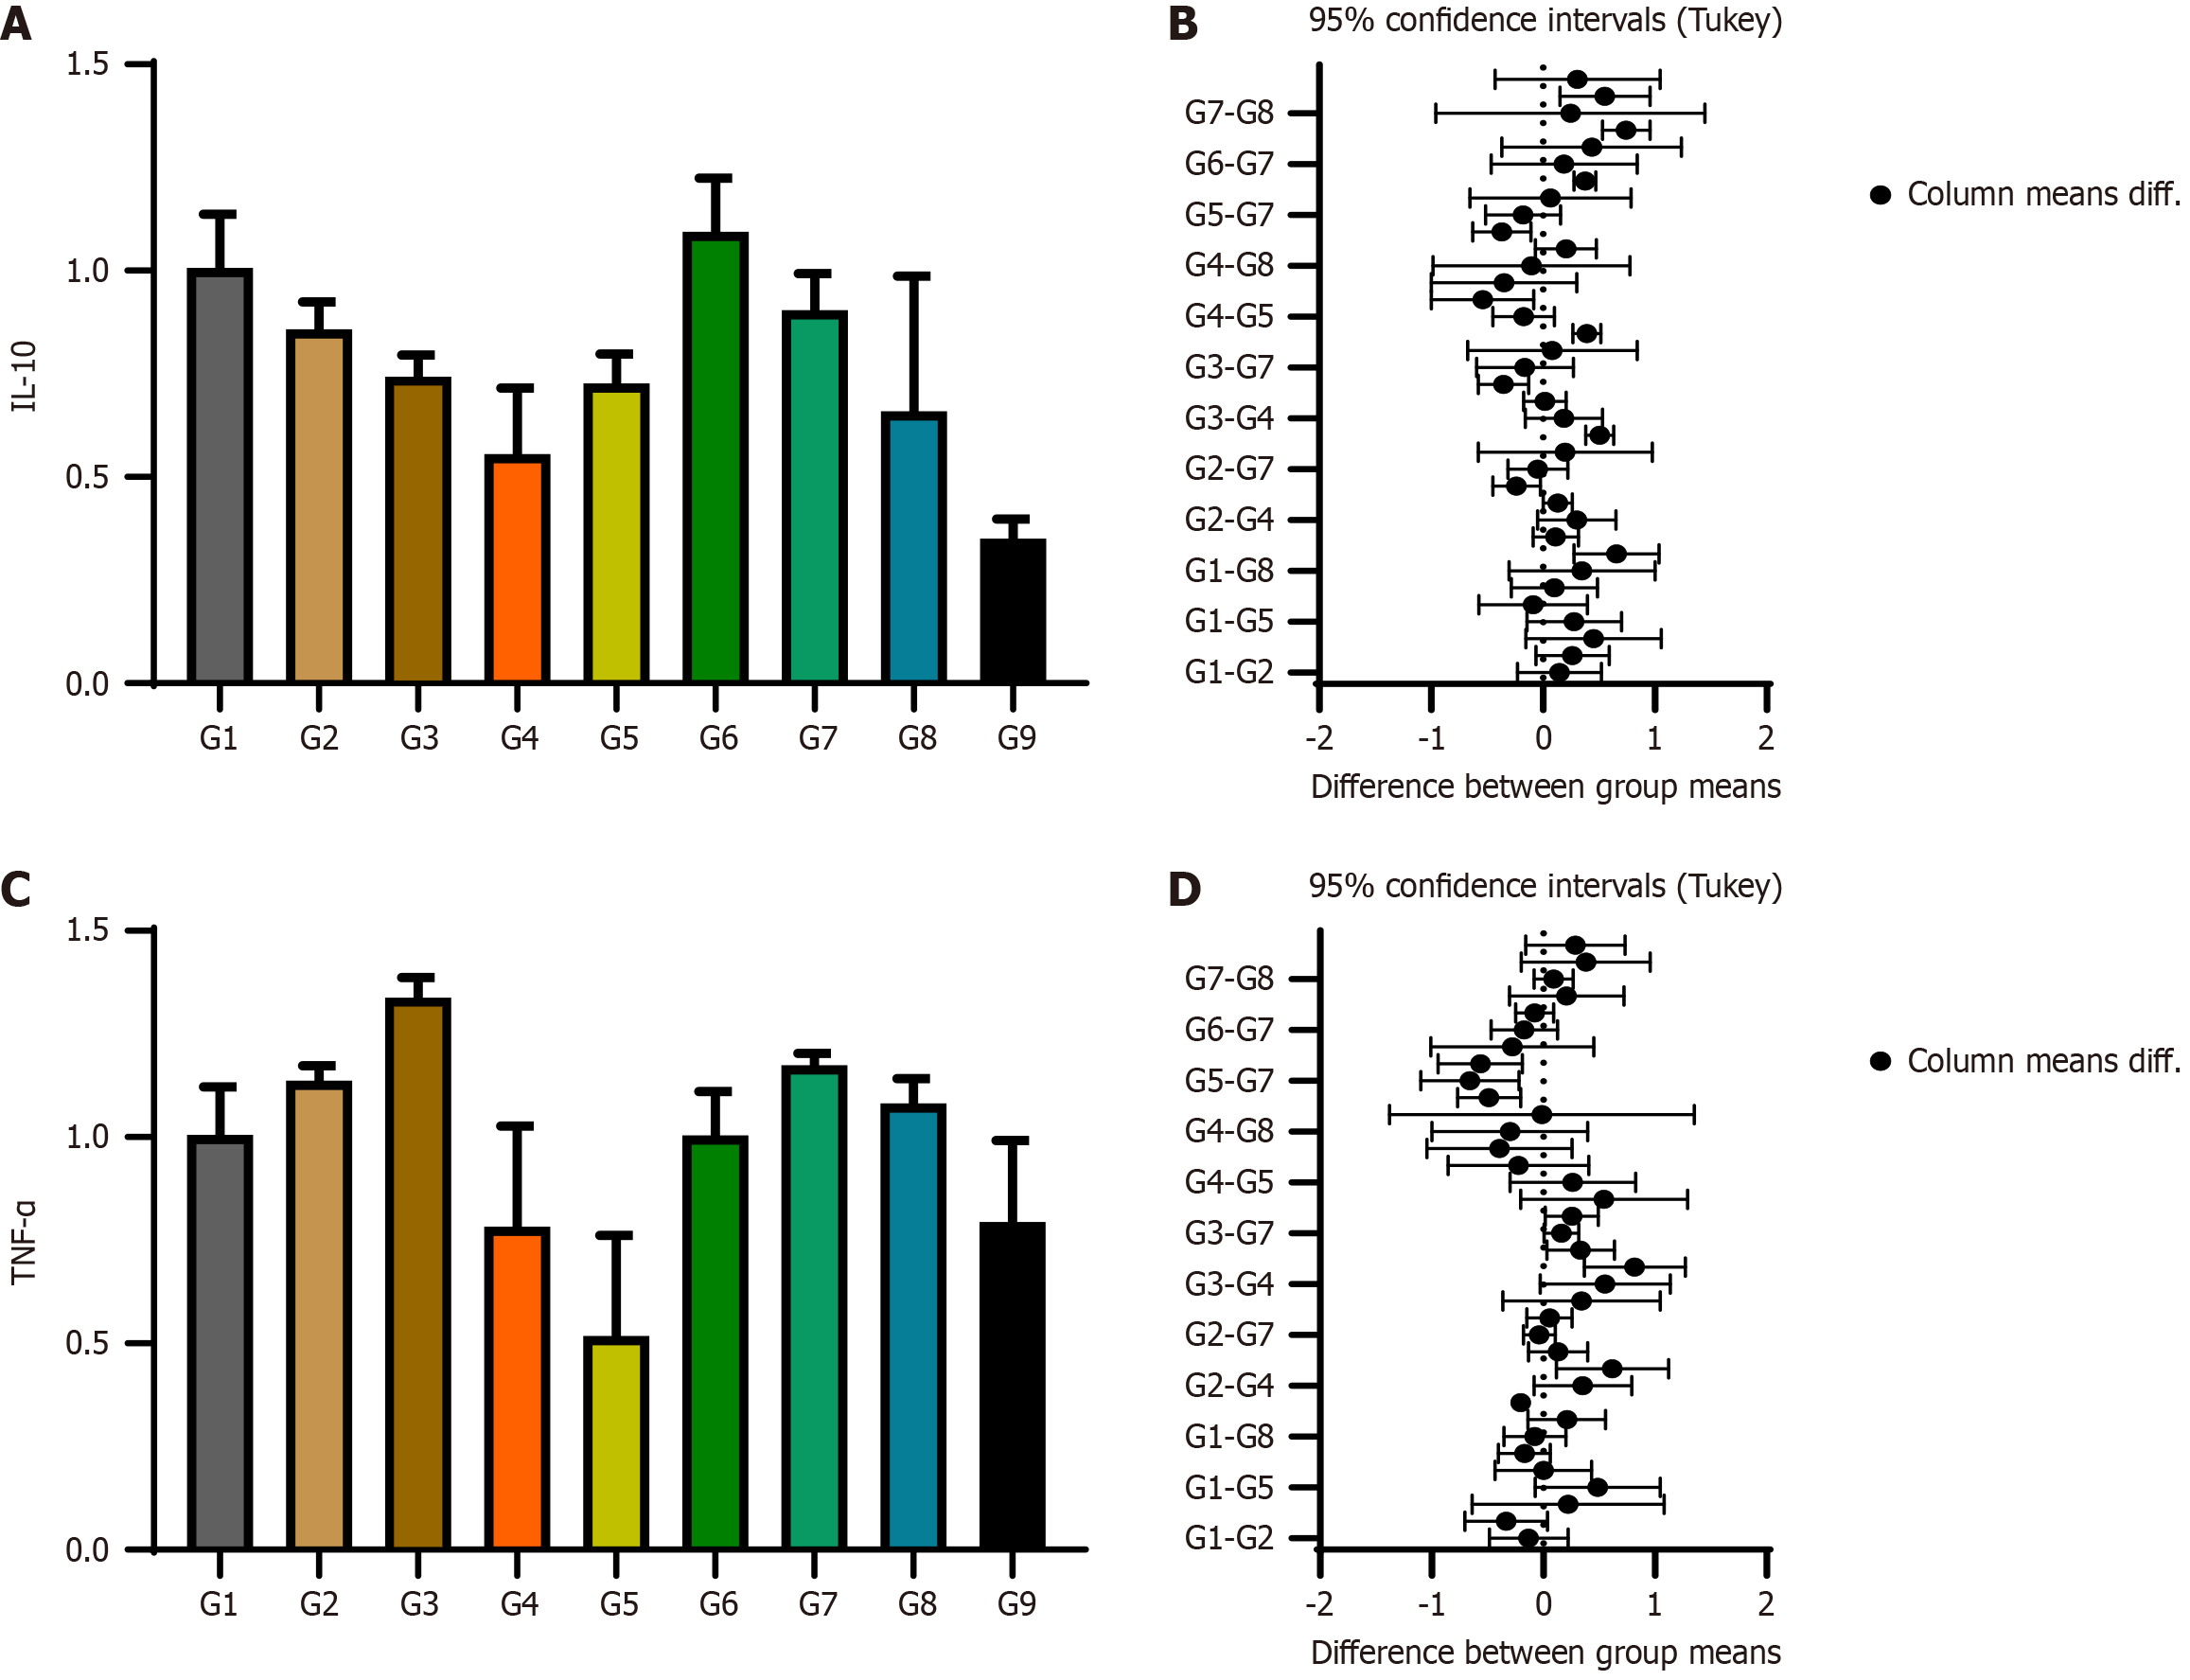
Figure 3 Expression of IL-10 and TNF-α genes.
A and B: Expression of IL-10: Mean and standard deviation column graph with the confidence intervals in their respective groups (G1-G9); C and D: Expression of TNF-α: Mean and standard deviation column graph with the confidence intervals in their respective groups (G1-G9). G1: Control; G2: Blood clot and Scaffold; G3: Blood clot + Scaffold + Melatonin 1 μg; G4: Blood clot + Scaffold + Melatonin 10 μg; G5: Blood clot + Scaffold + Melatonin 100 μg; G6: Blood clot + Scaffold + Melatonin 1 μg + rhBMP2; G7: Blood clot + Scaffold + Melatonin 10 μg + rhBMP2; G8: Blood clot + Scaffold + Melatonin 100 μg + rhBMP2; G9: Blood clot + Scaffold + rhBMP2.
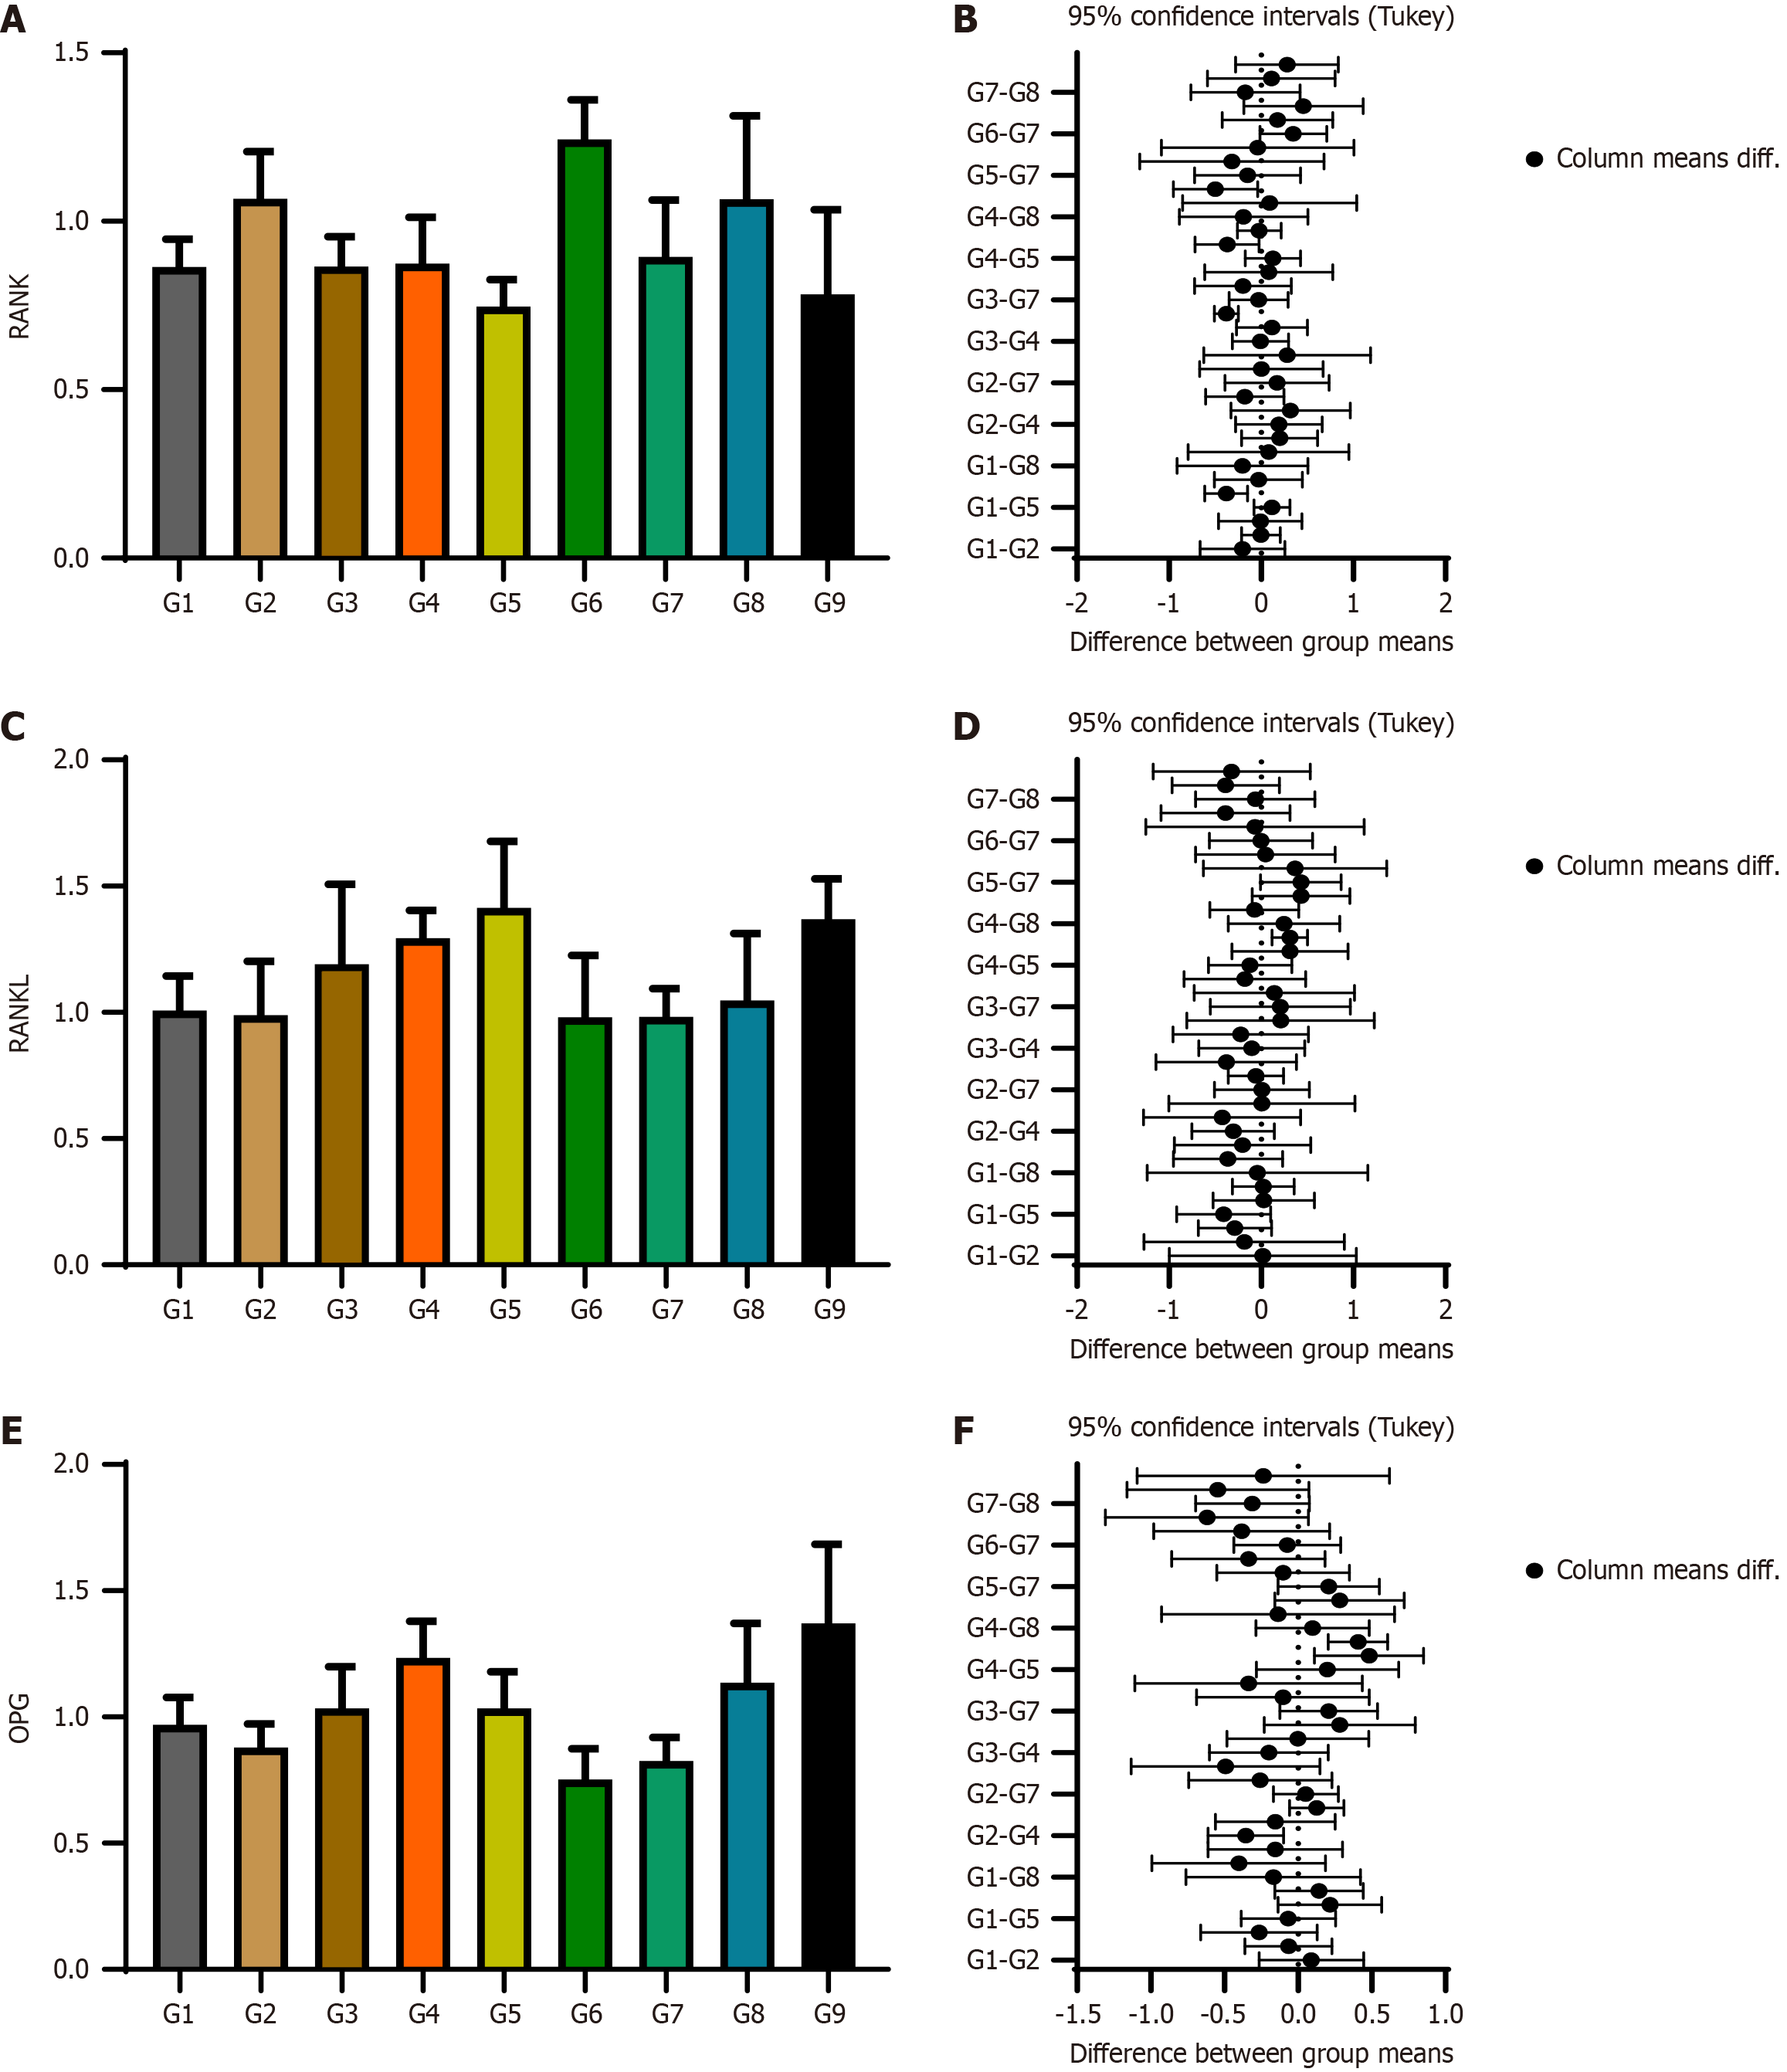
Figure 4 Expression of RANK, RANKL and OPG markers.
A and B: Expression of RANK: Mean and standard deviation column graph with the confidence intervals in their respective groups (G1-G9); C and D: Expression of RANKL: Mean and standard deviation column graph with the confidence intervals in their respective groups (G1-G9); E and F: Expression of OPG: Mean and standard deviation column graph with the confidence intervals in their respective groups (G1-G9). G1: Control; G2: Blood clot and Scaffold; G3: Blood clot + Scaffold + Melatonin 1 μg; G4: Blood clot + Scaffold + Melatonin 10 μg; G5: Blood clot + Scaffold + Melatonin 100 μg; G6: Blood clot + Scaffold + Melatonin 1 μg + rhBMP2; G7: Blood clot + Scaffold + Melatonin 10 μg + rhBMP2; G8: Blood clot + Scaffold + Melatonin 100 μg + rhBMP2; G9: Blood clot + Scaffold + rhBMP2.
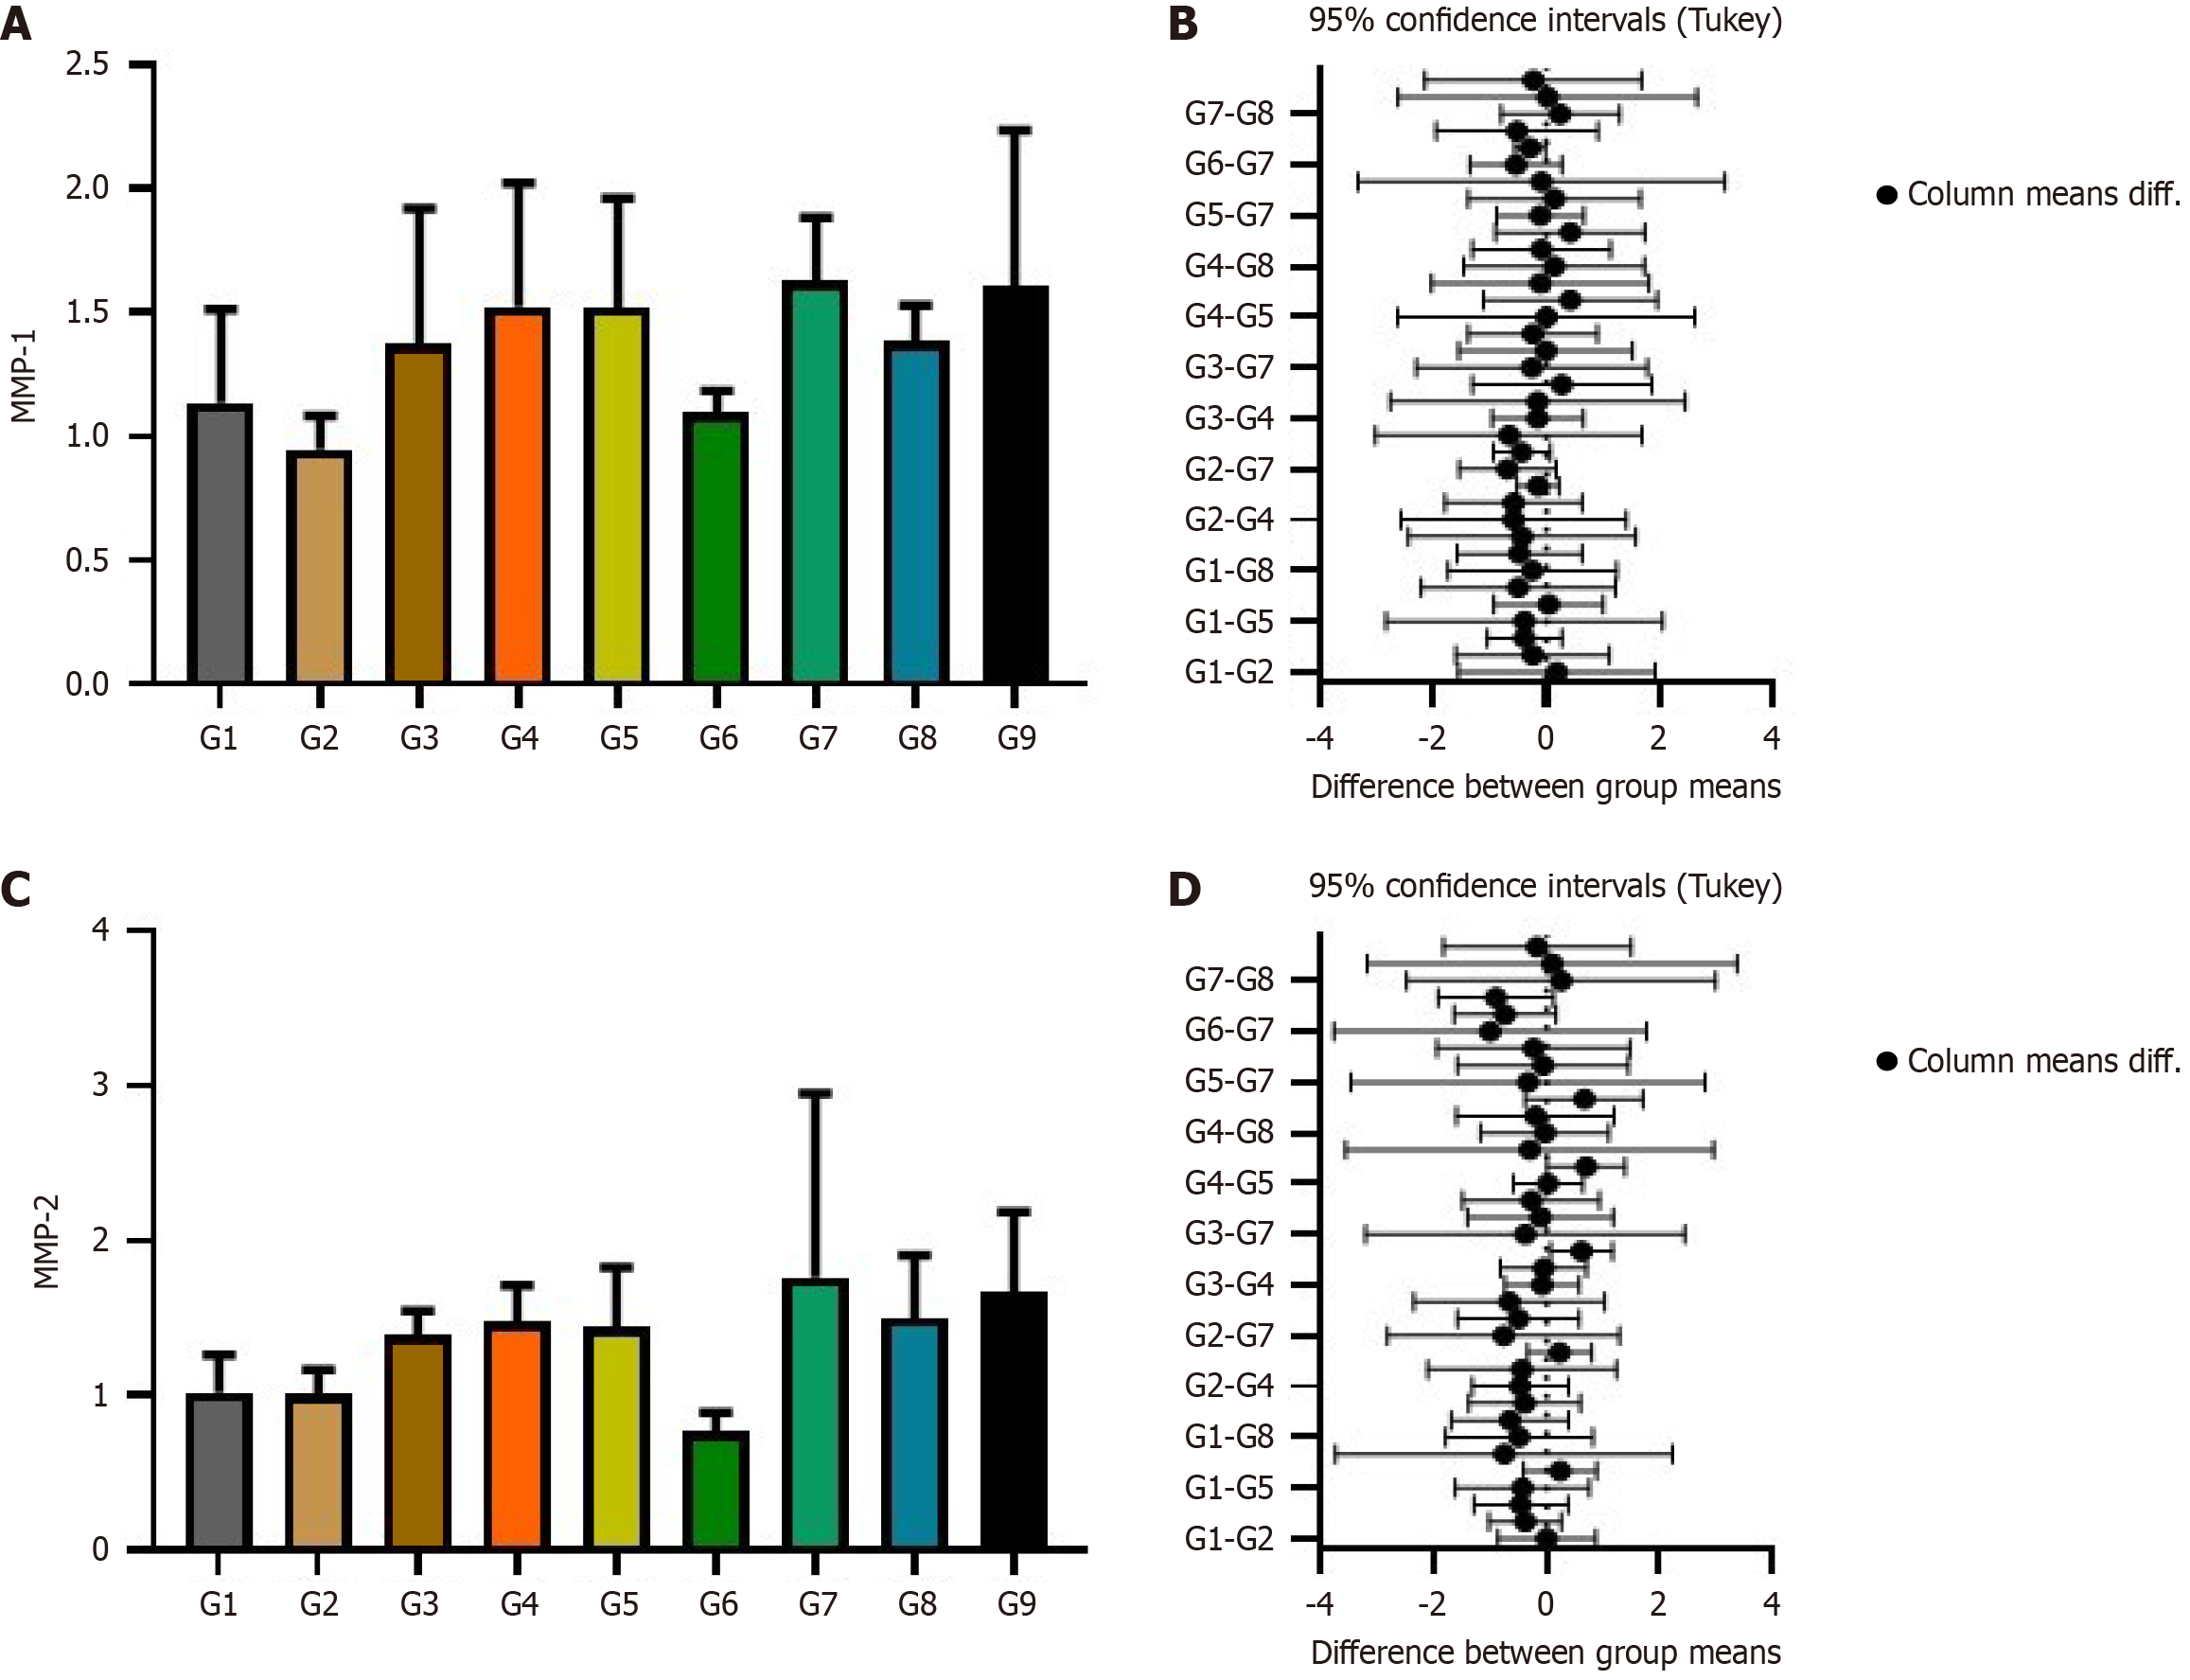
Figure 5 Expression of MMP-1 and MMP-2 markers.
A and B: Expression of MMP-1: Mean and standard deviation column graph with the confidence intervals in their respective groups (G1-G9); C and D: Expression of MMP-2: Mean and standard deviation column graph with the confidence intervals in their respective groups (G1-G9). G1: Control; G2: Blood clot and Scaffold; G3: Blood clot + Scaffold + Melatonin 1 μg; G4: Blood clot + Scaffold + Melatonin 10 μg; G5: Blood clot + Scaffold + Melatonin 100 μg; G6: Blood clot + Scaffold + Melatonin 1 μg + rhBMP2; G7: Blood clot + Scaffold + Melatonin 10 μg + rhBMP2; G8: Blood clot + Scaffold + Melatonin 100 μg + rhBMP2; G9: Blood clot + Scaffold + rhBMP2.
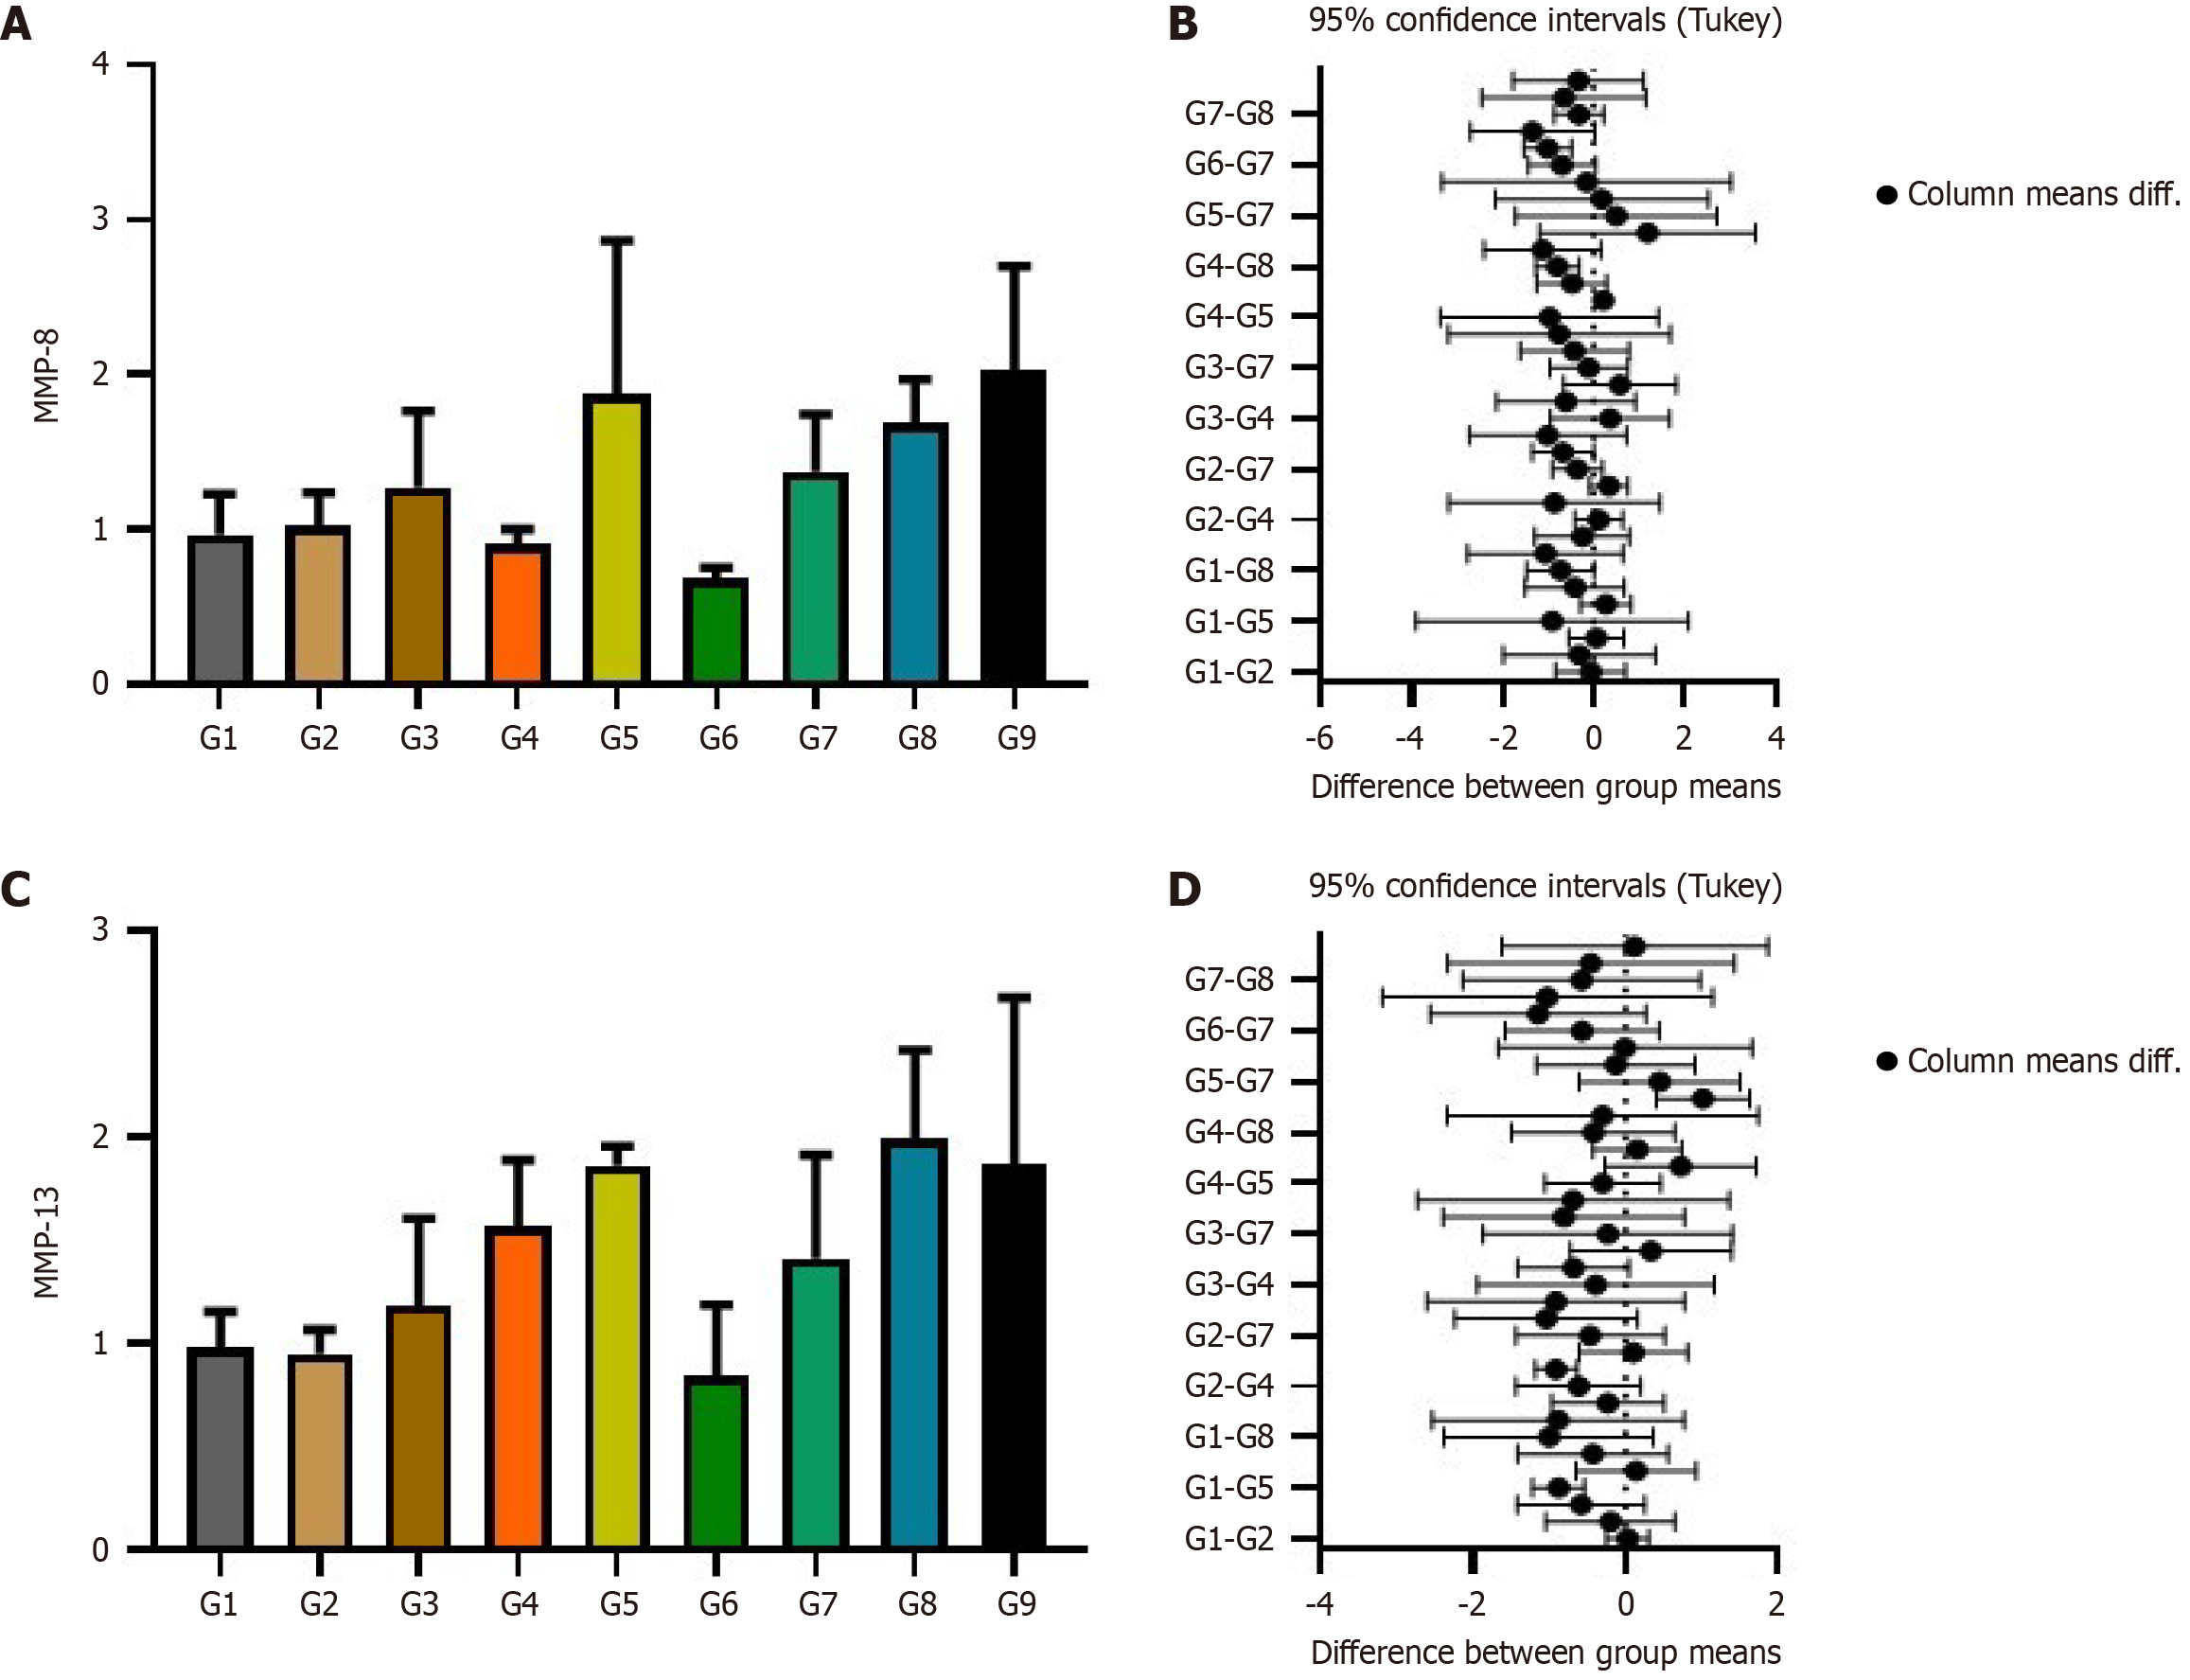
Figure 6 Expression of MMP-8 and MMP-13 markers.
A and B: Expression of MMP-8: Mean and standard deviation column graph with the confidence intervals in their respective groups (G1-G9); C and D: Expression of MMP-13: Mean and standard deviation column graph with the confidence intervals in their respective groups (G1-G9). G1: Control; G2: Blood clot and Scaffold; G3: Blood clot + Scaffold + Melatonin 1 μg; G4: Blood clot + Scaffold + Melatonin 10 μg; G5: Blood clot + Scaffold + Melatonin 100 μg; G6: Blood clot + Scaffold + Melatonin 1 μg + rhBMP2; G7: Blood clot + Scaffold + Melatonin 10 μg + rhBMP2; G8: Blood clot + Scaffold + Melatonin 100 μg + rhBMP2; G9: Blood clot + Scaffold + rhBMP2.
- Citation: Paulini MR, Montarele LF, Pitol DL, Giannocco G, Pereira BF, Buchaim DV, Reis CHB, Buchaim RL, Mardegan Issa JP. Gene expression analysis of cytokines and MMPs in melatonin and rhBMP-2 enhanced bone remodeling. World J Orthop 2024; 15(11): 1075-1087
- URL: https://www.wjgnet.com/2218-5836/full/v15/i11/1075.htm
- DOI: https://dx.doi.org/10.5312/wjo.v15.i11.1075


