Copyright
©The Author(s) 2024.
World J Orthop. Oct 18, 2024; 15(10): 939-949
Published online Oct 18, 2024. doi: 10.5312/wjo.v15.i10.939
Published online Oct 18, 2024. doi: 10.5312/wjo.v15.i10.939
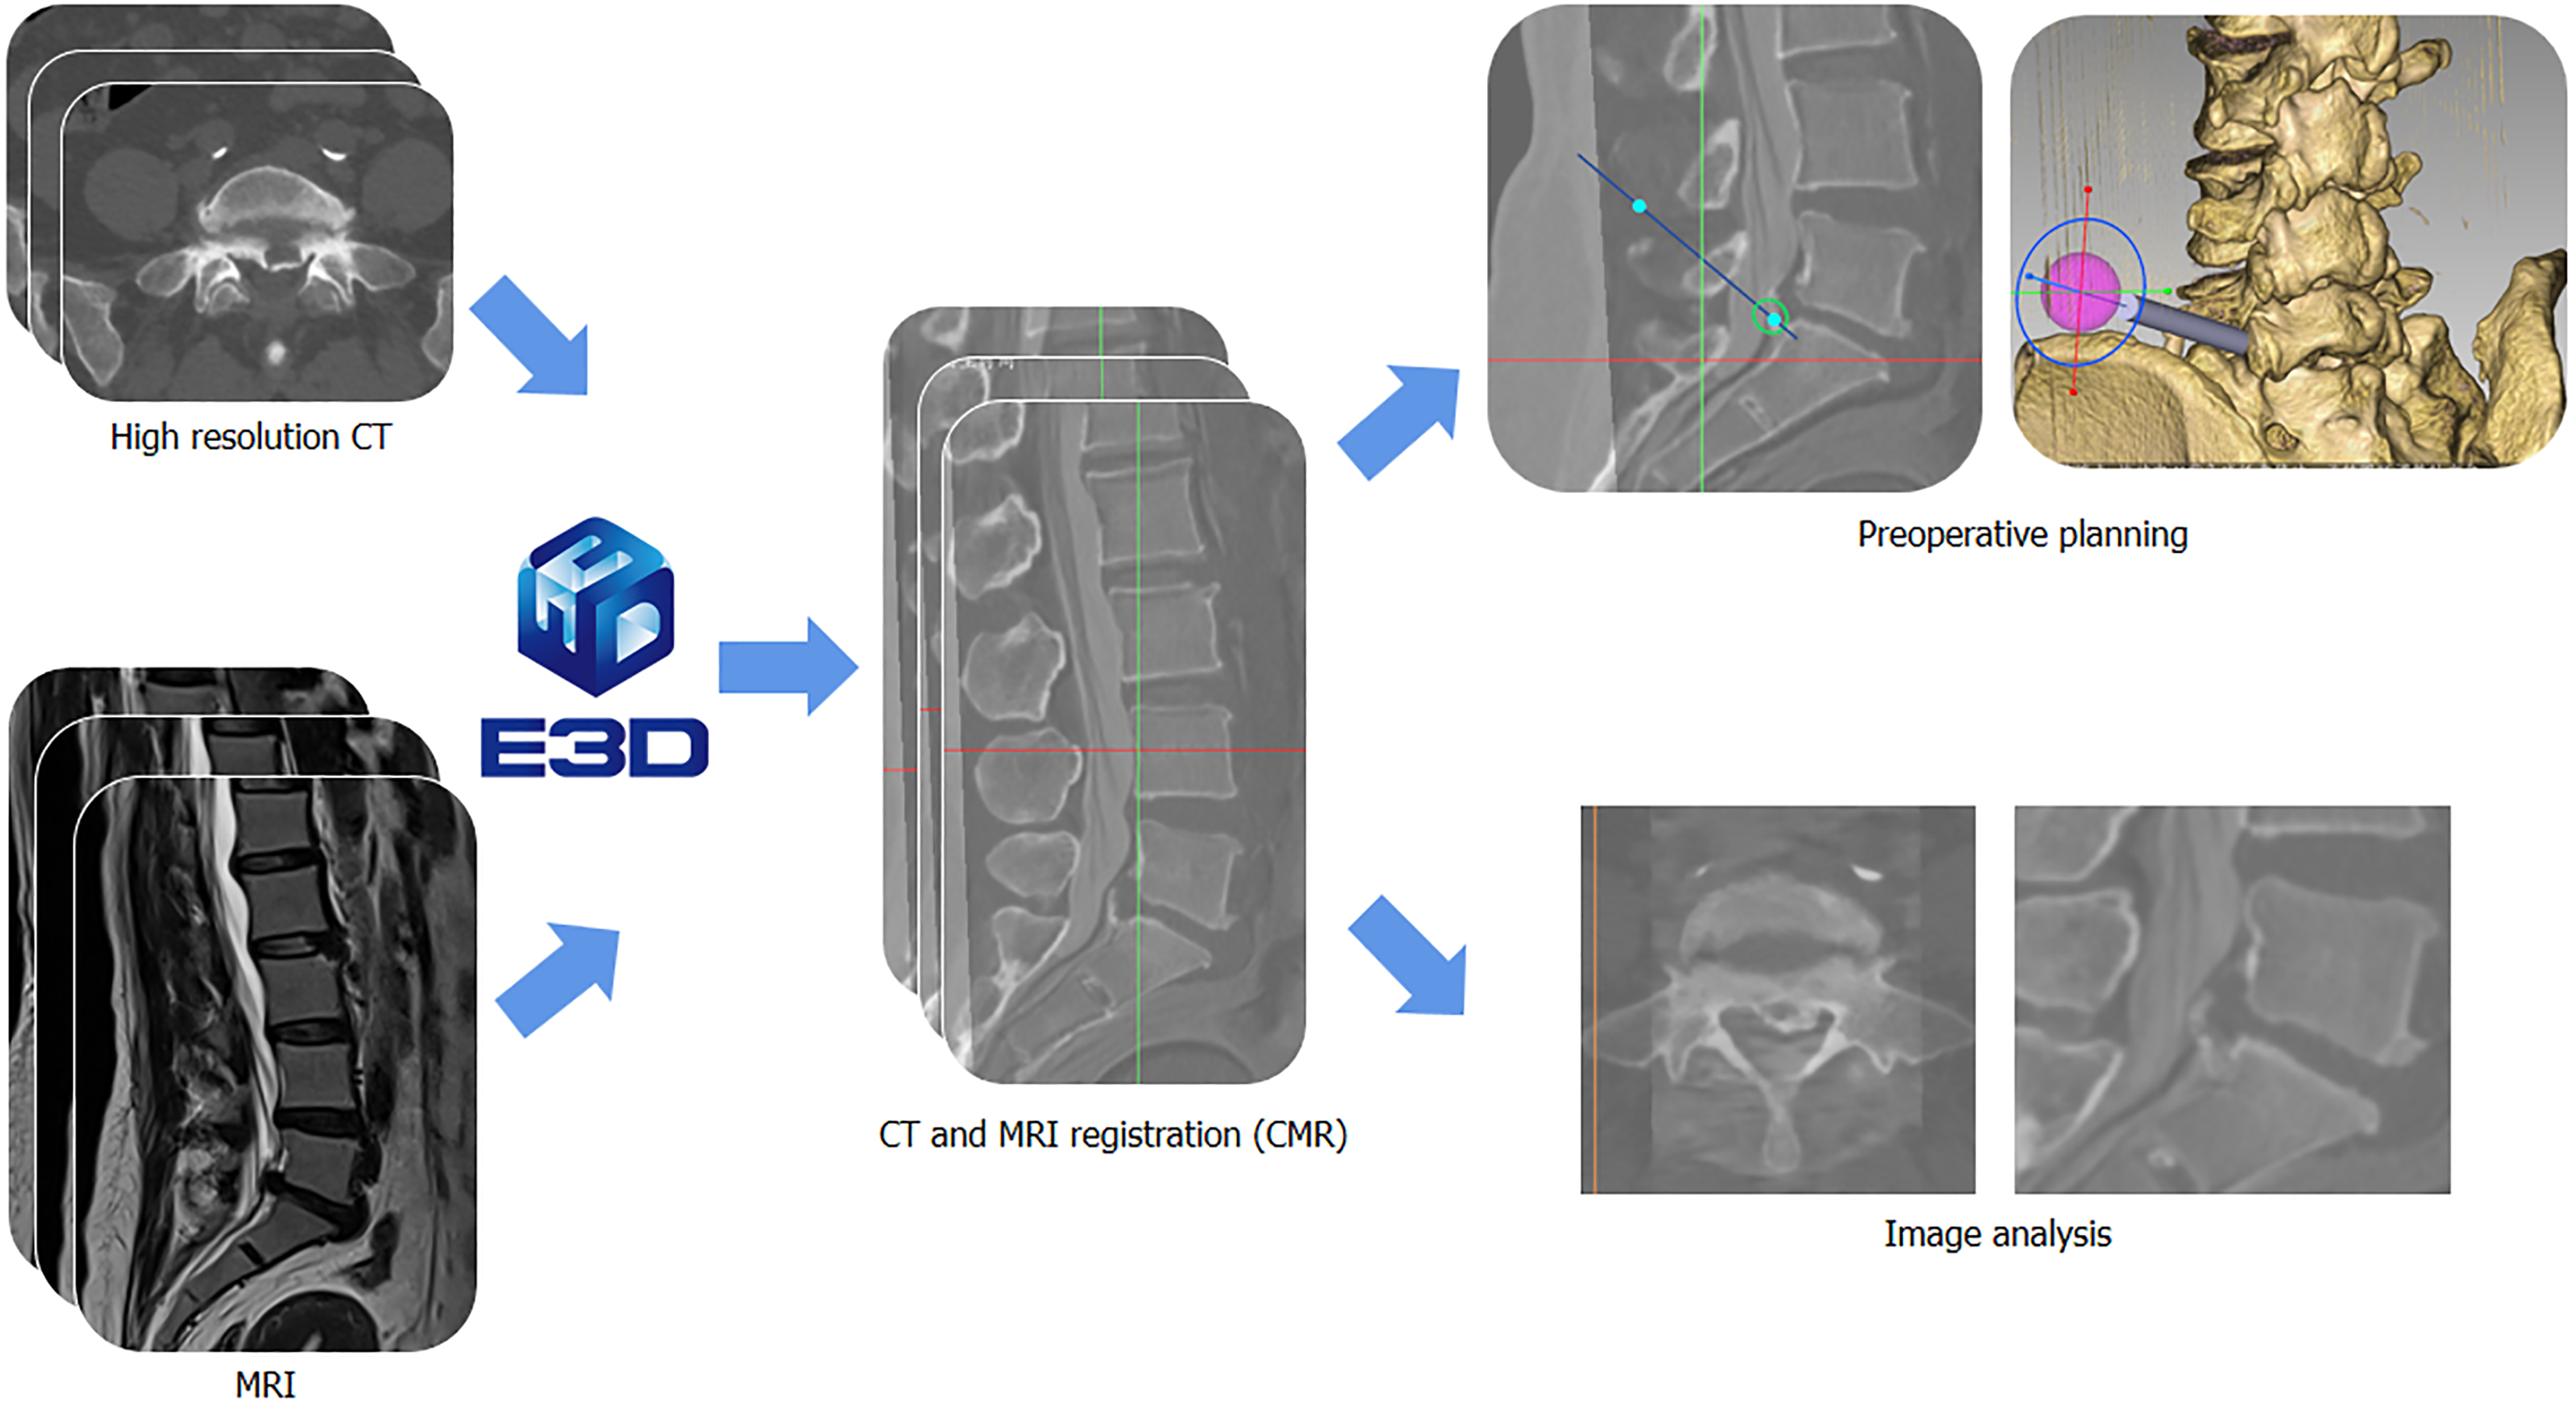
Figure 1 Flowchart of computed tomography/magnetic resonance imaging registration.
MRI: Magnetic resonance imaging; CT: Computed tomography; CMR: Computed tomography and magnetic resonance imaging registration.
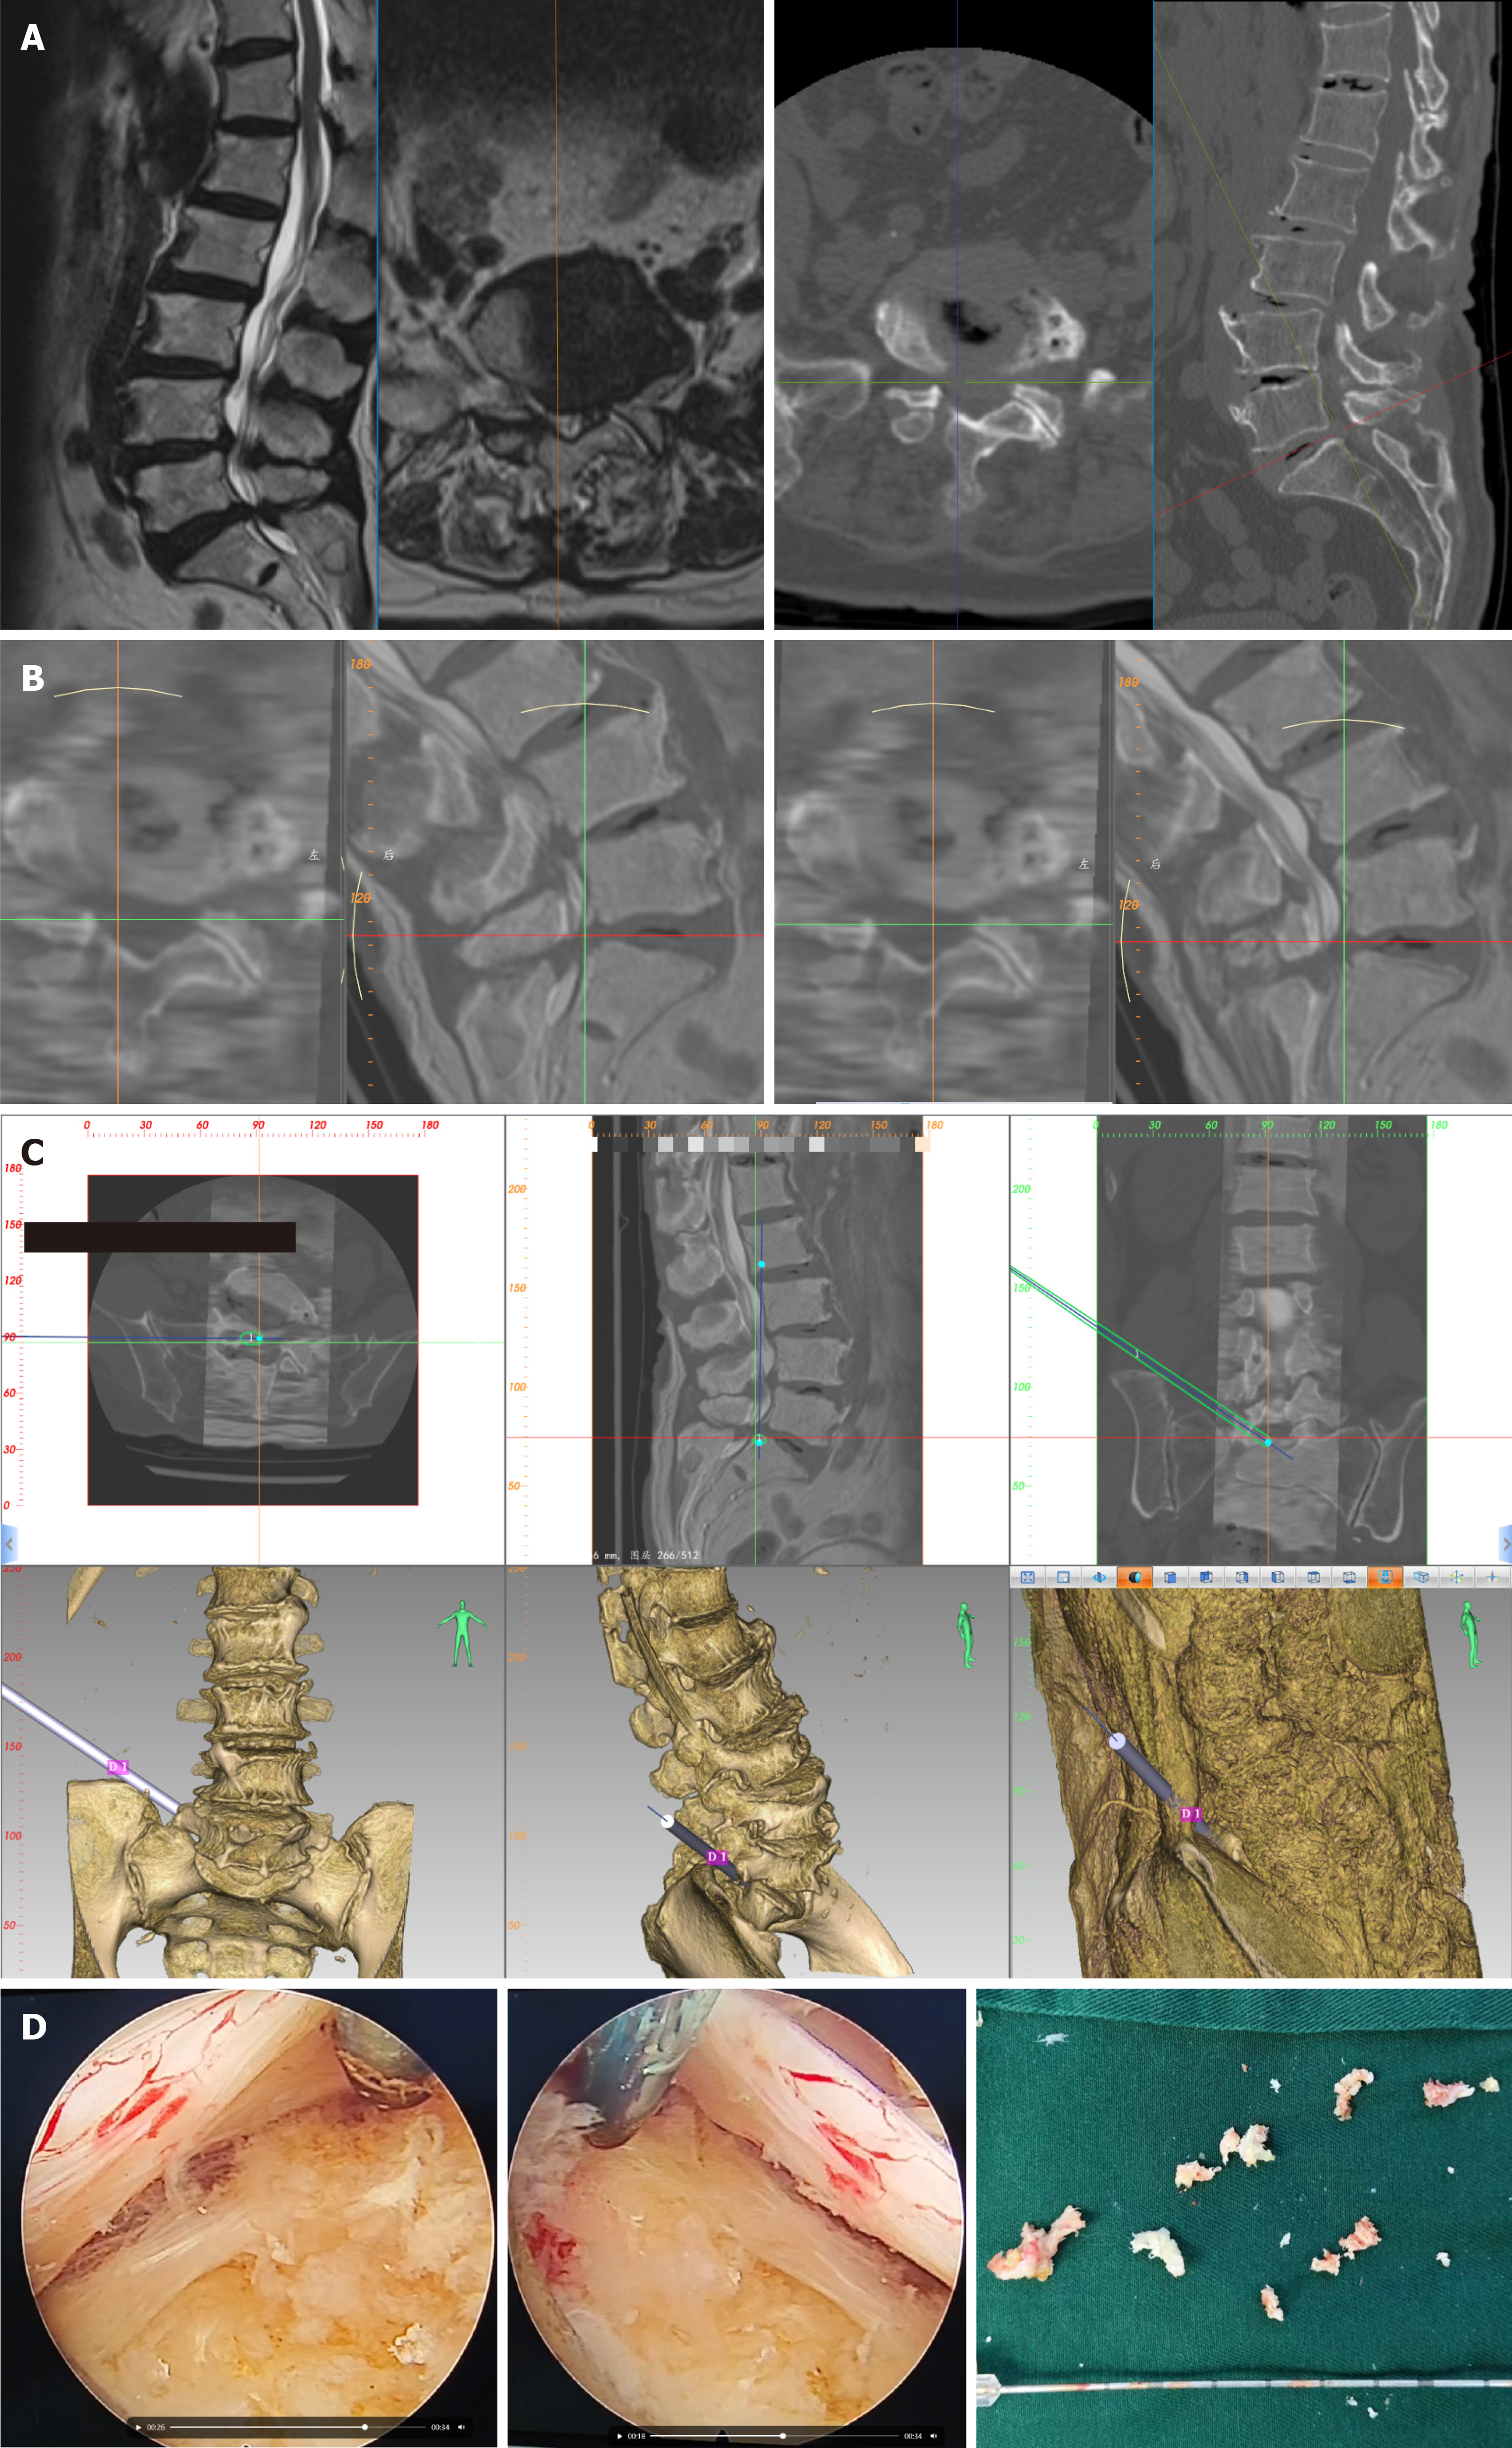
Figure 2 Typical case 1.
A: Magnetic resonance imaging and computed tomography images showing lumbar spine stenosis (L5/S1); B: Computed tomography (CT)/magnetic resonance imaging registration image showing compression of the S1 nerve by its ventral intervertebral disc; C: Based on the compression site, a working cannula was simulated on the three-dimensional CT reconstruction image; D: Endoscopic images showing complete release of the nerves and spinal cord, and photograph showing the extracted intervertebral disc tissue.
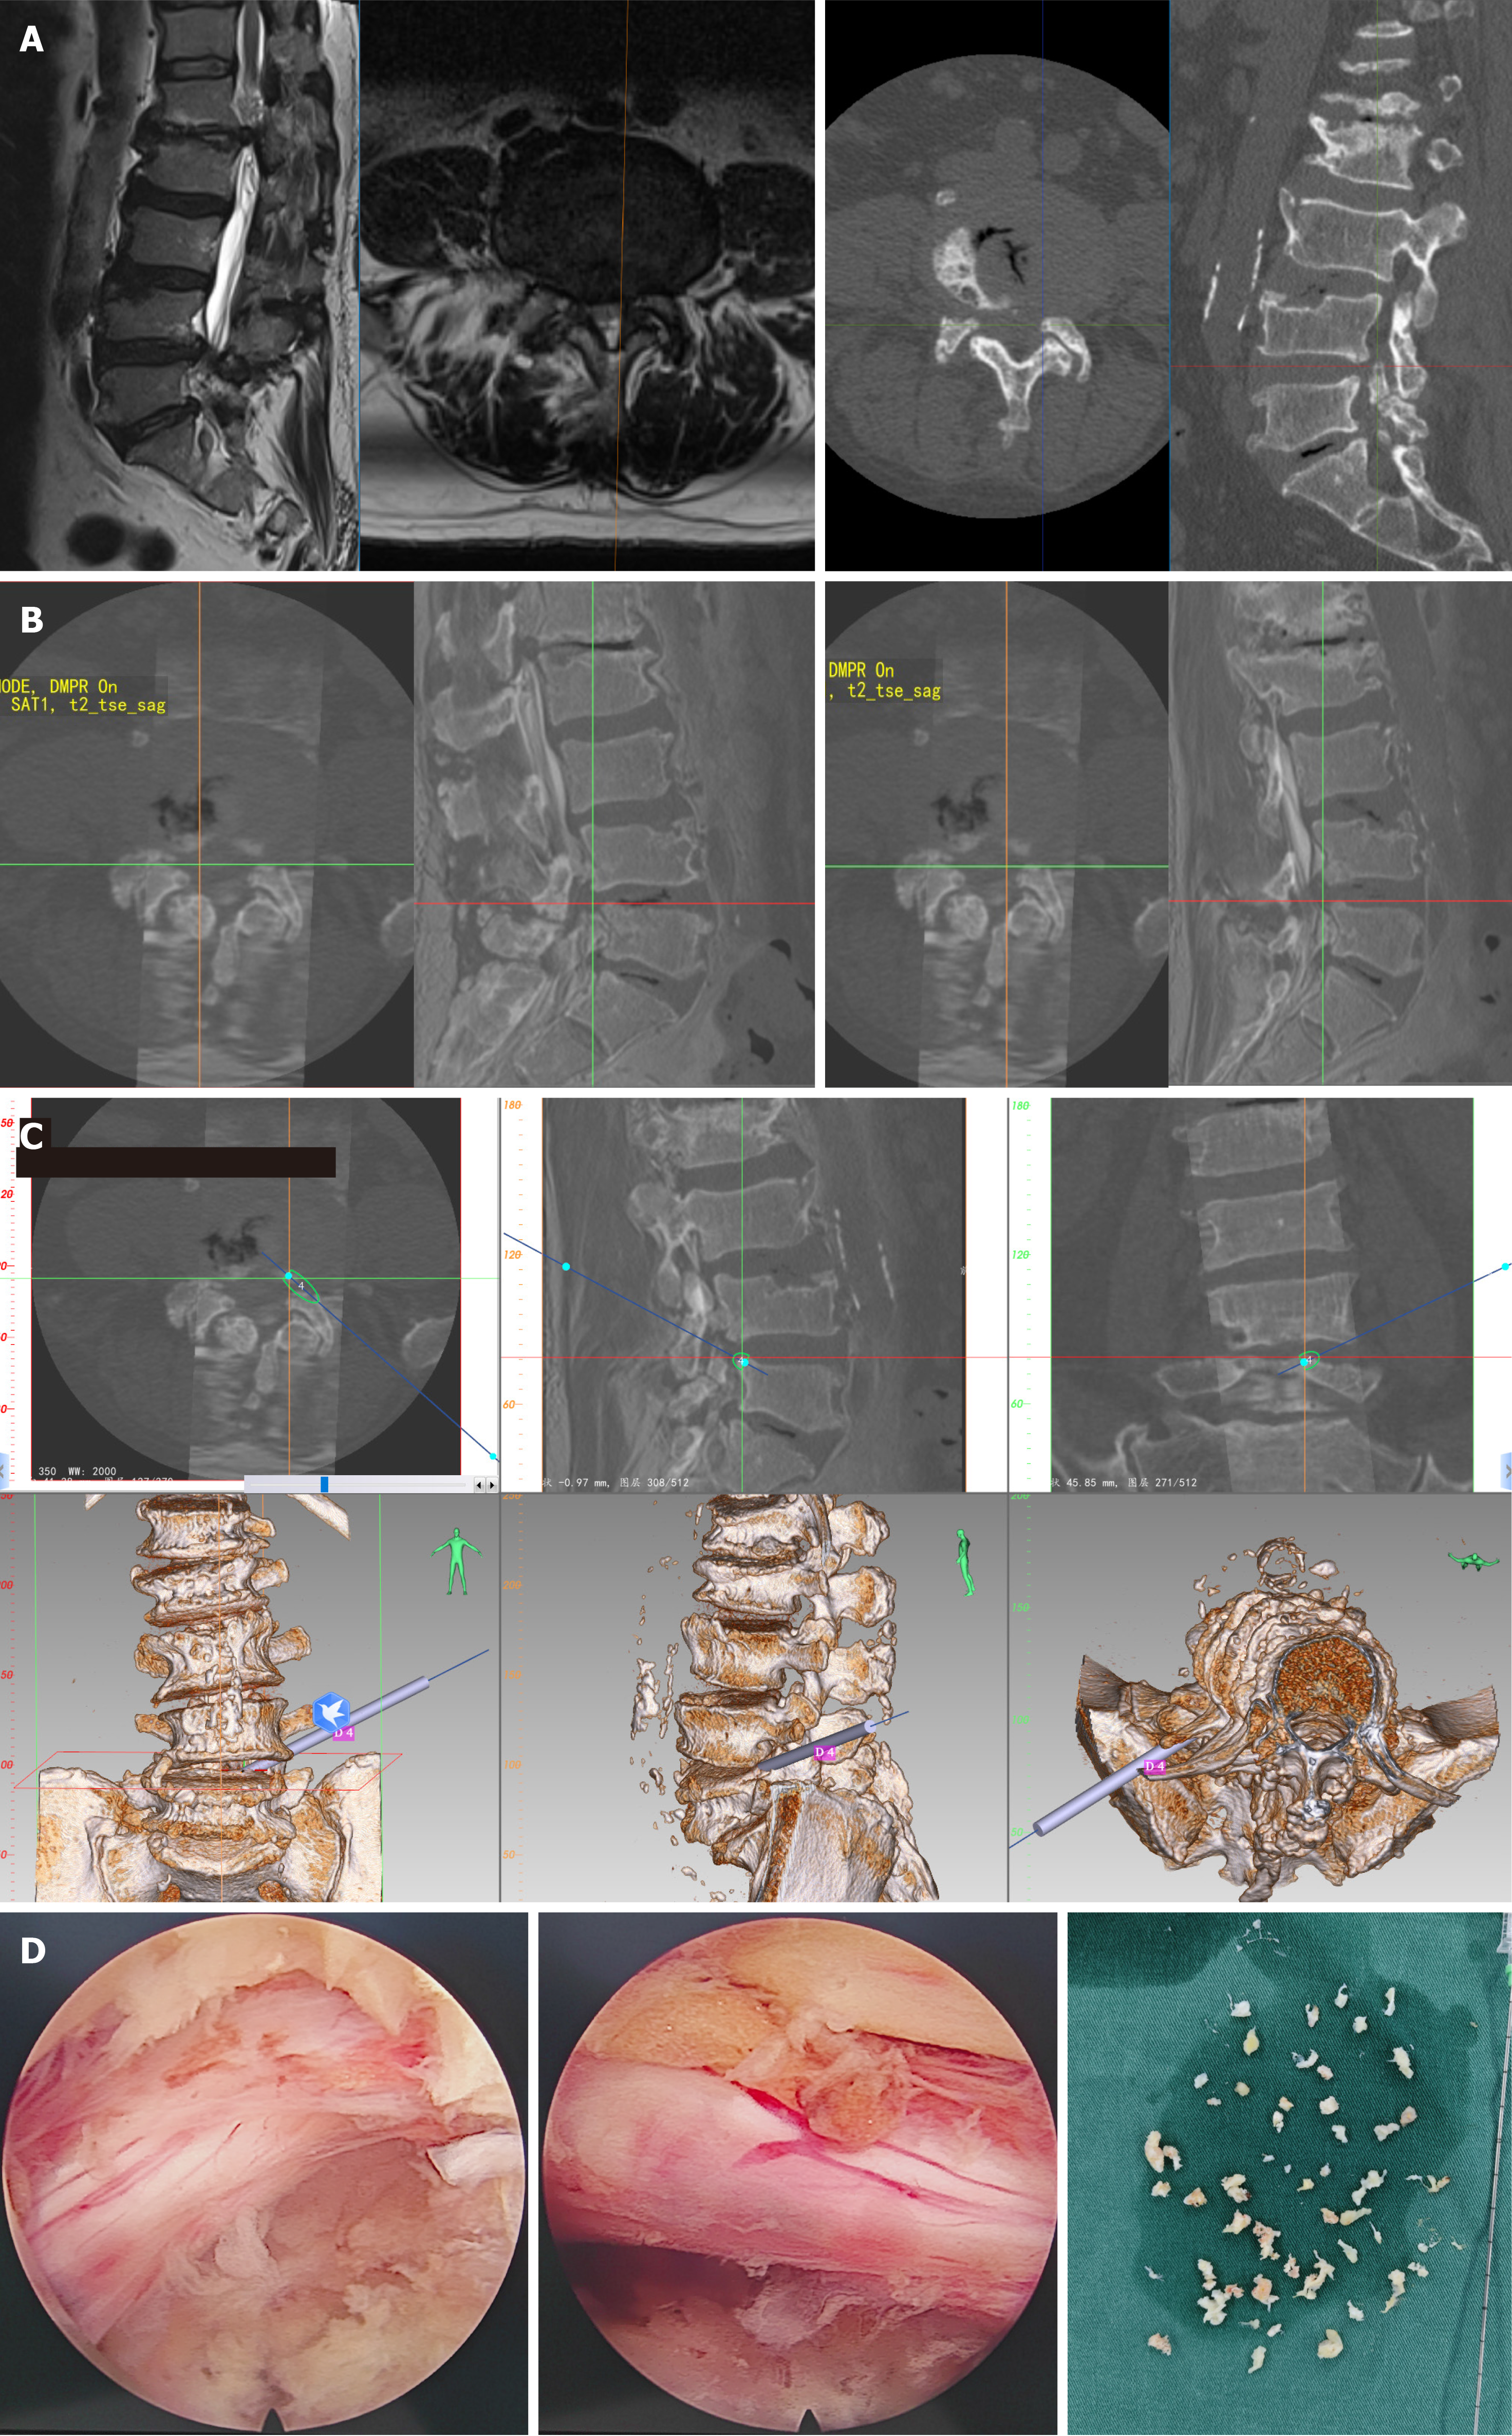
Figure 3 Typical case 2.
A: Magnetic resonance imaging and computed tomography images showing lumbar spine stenosis (L4/5); B: Computed tomography (CT)/magnetic resonance imaging registration image showing that the compression of the L5 nerve arose from the superior articular process and ventral intervertebral disc; C: Based on the compression site, a working cannula was simulated on the three-dimensional CT reconstruction image; D: Endoscopic images showing complete release of the nerves and spinal cord, and photograph showing the removed intervertebral disc and superior articular process.
- Citation: Guo XB, Chen JW, Liu JY, Jin JT. Impact of computed tomography/magnetic resonance imaging registration on rehabilitation after percutaneous endoscopic decompression for lumbar stenosis: Retrospective study. World J Orthop 2024; 15(10): 939-949
- URL: https://www.wjgnet.com/2218-5836/full/v15/i10/939.htm
- DOI: https://dx.doi.org/10.5312/wjo.v15.i10.939


