Copyright
©The Author(s) 2023.
World J Orthop. Sep 18, 2023; 14(9): 707-719
Published online Sep 18, 2023. doi: 10.5312/wjo.v14.i9.707
Published online Sep 18, 2023. doi: 10.5312/wjo.v14.i9.707
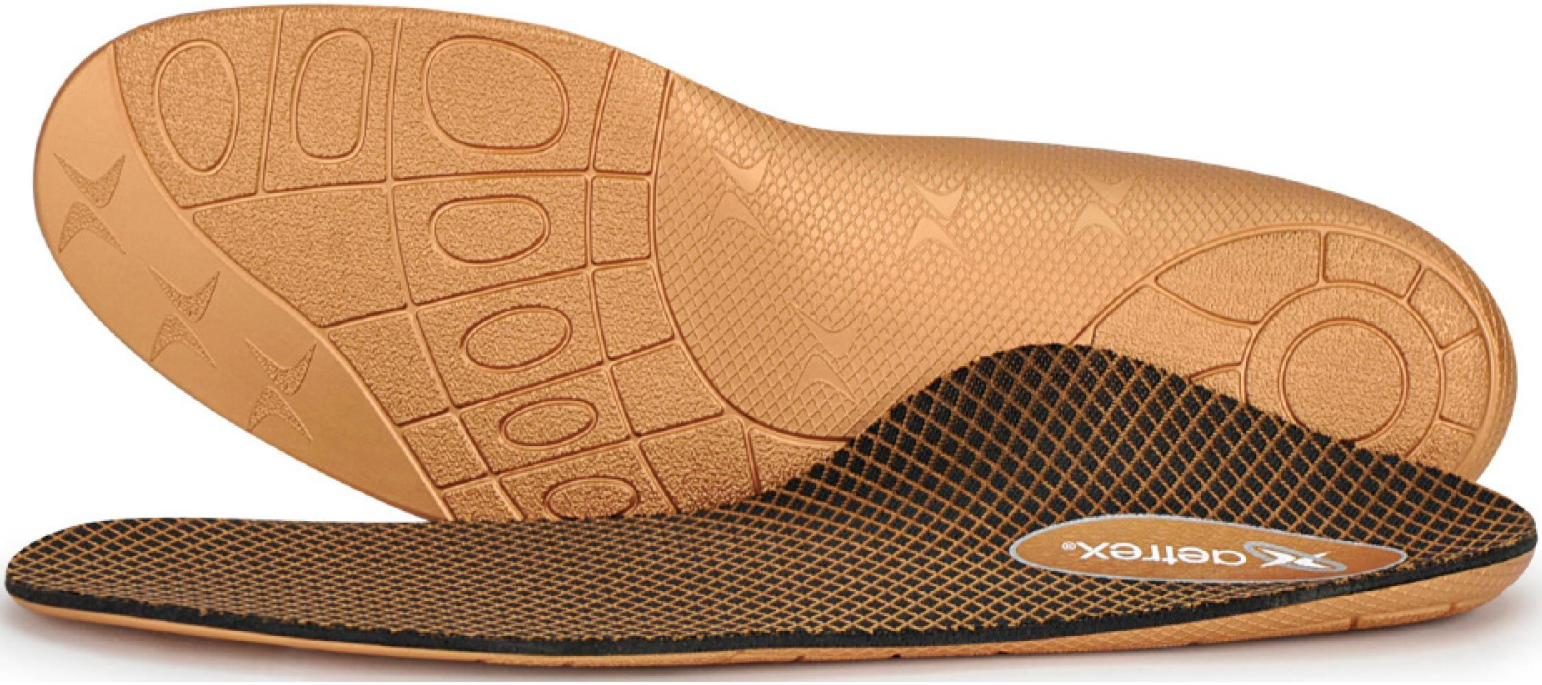
Figure 1 Aetrex L420 Compete orthotics.
This orthotic was provided to participants in both the intervention and control group. Copyright ©Aetrex, Inc.
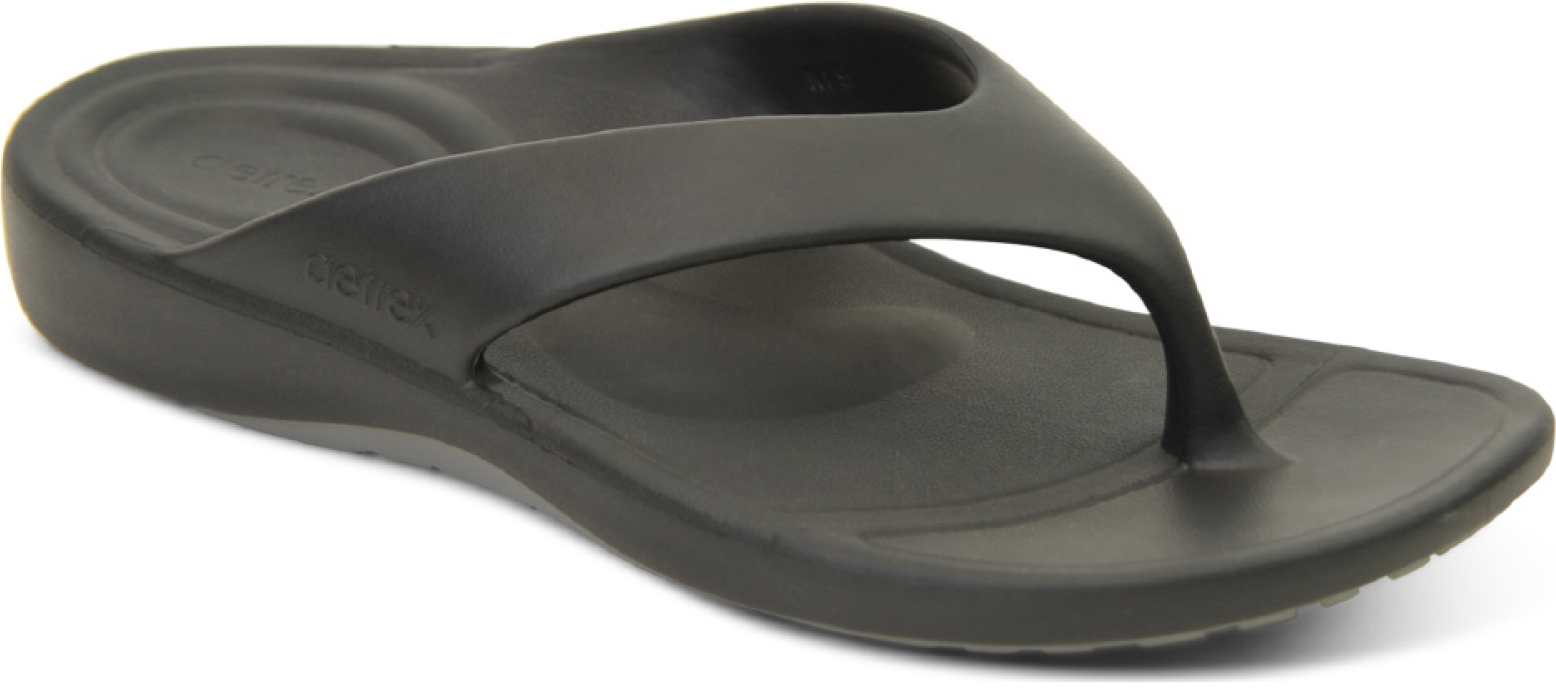
Figure 2 Aetrex L3000 maui orthotic sandals.
This orthotic sandal was provided only to participants in the intervention group. Copyright ©Aetrex, Inc.
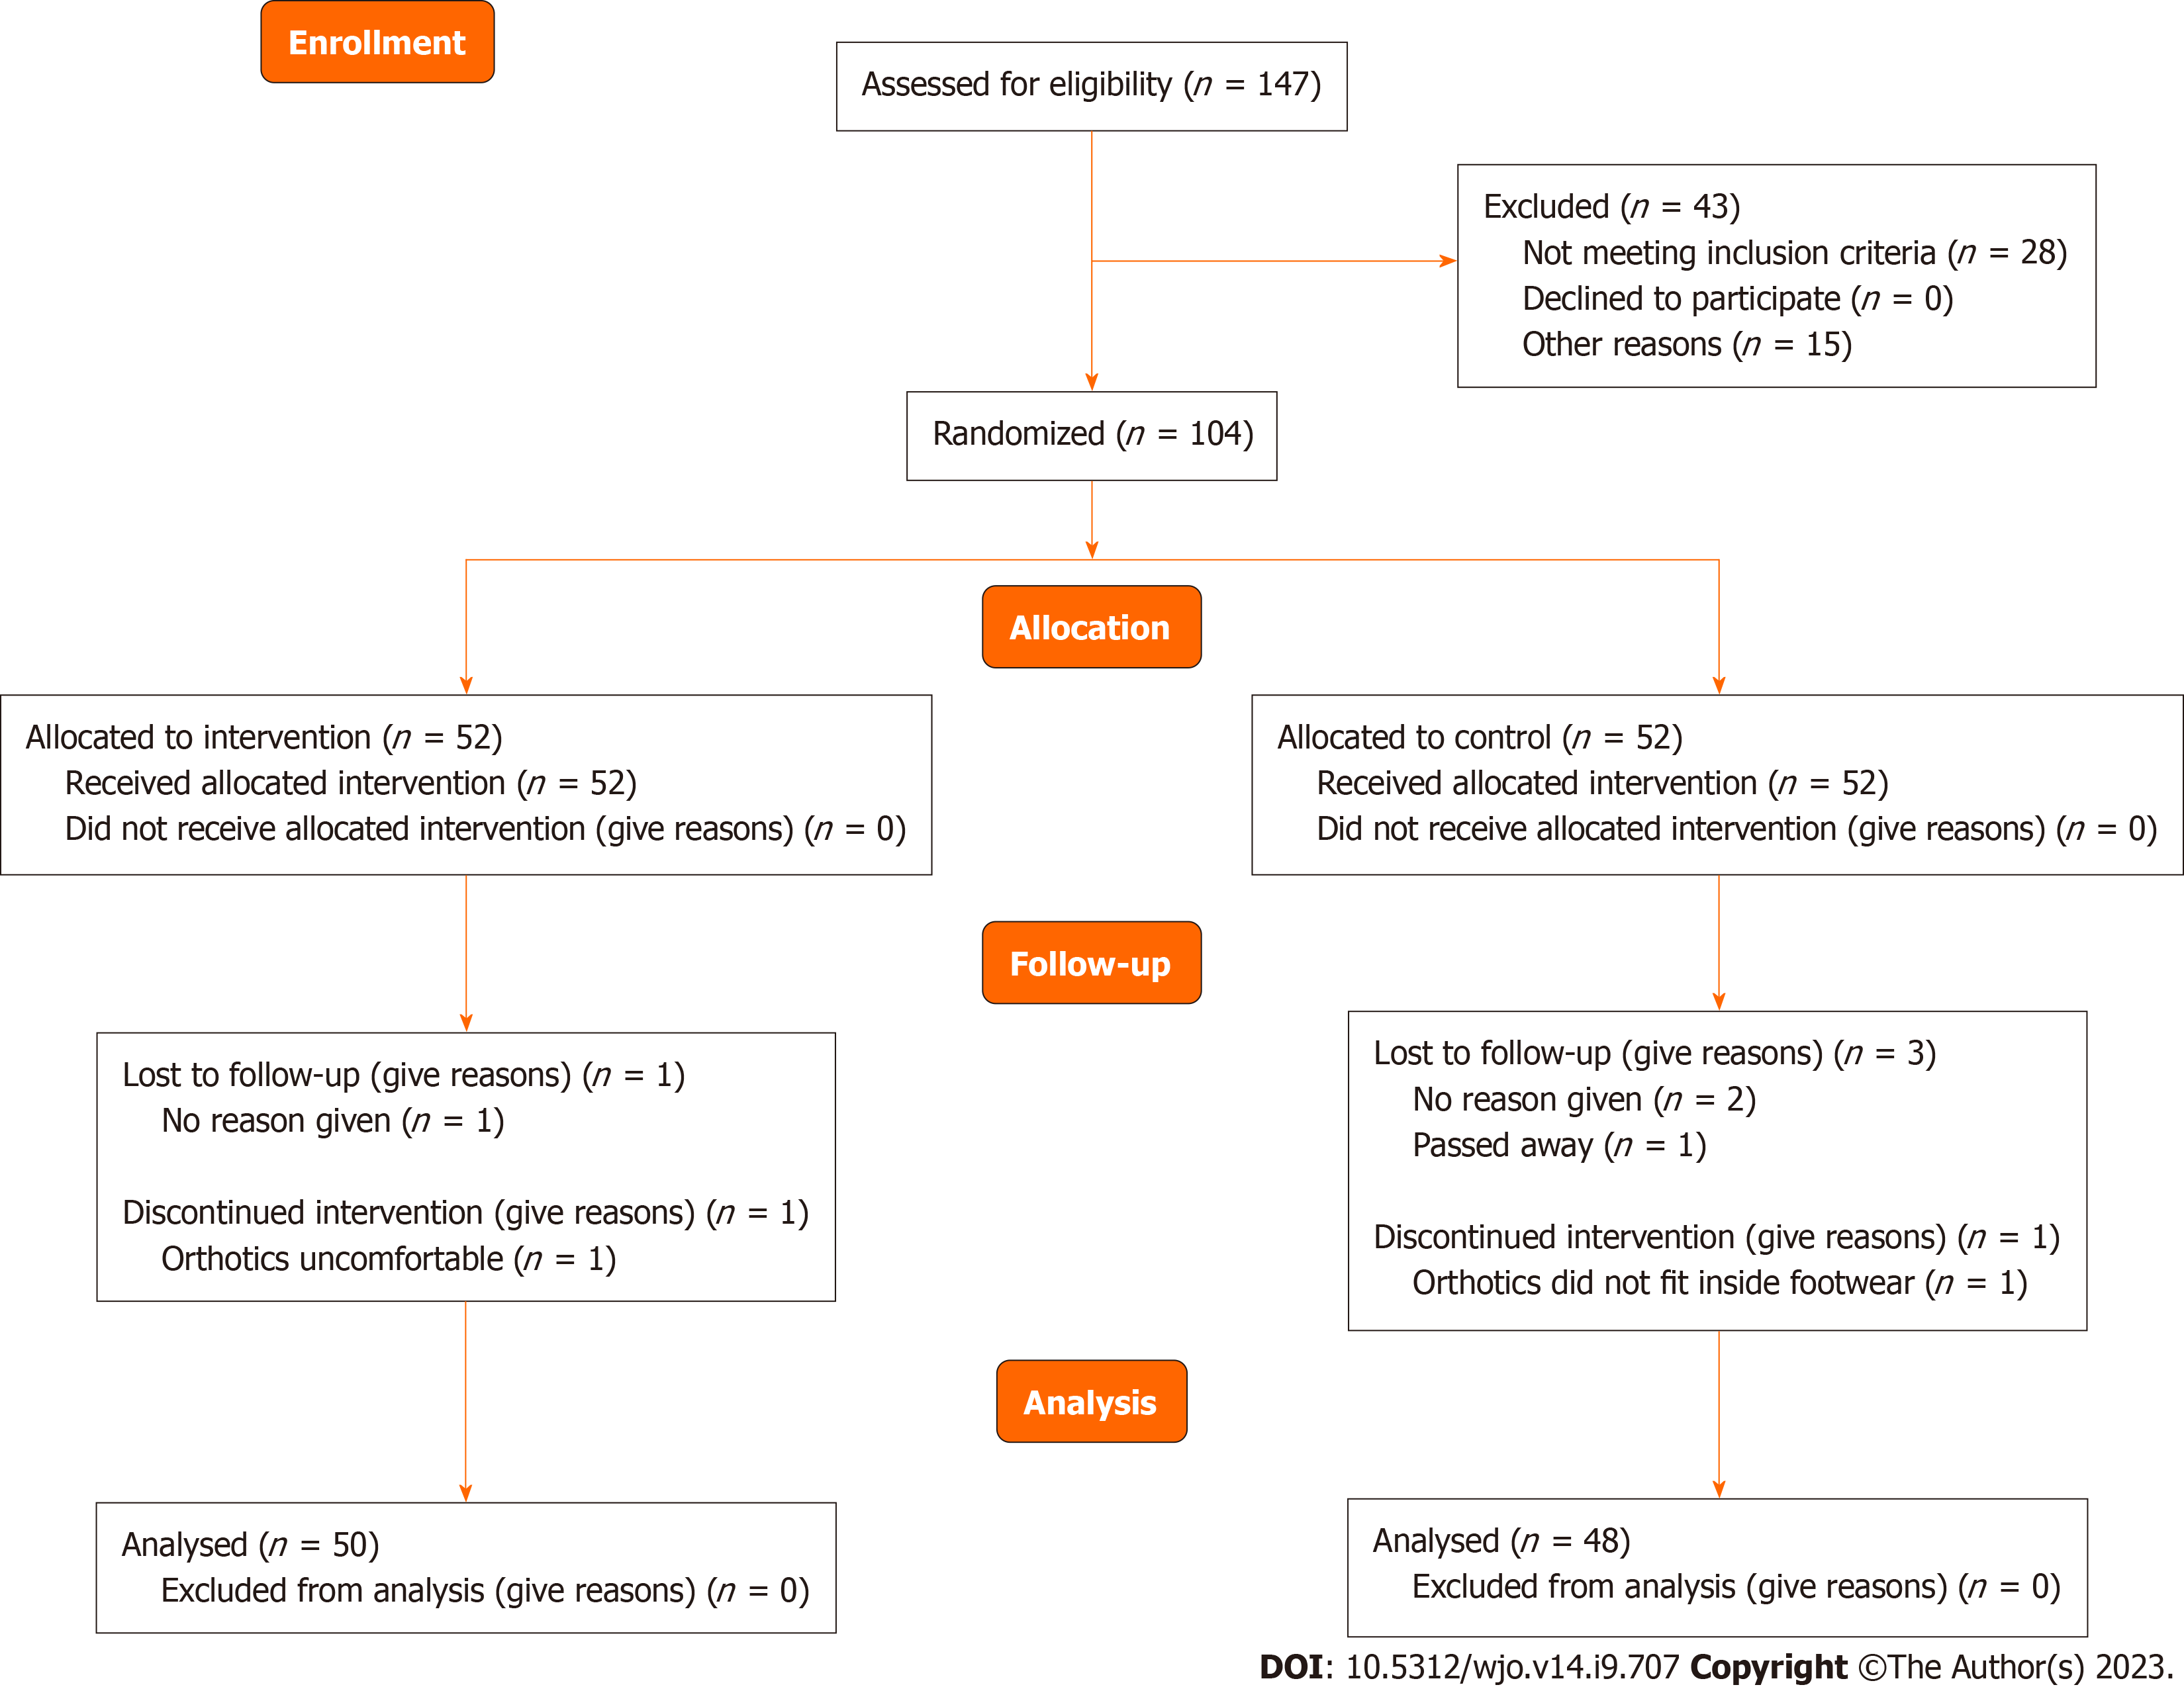
Figure 3
CONSORT flow diagram.
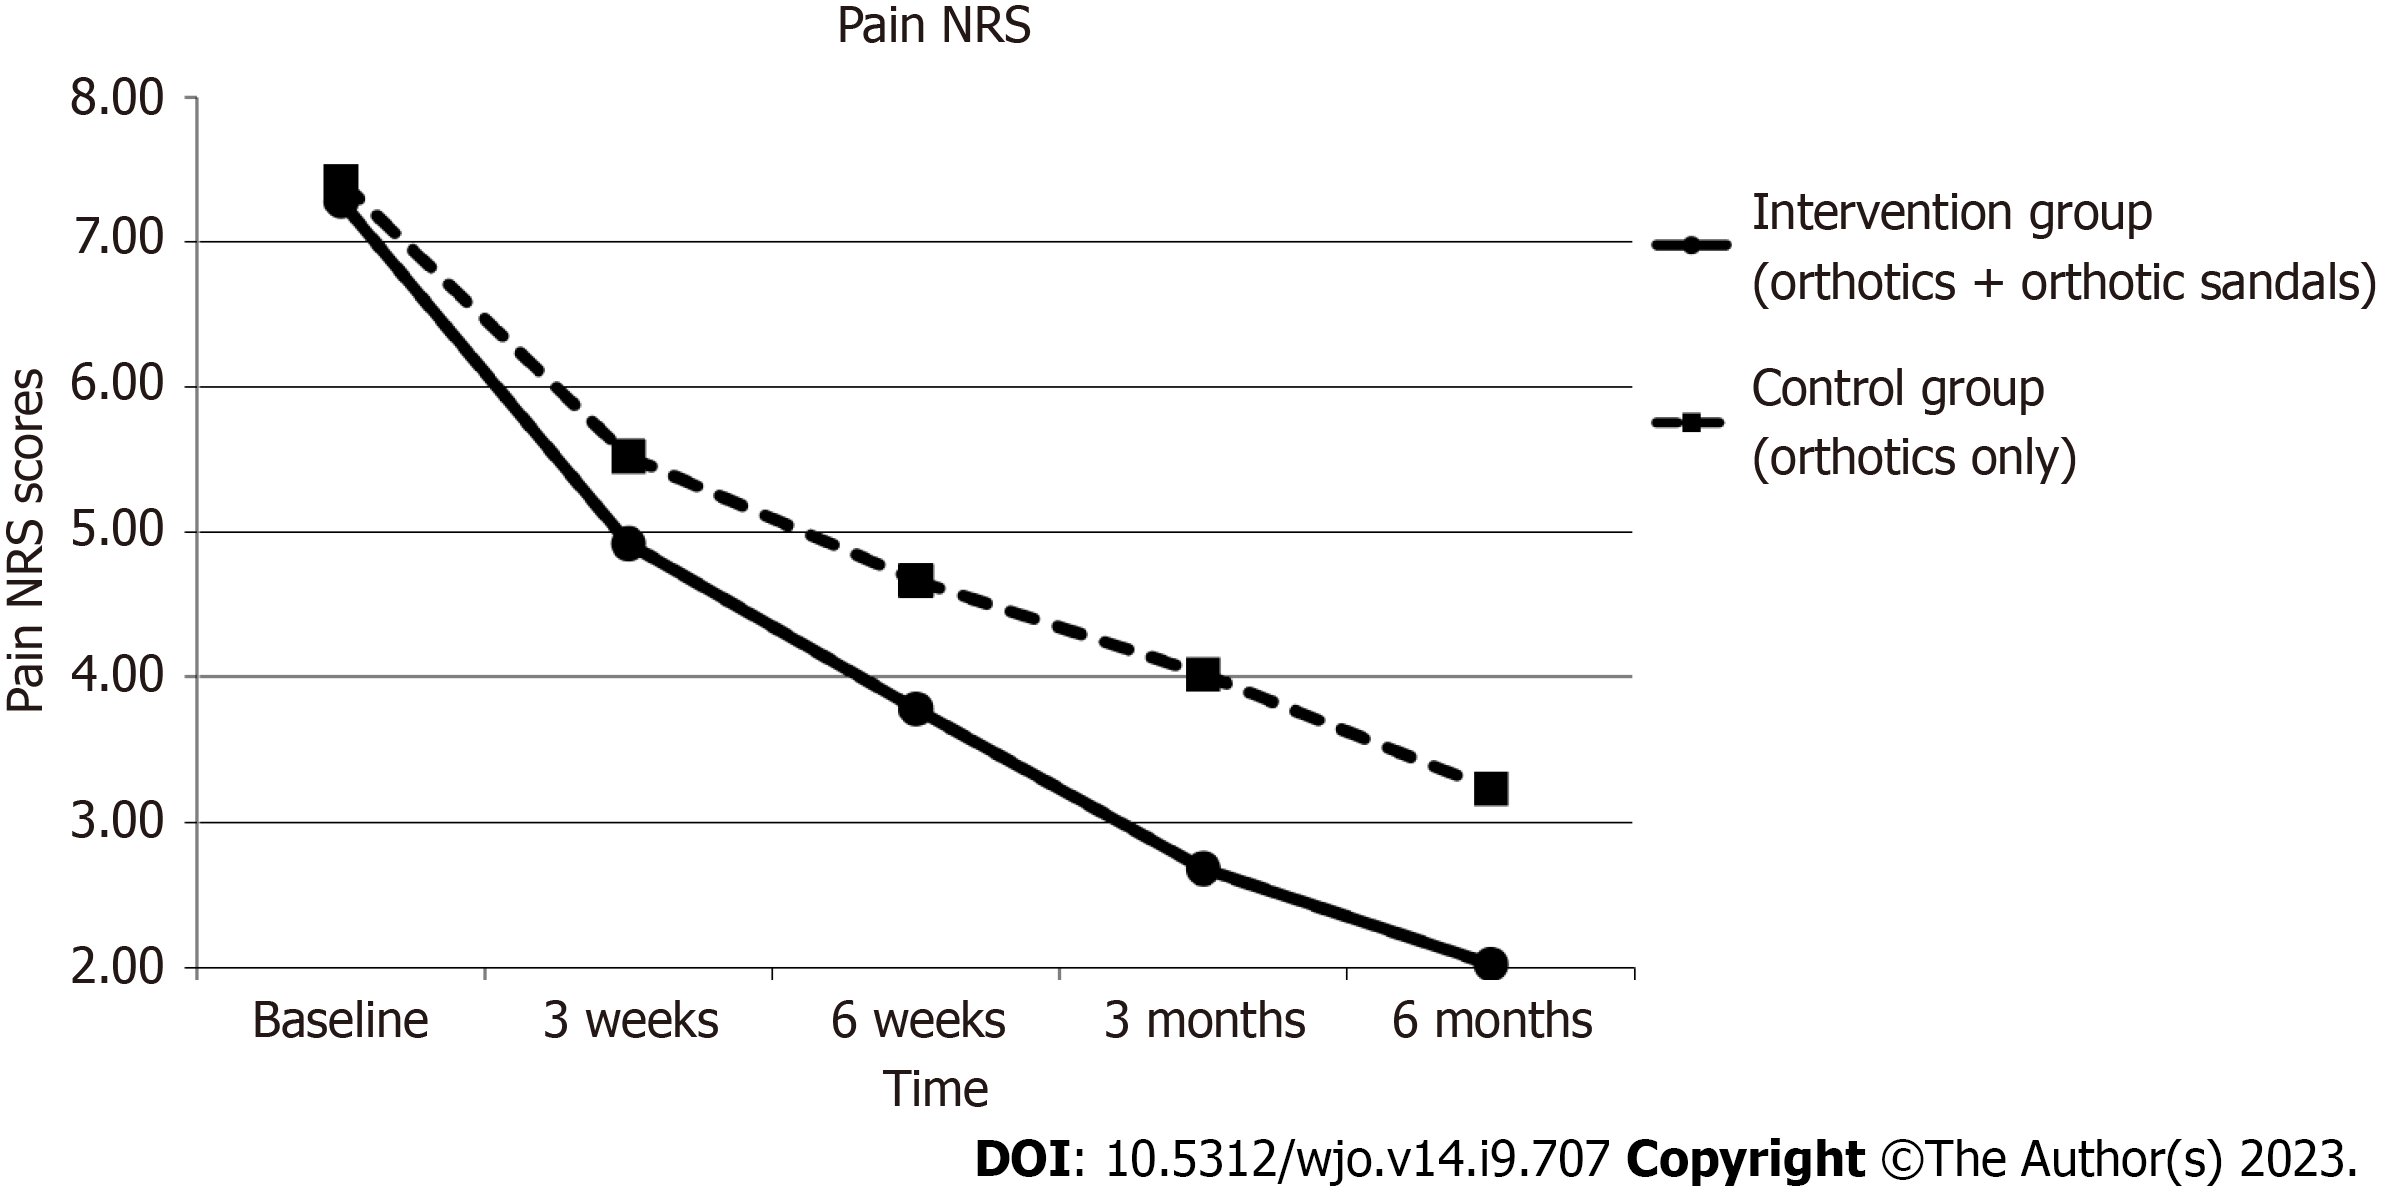
Figure 4 Foot pain over the last week, measured by numerical rating scale, across time from baseline to 6 mo.
NRS: Numerical rating scale.
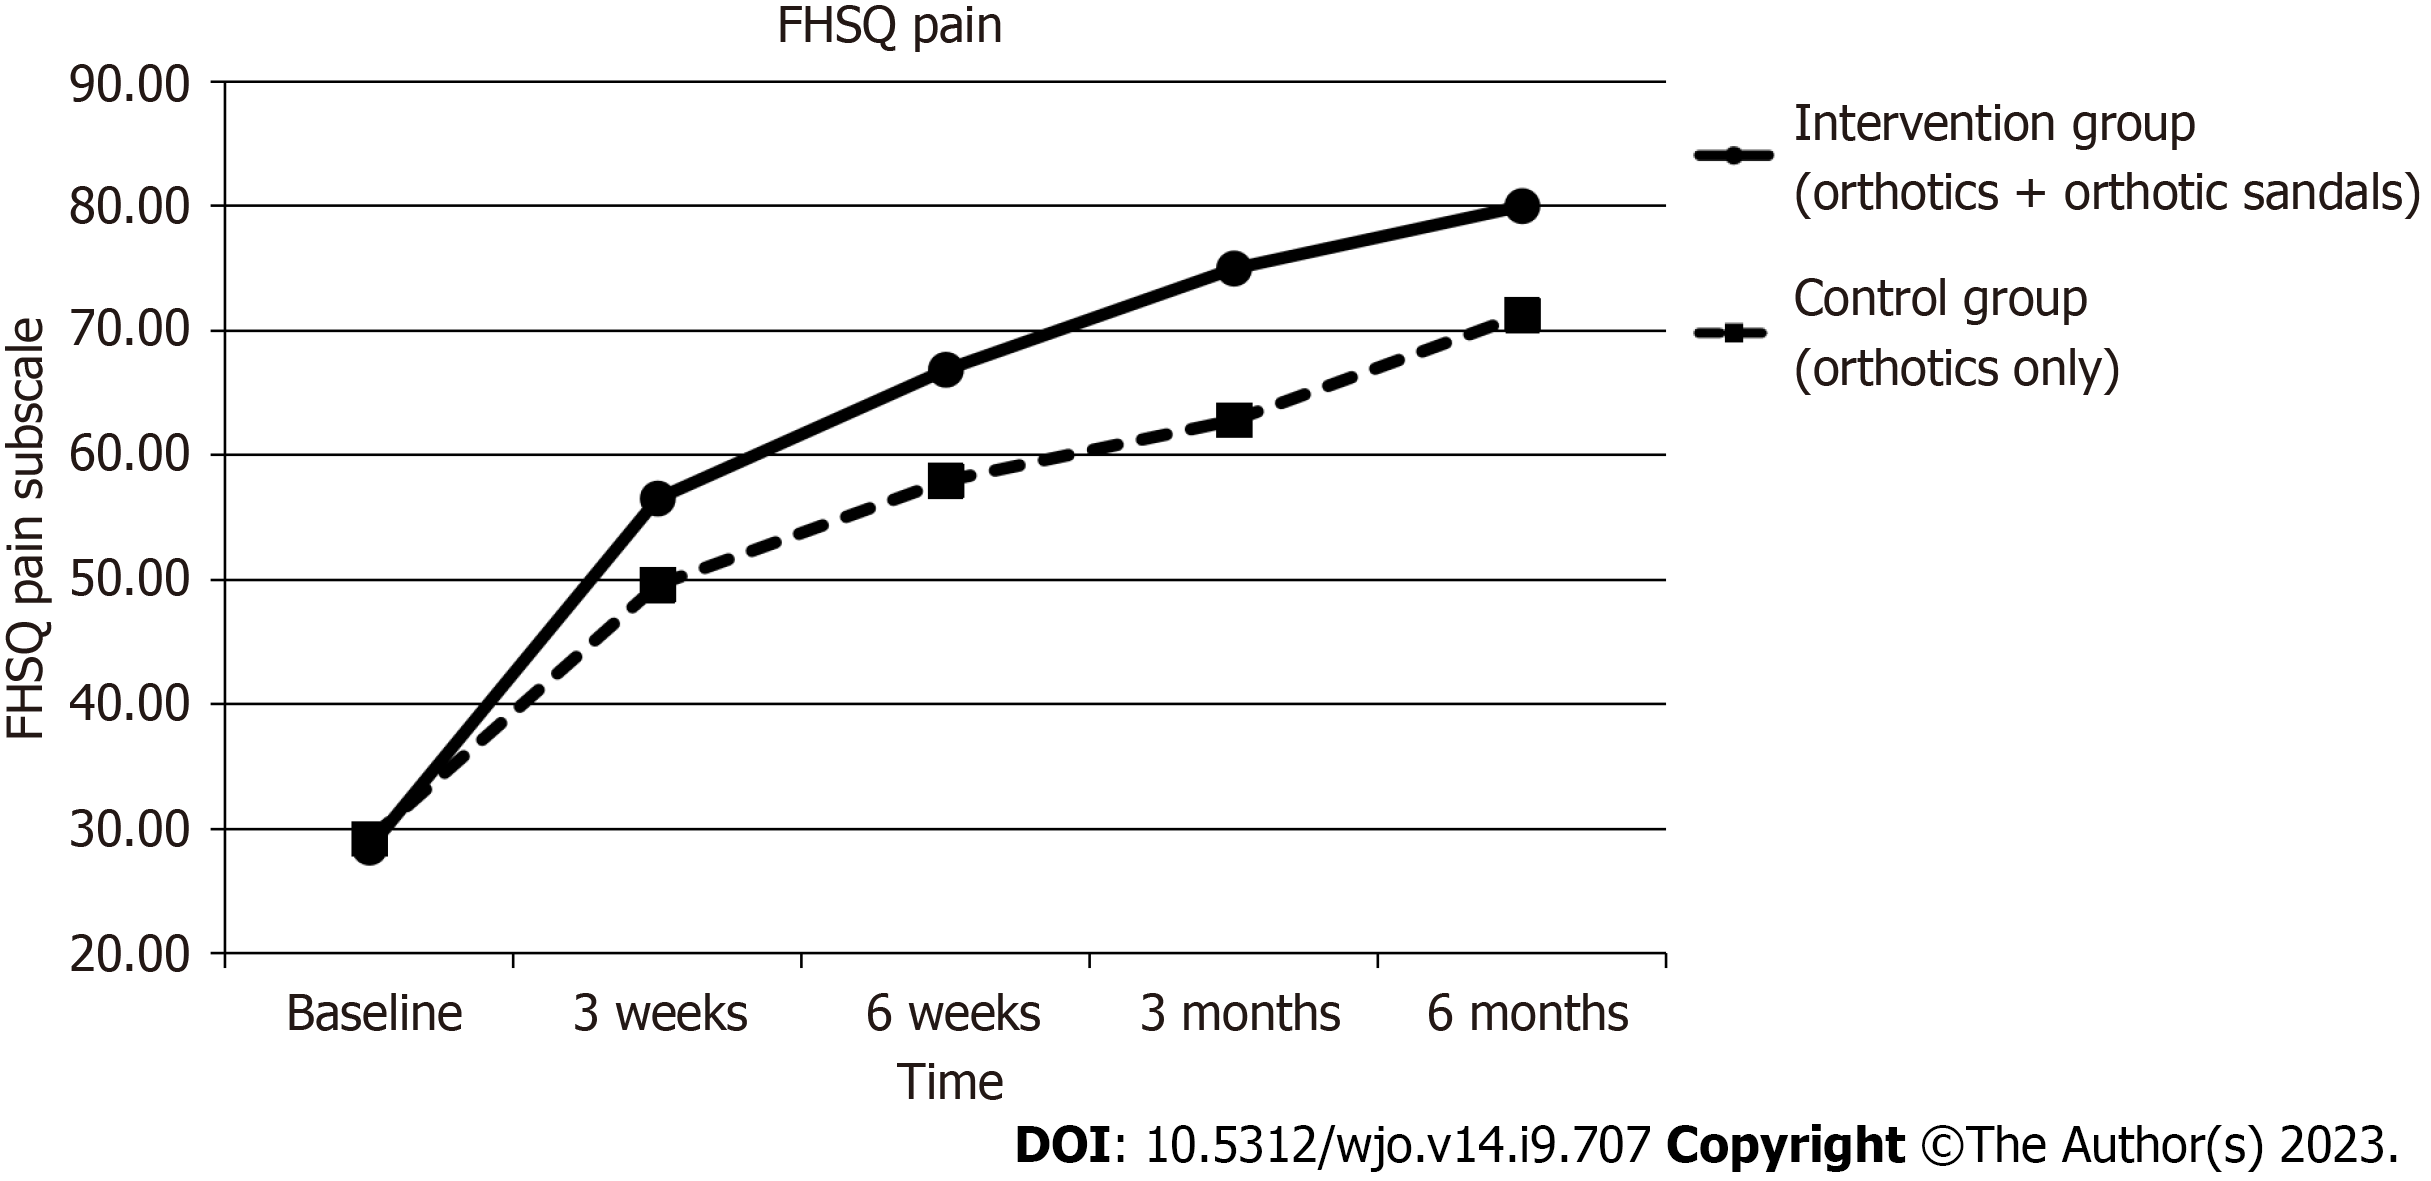
Figure 5 Foot pain, as assessed by the foot health status questionnaire, across time from baseline to 6 mo.
FHSQ: Foot health status questionnaire.
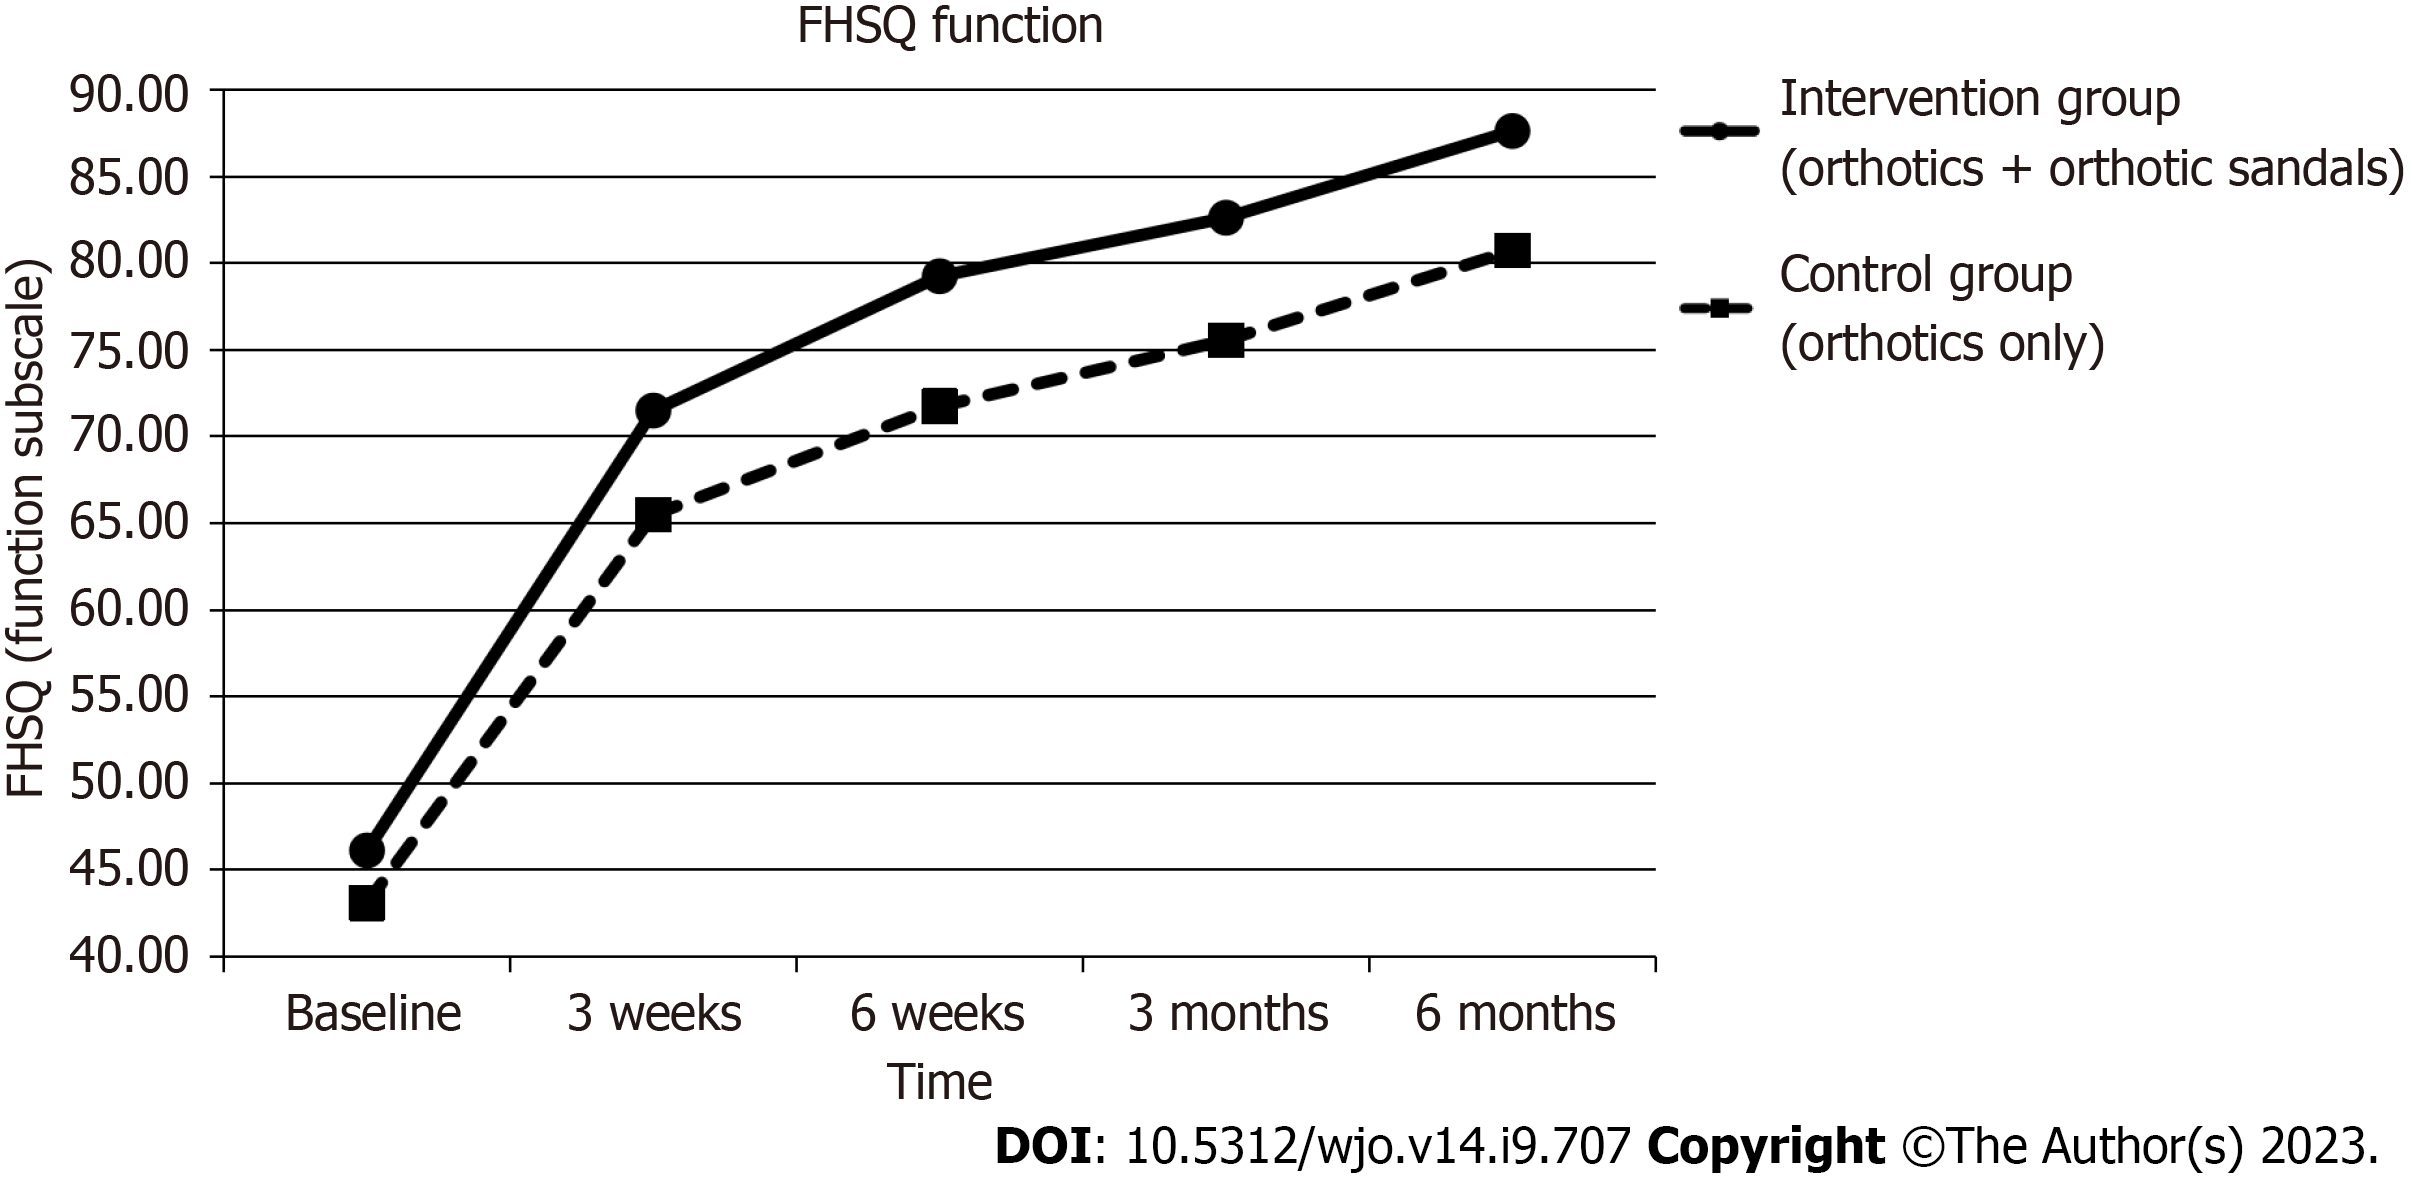
Figure 6 Foot function, as assessed by the foot health status questionnaire, across time from baseline to 6 mo.
FHSQ: Foot health status questionnaire.
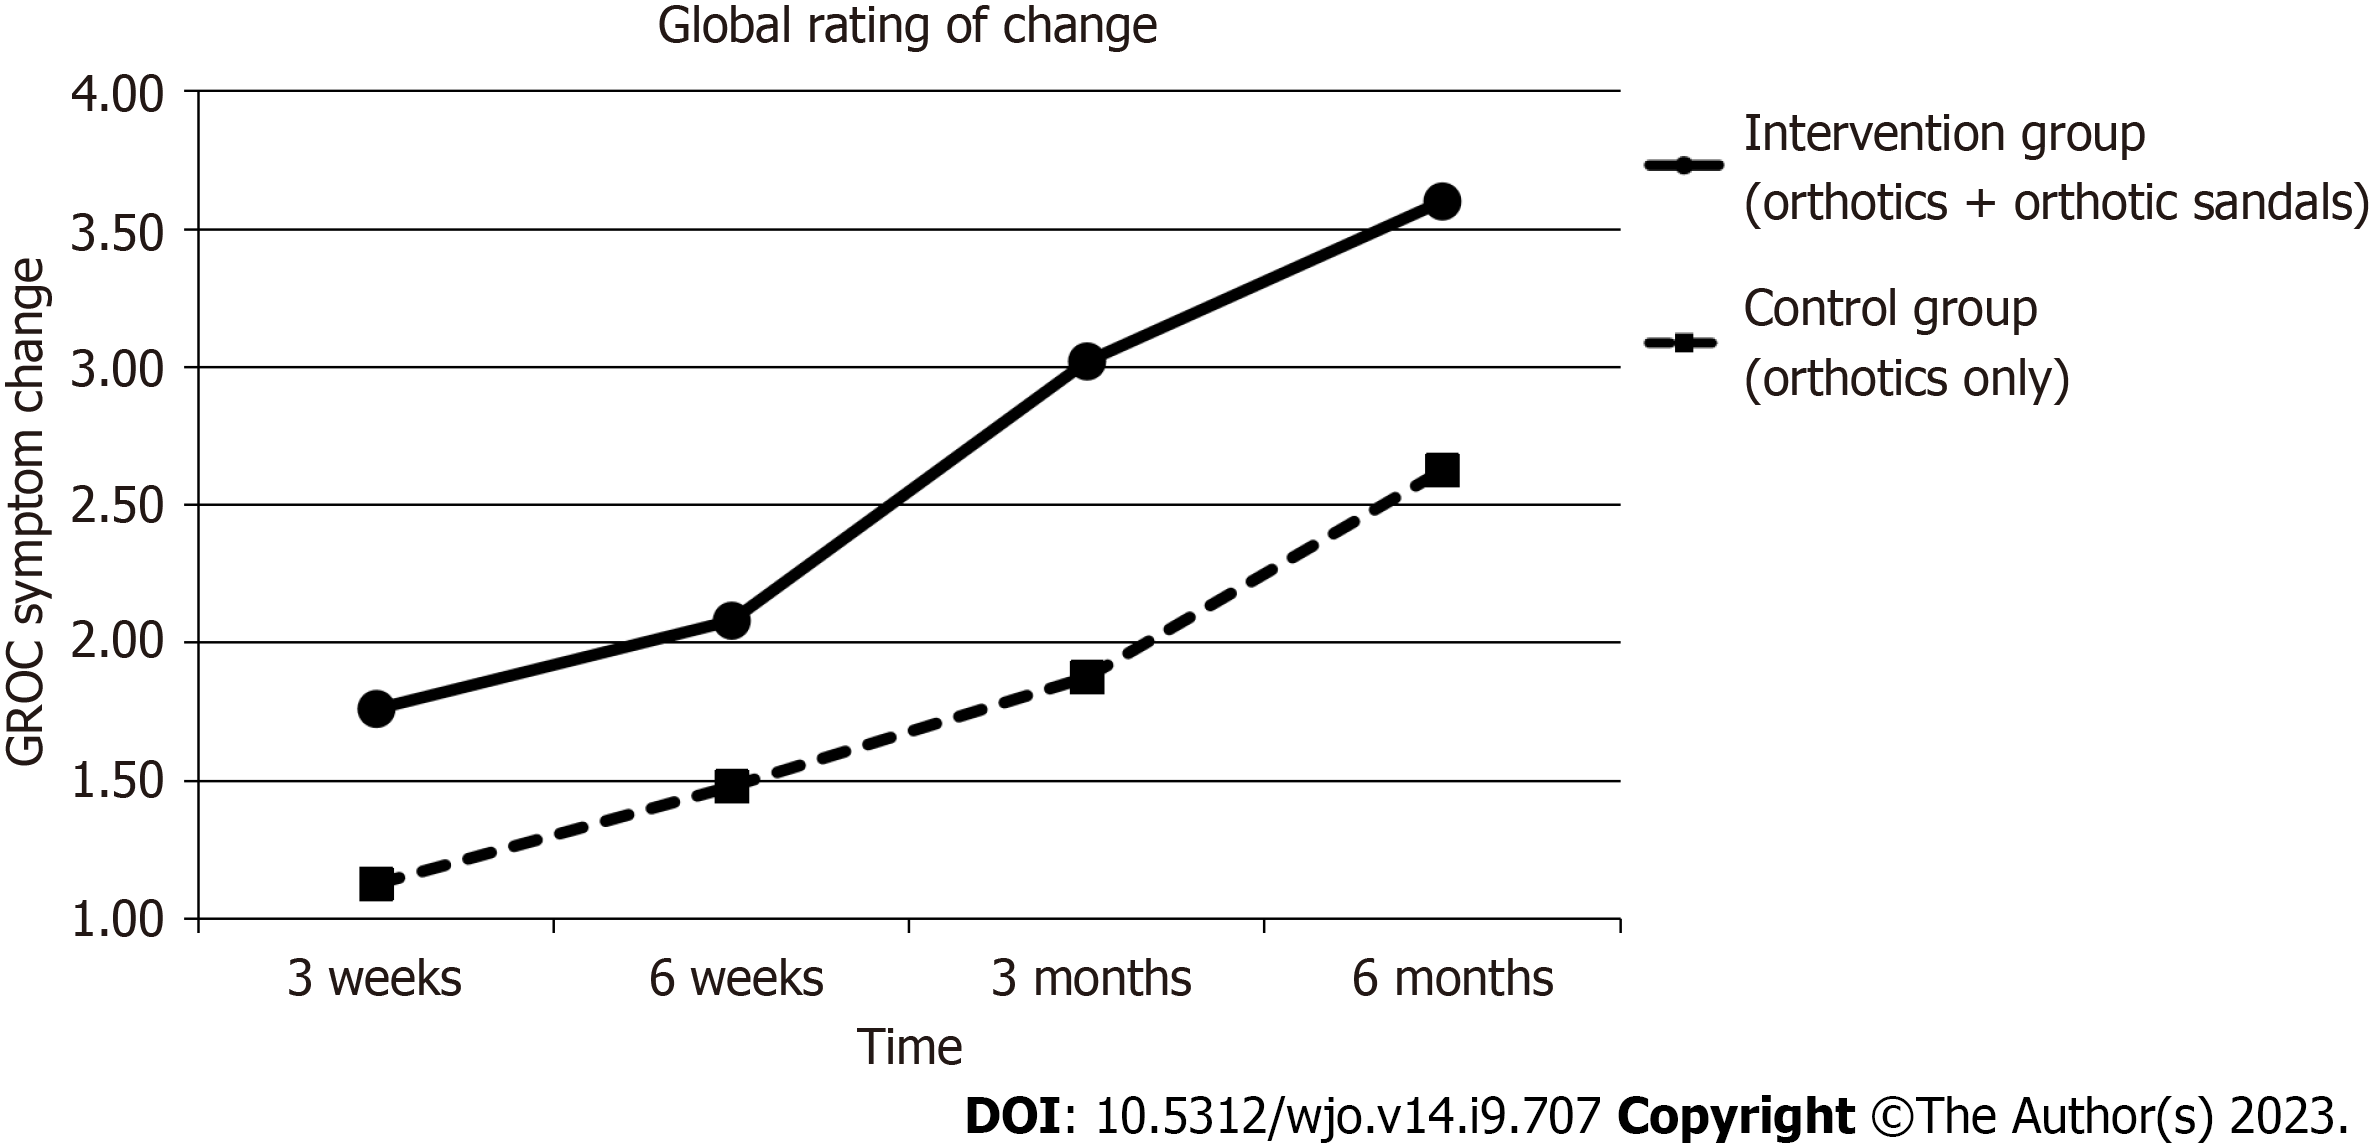
Figure 7 Symptom change from week 3 to month 6, as assessed by the global rating of change score scale.
GROC: Global rating of change score.
- Citation: Amoako-Tawiah P, Love H, Chacko Madathilethu J, LaCourse J, Fortune AE, Sims JMG, Ampat G. Use of orthotics with orthotic sandals versus the sole use of orthotics for plantar fasciitis: Randomised controlled trial. World J Orthop 2023; 14(9): 707-719
- URL: https://www.wjgnet.com/2218-5836/full/v14/i9/707.htm
- DOI: https://dx.doi.org/10.5312/wjo.v14.i9.707


