Copyright
©The Author(s) 2023.
World J Orthop. Sep 18, 2023; 14(9): 669-681
Published online Sep 18, 2023. doi: 10.5312/wjo.v14.i9.669
Published online Sep 18, 2023. doi: 10.5312/wjo.v14.i9.669
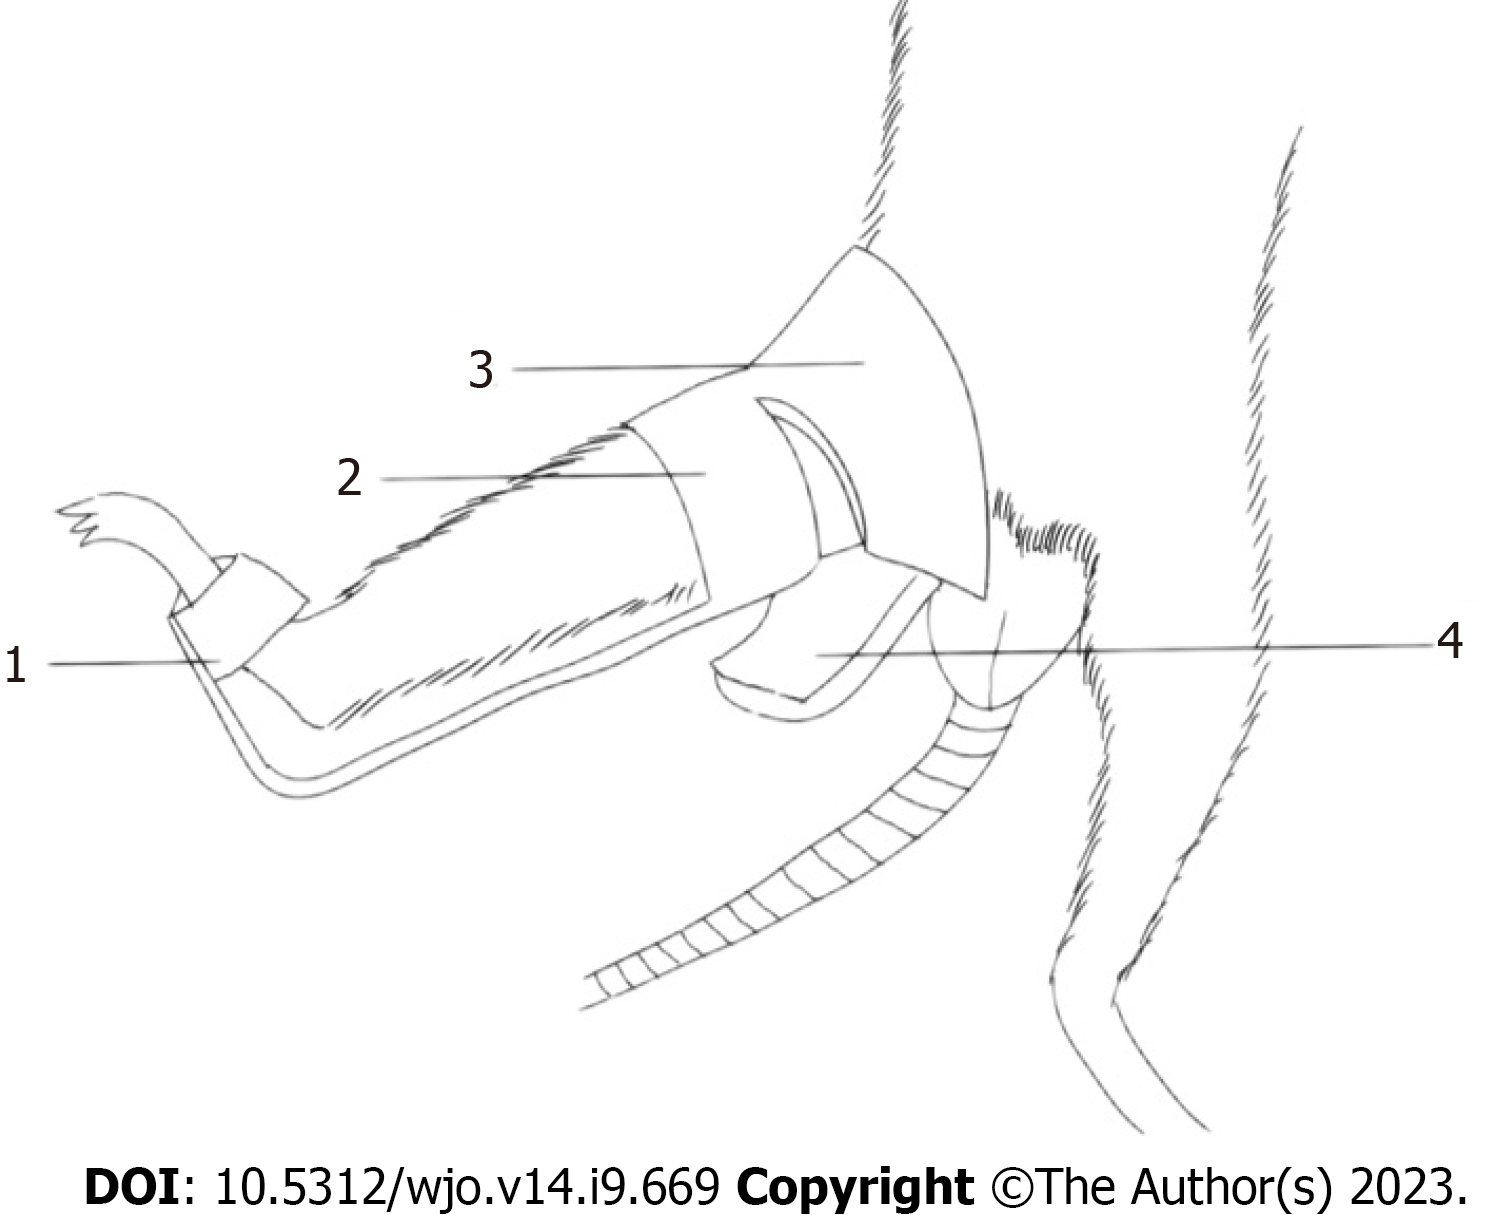
Figure 1 Knee joint fixation device.
Immobilize the back of the rat’s distal foot to prevent the rat’s lower limb from slipping out of the immobilization device. Immobilize the periphery of the rat knee joint. Above the knee joint of the rat is an inverted conical structure, and this design fixes the periphery of the femur of the rat. Appropriate bending under the rat femur provides a lever fulcrum action. (1) Immobilize the back of the rat's distal foot to prevent the rat's lower limb from slipping out of the immobilization device. (2) Immobilize the periphery of the rat knee joint. (3) Above the knee joint of the rat is an inverted conical structure, and this design fixes the periphery of the femur of the rat. (4) Appropriate bending under the rat femur provides a lever fulcrum action.
Figure 2 Fixed schematic diagram.
A: Fixed picture; B: X-ray orthotopic slice of rat knee joint after immobilization; C: X-line lateral tablet of rat knee joint after immobilization. 1Femur; 2Knee; 3Tibia.
Figure 3 Joint mobility meter.
A: Peeling range of motion (total contracture) measurement; B: Measuring range of motion after muscle separation (arthrogenic contracture).
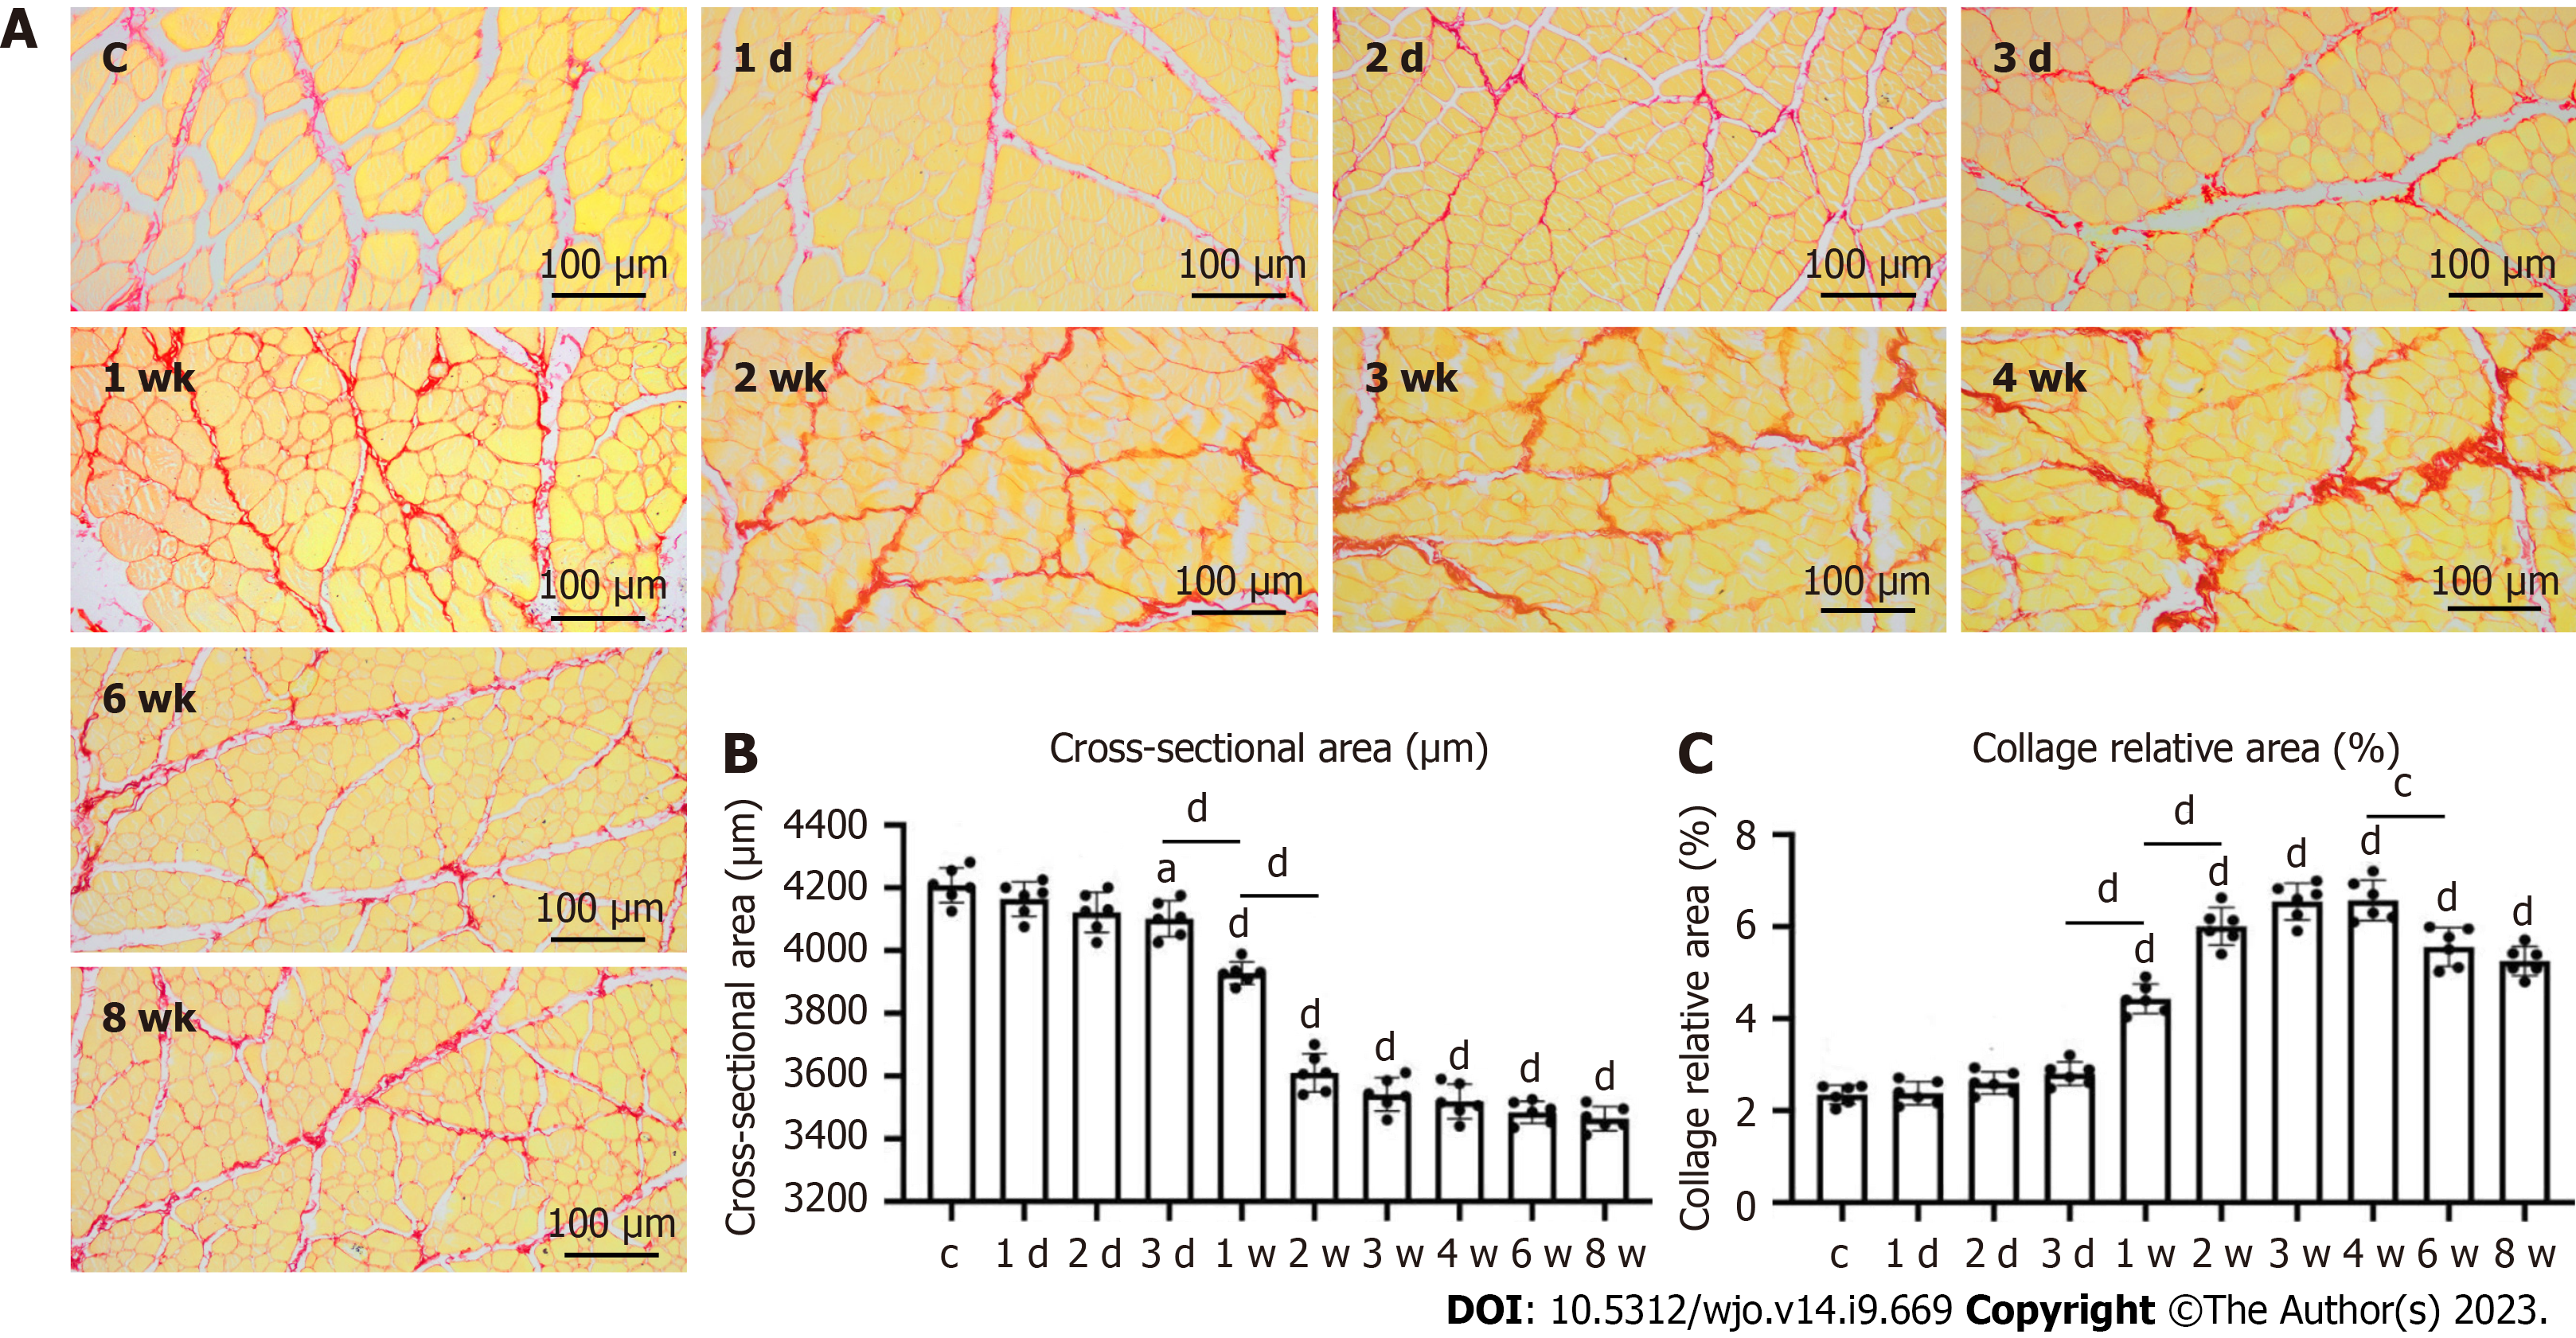
Figure 4 Sirius red staining findings.
A: Morphological changes of rectus femoris after Sirius red staining, group C (control), 1 d, 2 d, 1 wk, 2 wk, 3 wk, 4 wk, 6 wk, and 8 wk; B and C: Cross-sectional value of rectus femoris fibers. aP < 0.05; cP < 0.001; dP < 0.0001.
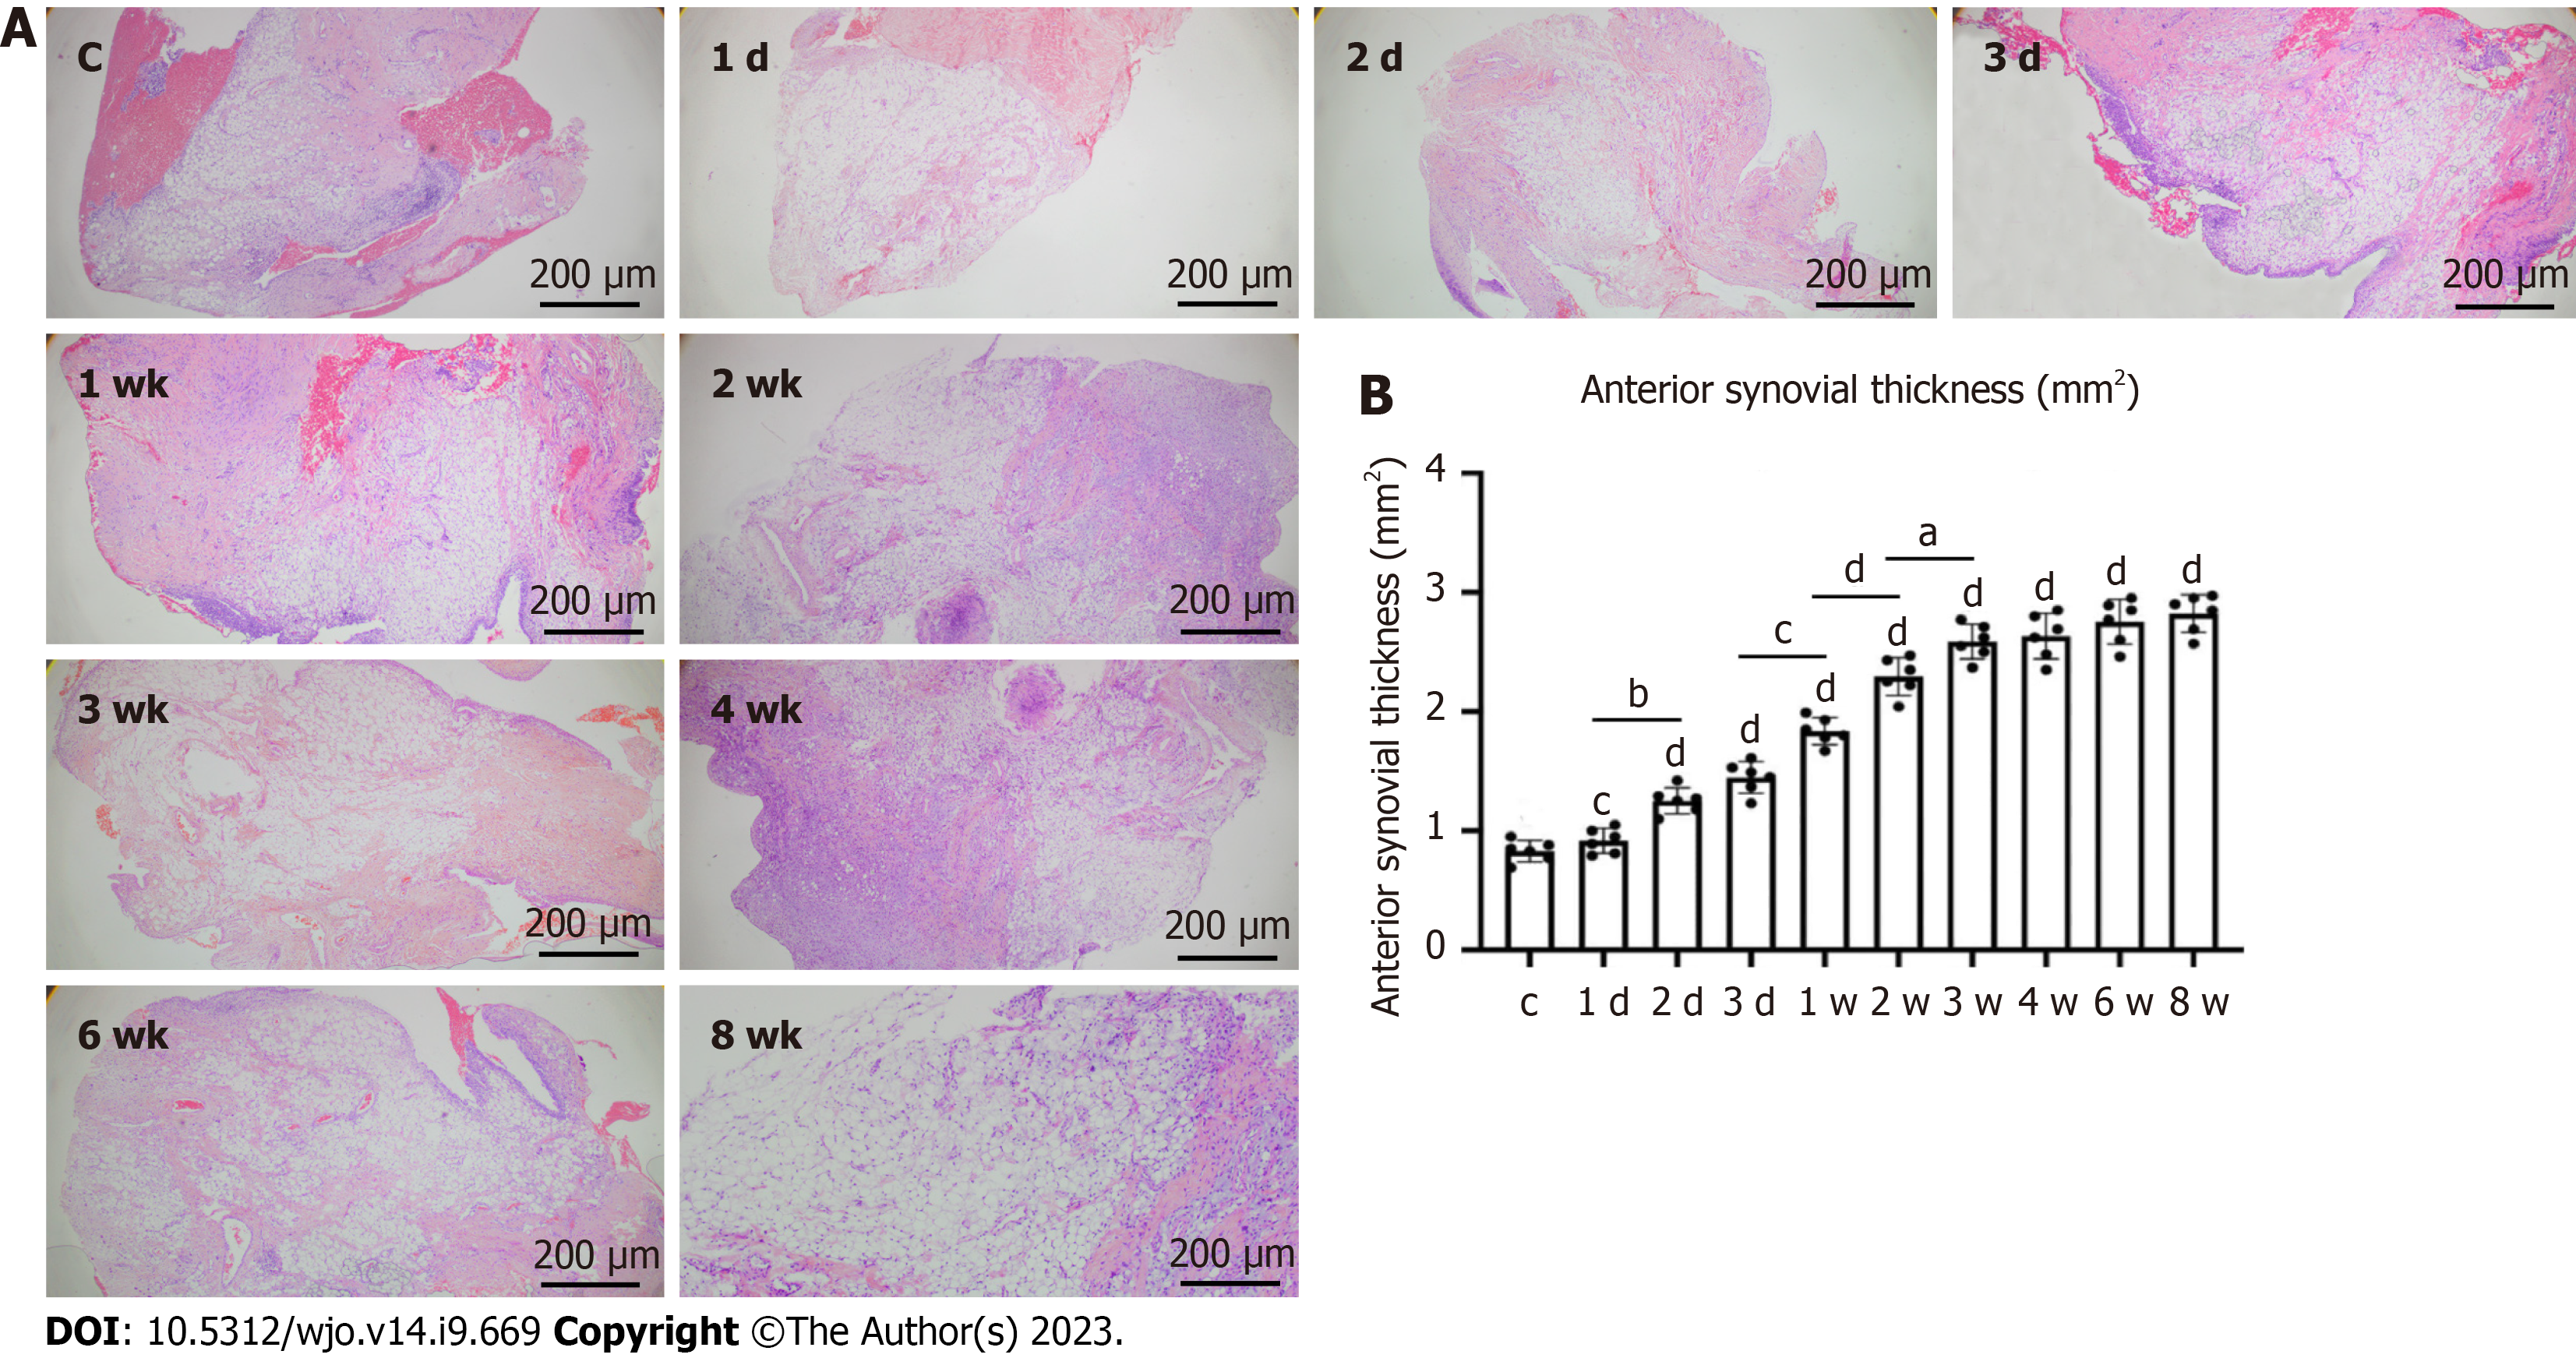
Figure 5 Hematoxylin and eosin staining findings.
A: Morphological changes of the anterior joint capsule; B: The anterior joint capsule thickness value. aP < 0.05; bP < 0.01; cP < 0.001; dP < 0.0001.
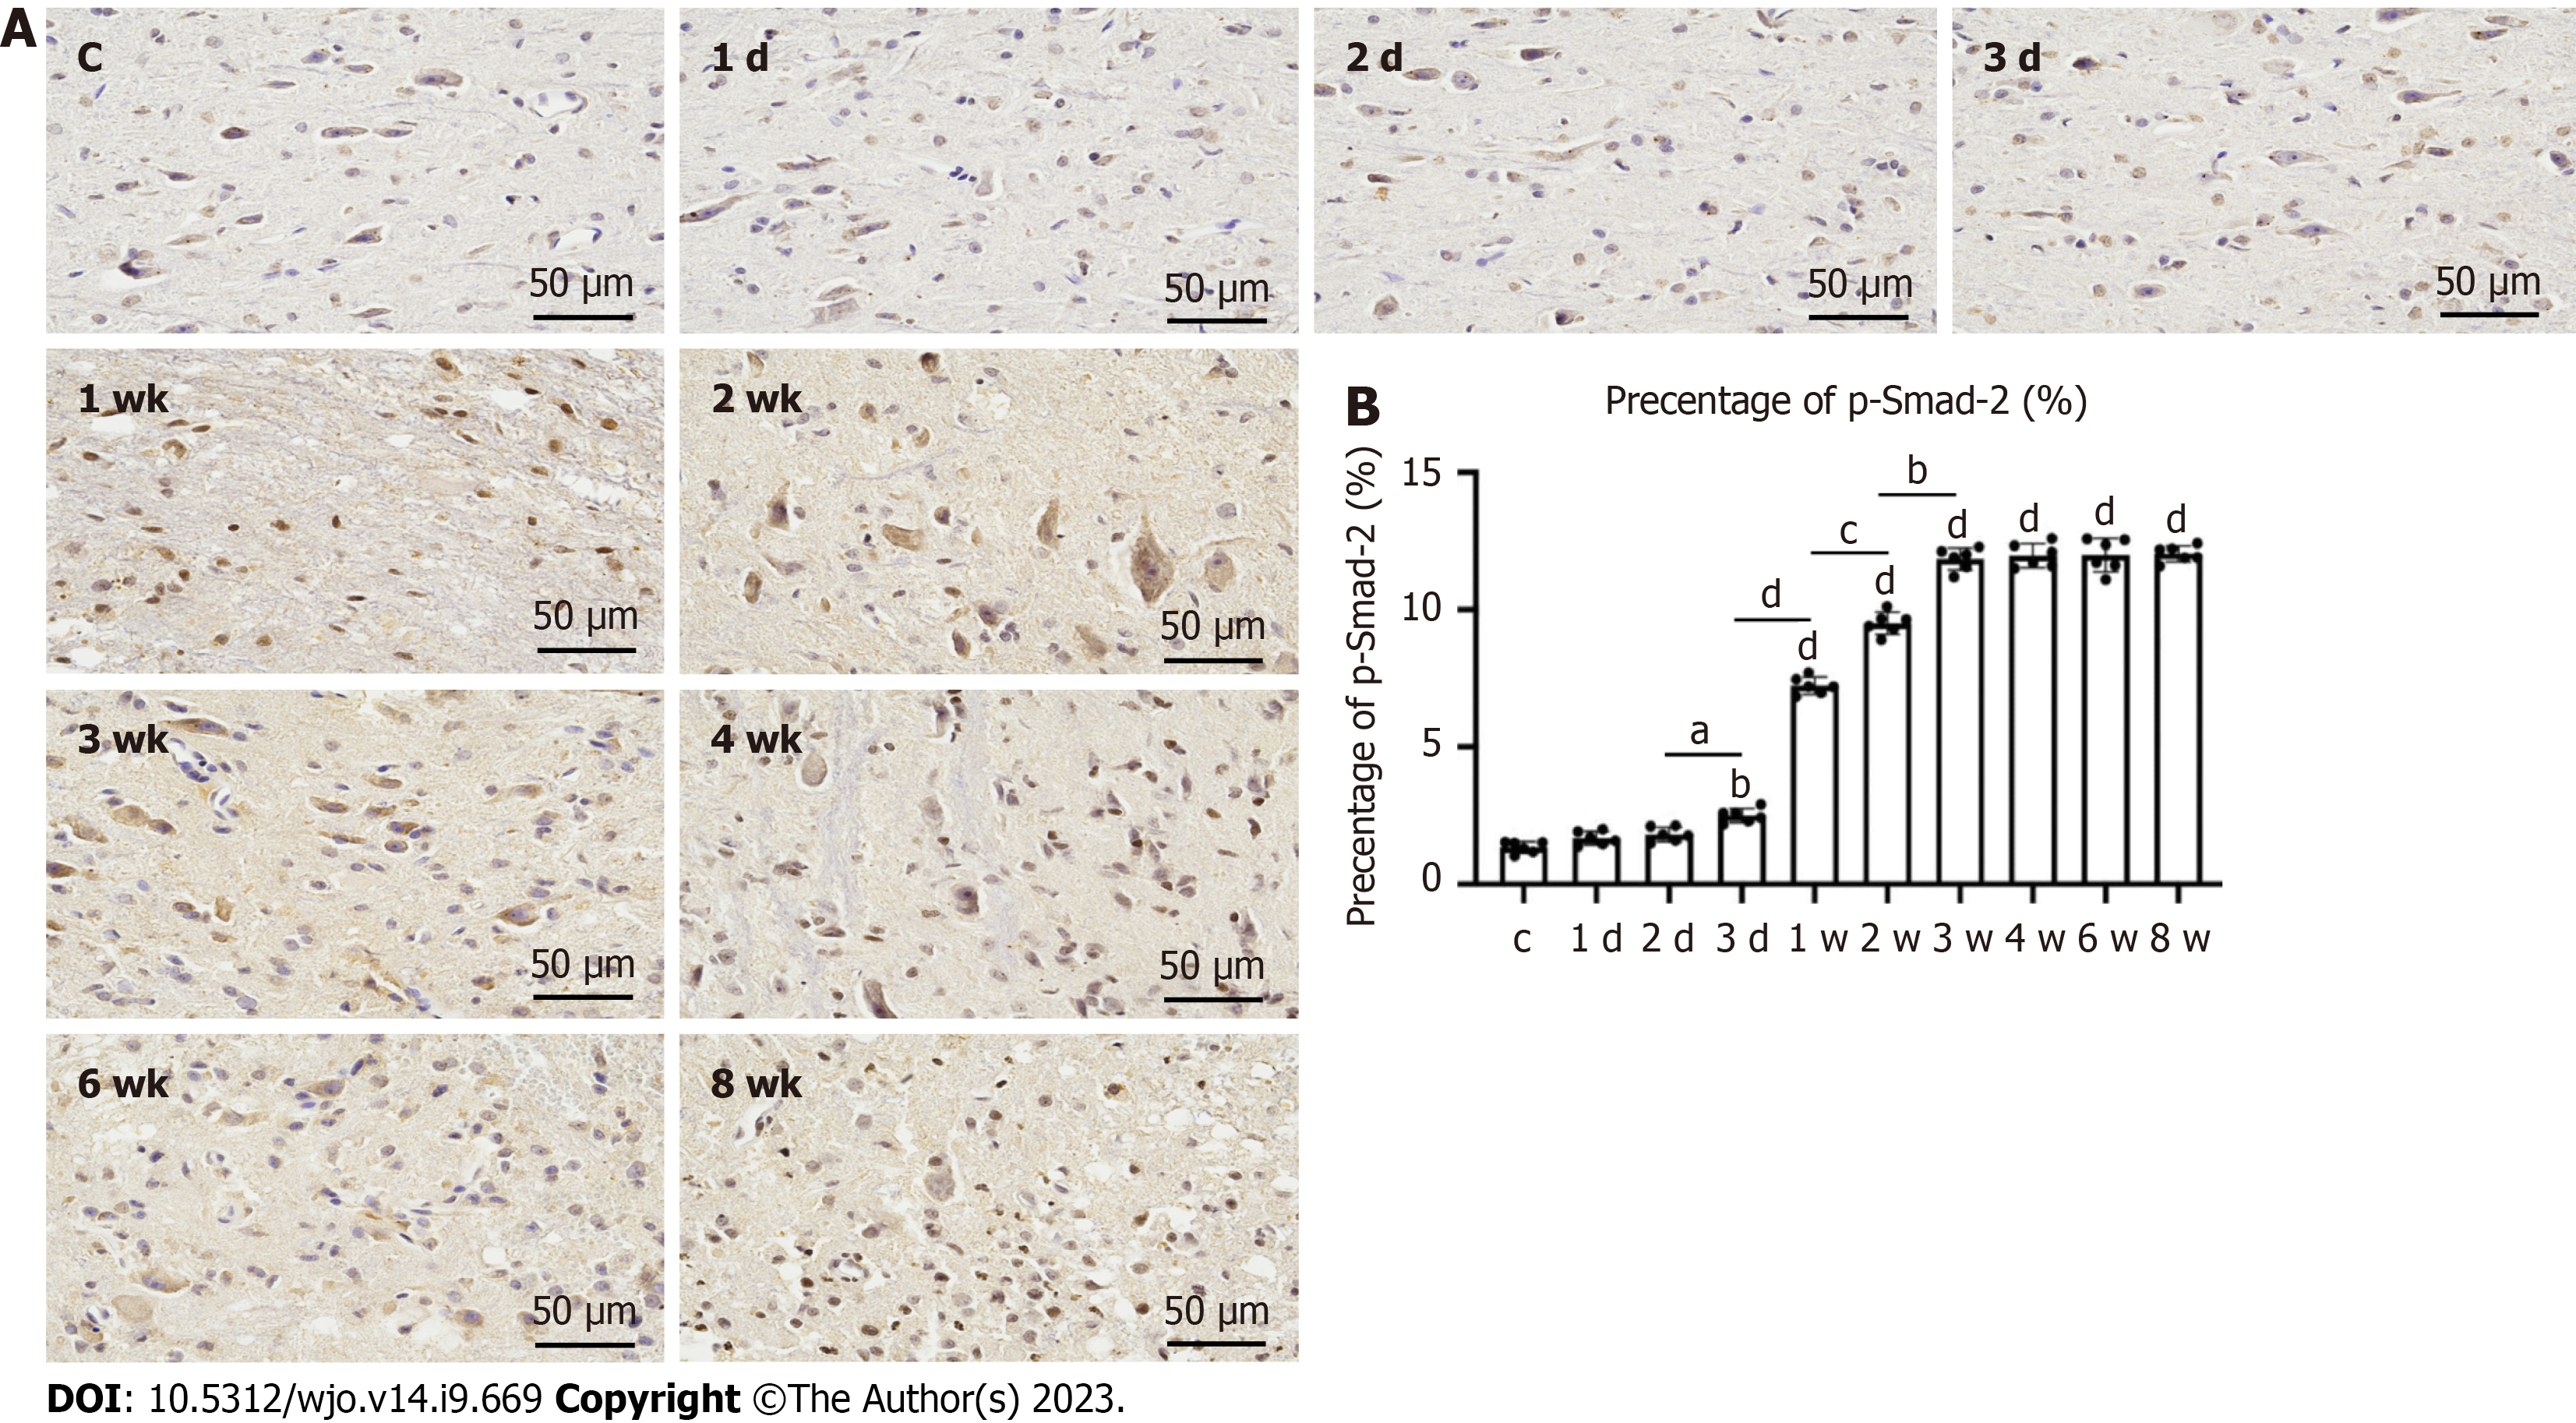
Figure 6 Immunohistochemistry findings.
A: Immunohistochemical staining of the anterior joint capsule; B: Percentage of the anterior articular joint capsule phosphorylated mothers against decapentaplegic homolog 2. aP < 0.05; bP < 0.01; cP < 0.001; dP < 0.0001.
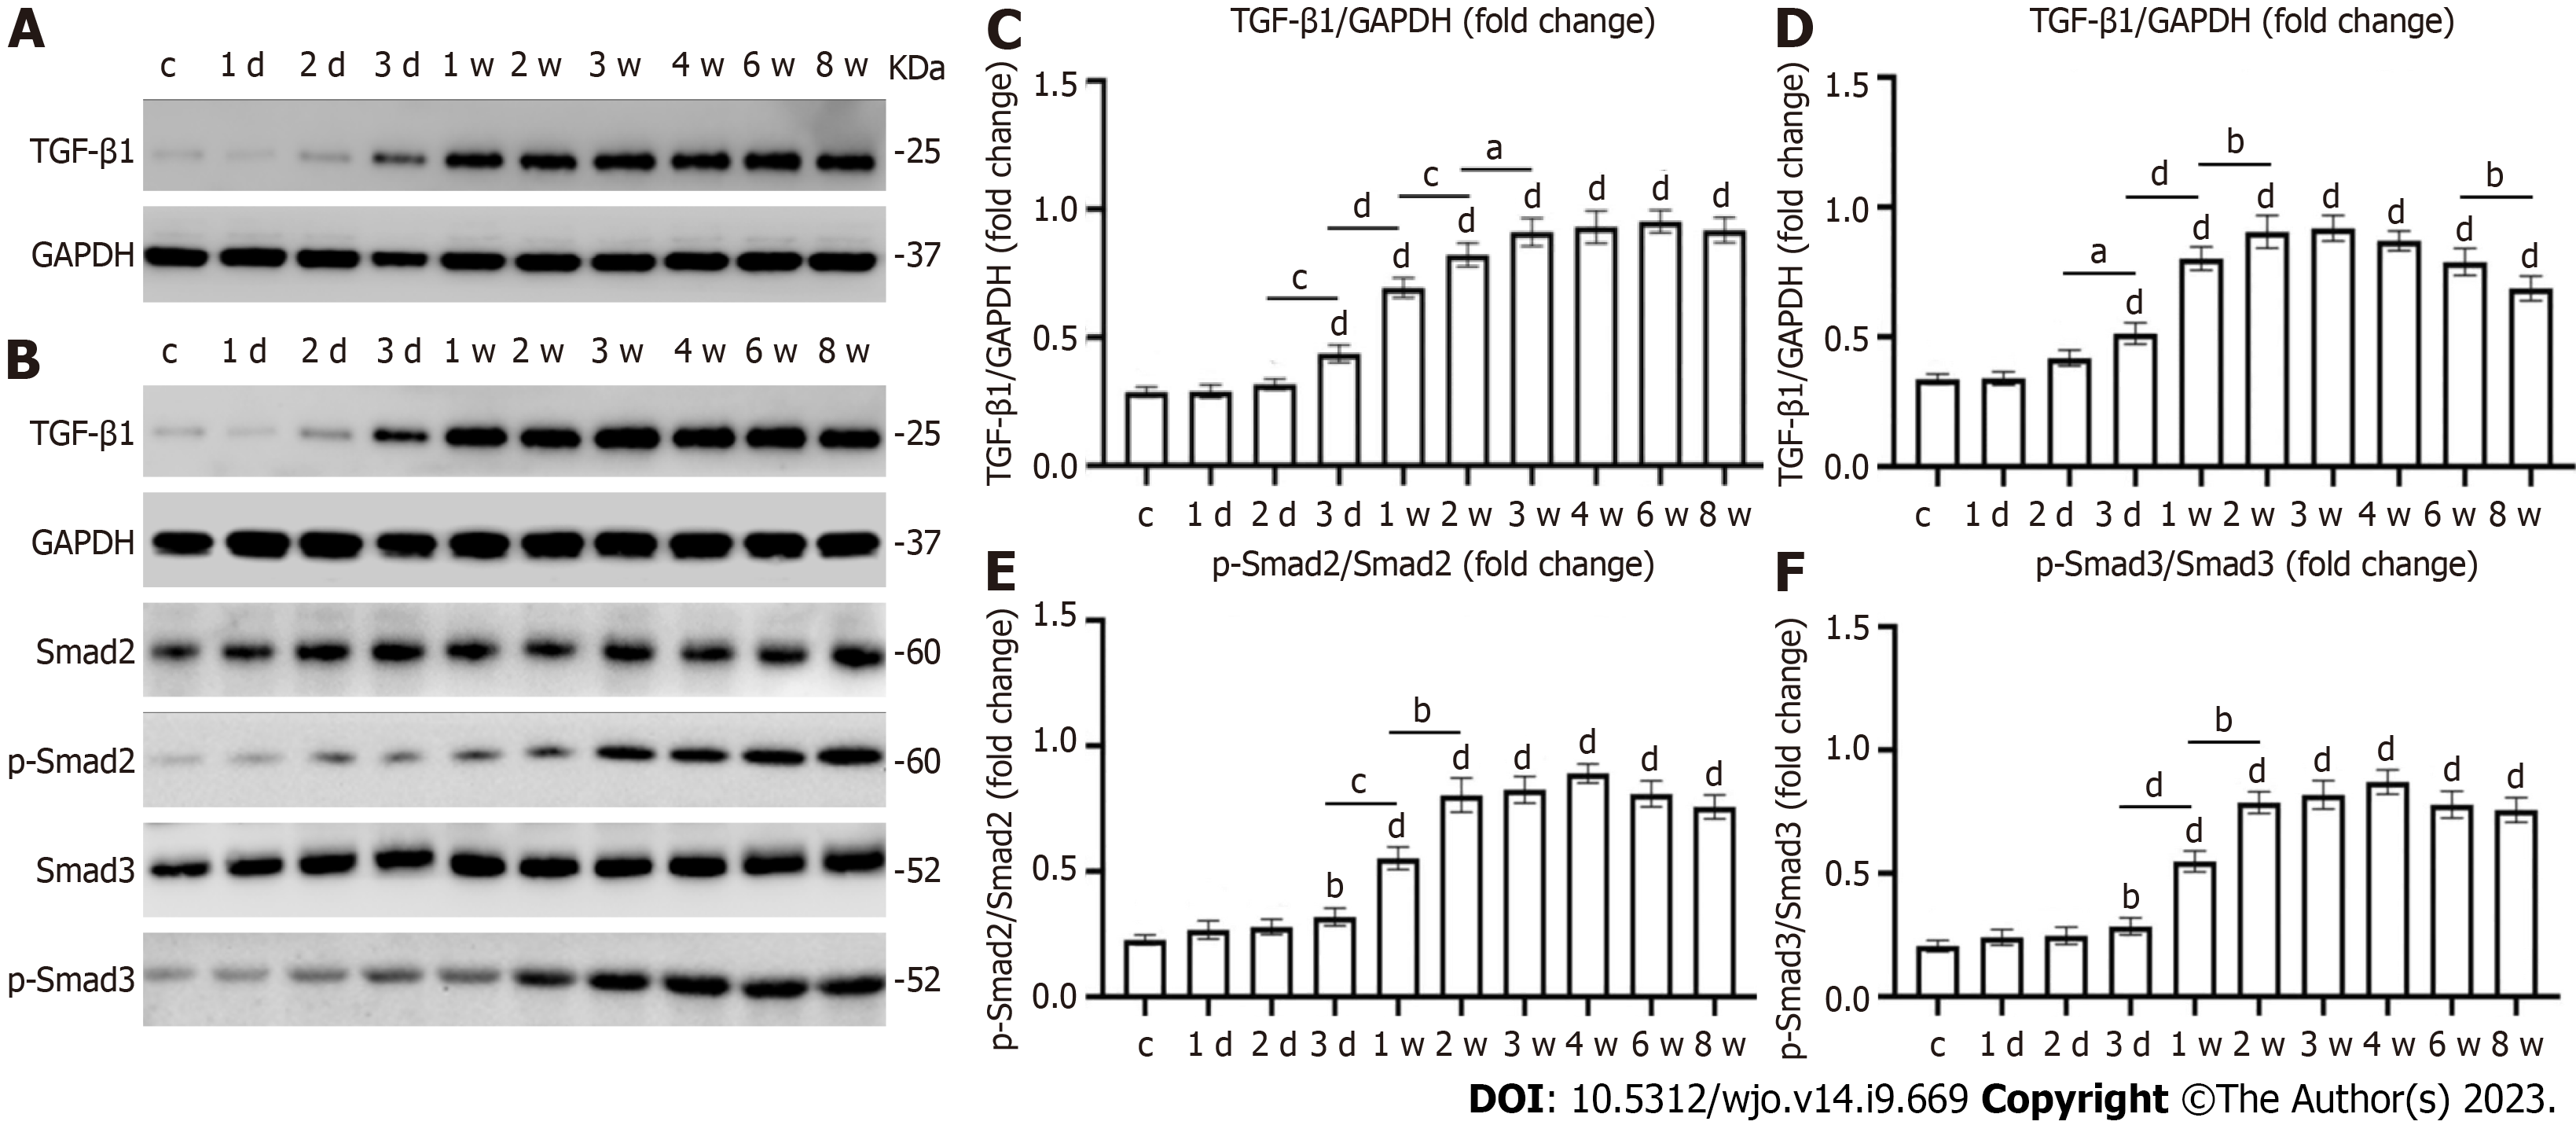
Figure 7 Western blot findings.
A: Changes in the intensity of transforming growth factor beta 1 (TGF-β1) and glyceraldehyde 3-phosphate dehydrogenase (GAPDH) bands in the anterior joint capsule; B: Changes in the intensity of TGF-β1/GAPDH, phosphorylated mothers against decapentaplegic homolog 2 (p-Smad2)/Smad2, p-Smad2/Smad2 bands in the quadriceps; C: Graphical representation of the expression level of TGF-β1 in the anterior joint capsule relative to GAPDH; D-F: Graphical representation of the expression level of TGF-β1/GAPDH, p-Smad2/Smad2, p-Smad2/Smad2. aP < 0.05; bP < 0.01; cP < 0.001; dP < 0.0001.
- Citation: Zhou CX, Wang F, Zhou Y, Fang QZ, Zhang QB. Formation process of extension knee joint contracture following external immobilization in rats. World J Orthop 2023; 14(9): 669-681
- URL: https://www.wjgnet.com/2218-5836/full/v14/i9/669.htm
- DOI: https://dx.doi.org/10.5312/wjo.v14.i9.669


