Copyright
©The Author(s) 2023.
World J Orthop. Aug 18, 2023; 14(8): 621-629
Published online Aug 18, 2023. doi: 10.5312/wjo.v14.i8.621
Published online Aug 18, 2023. doi: 10.5312/wjo.v14.i8.621
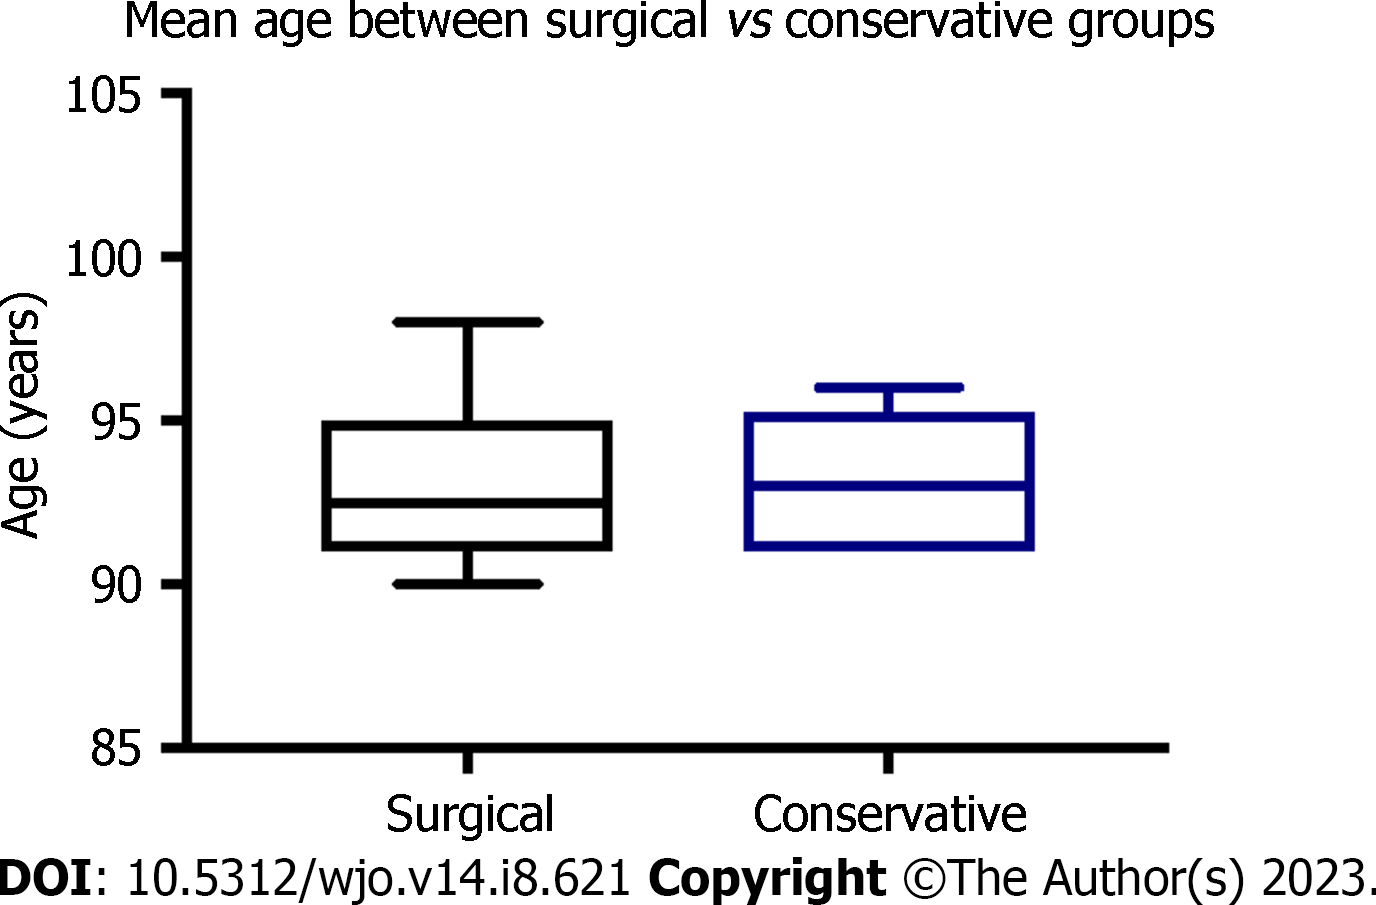
Figure 1 Mean of the patients age between surgical cohort (nonagenarians undergoing surgery) and conservative cohort (nonagenarians not undergoing surgery).
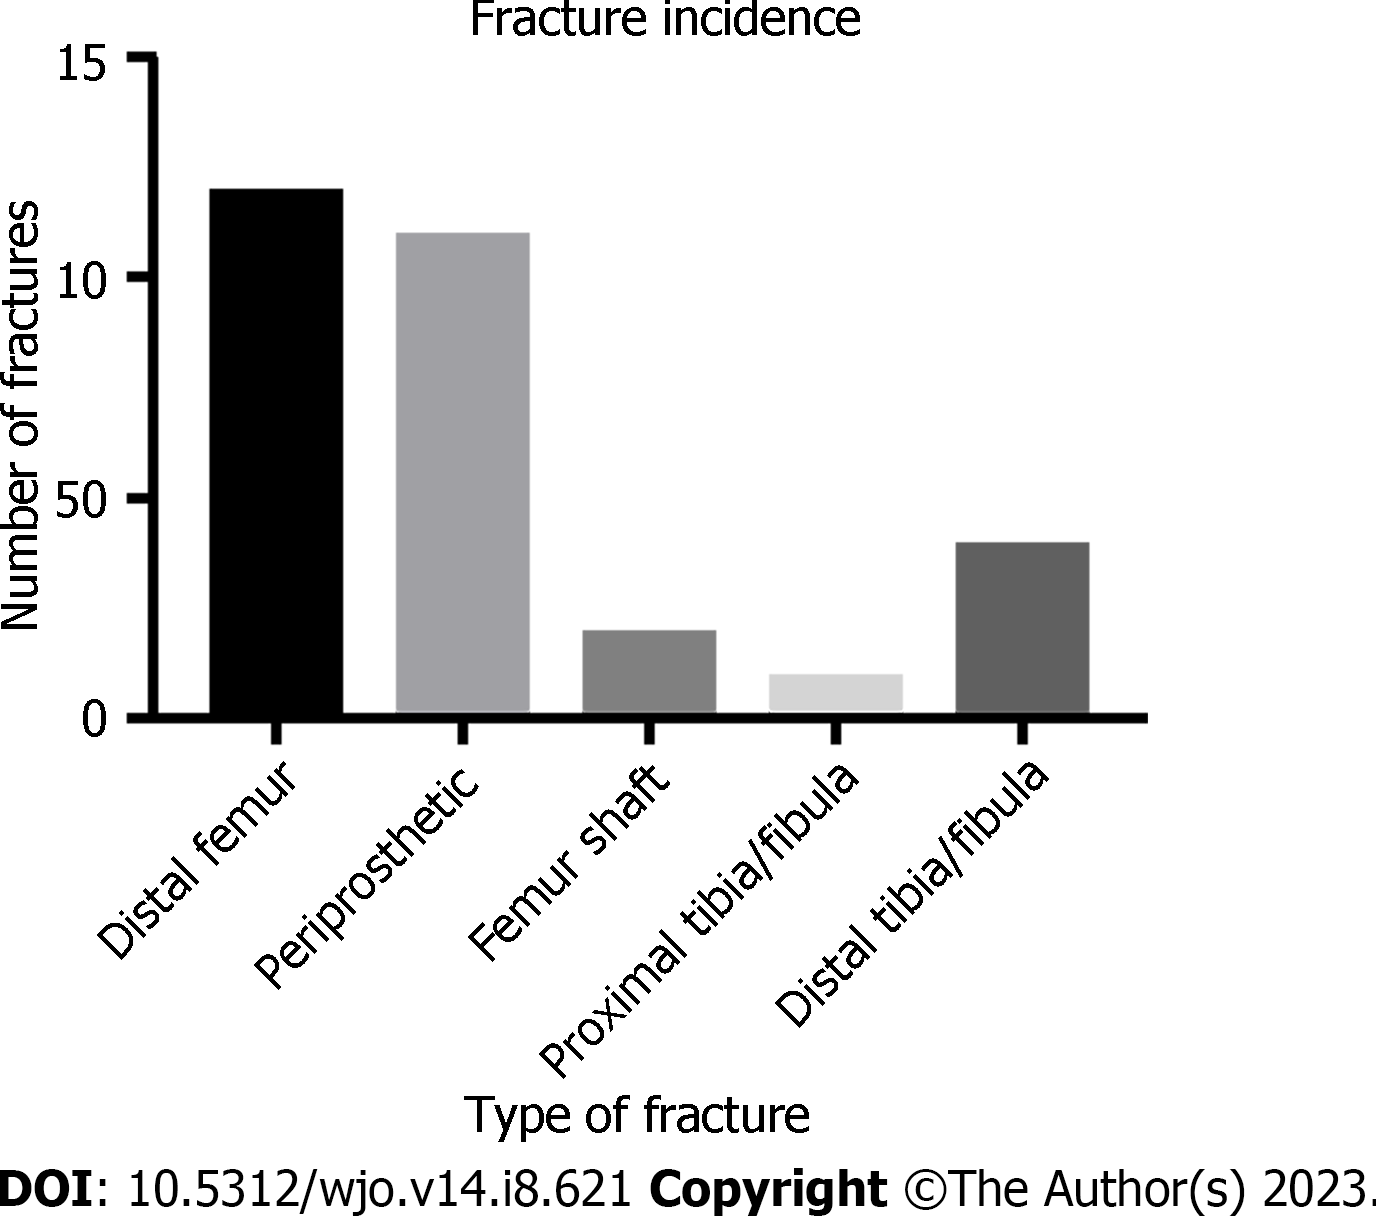
Figure 2 Anatomical fracture locations in both the surgical and conservative groups.
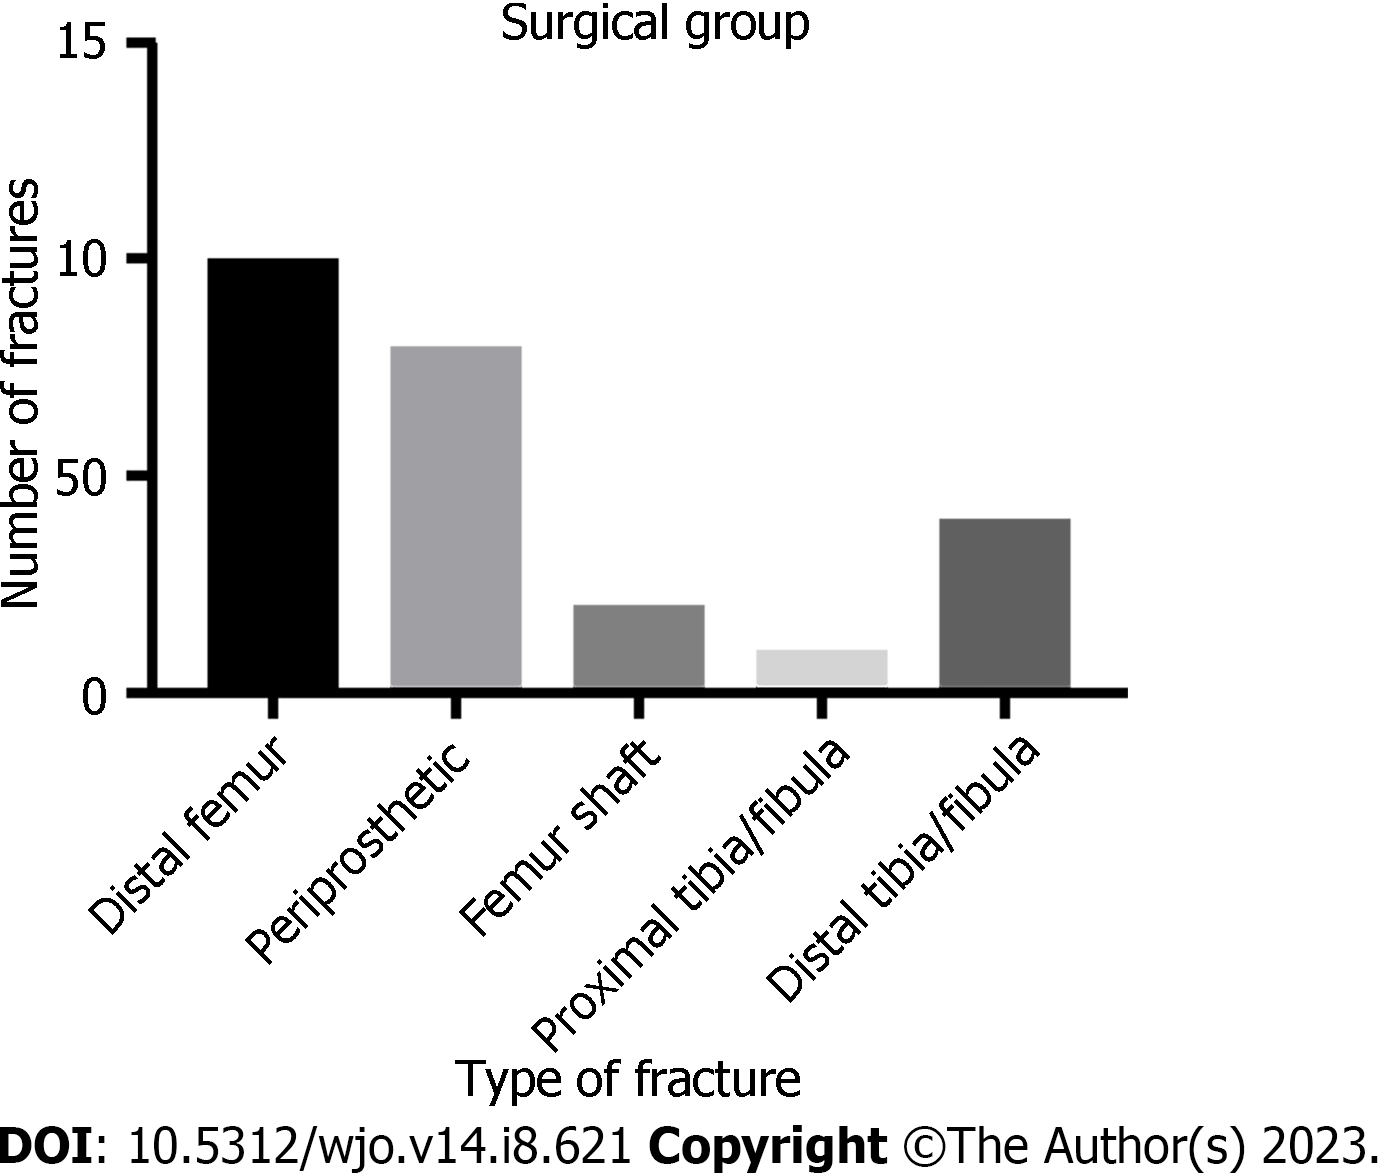
Figure 3 Anatomical location of fractures with their incidence in surgical group.
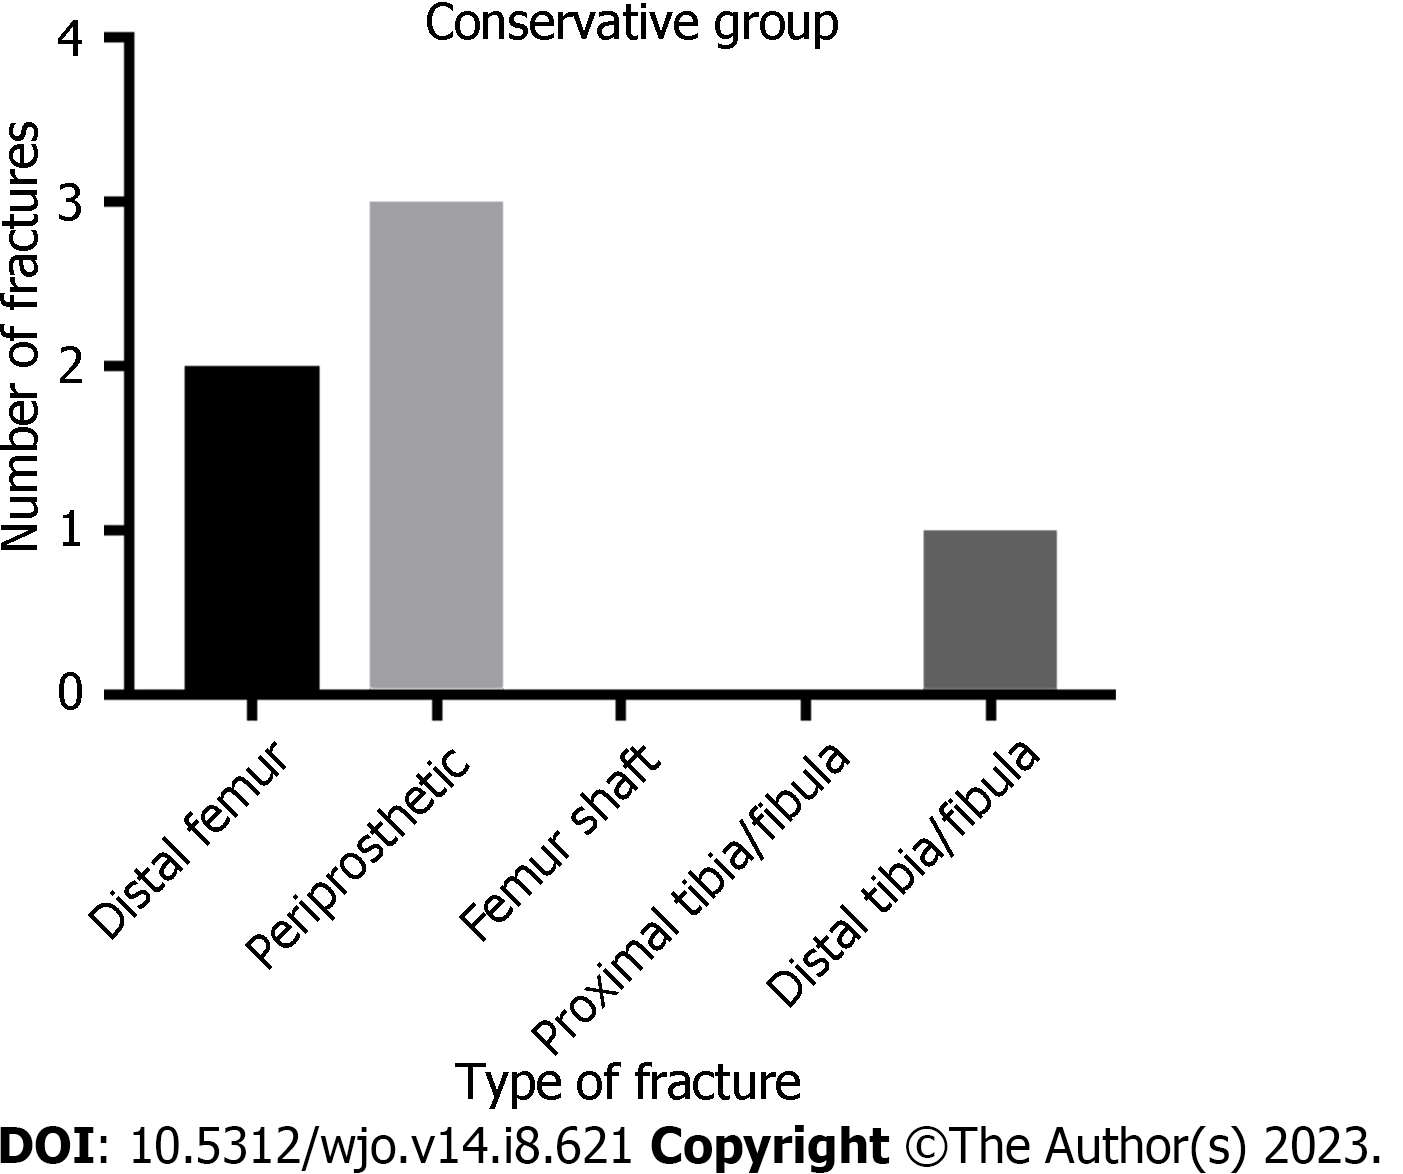
Figure 4 Anatomical location of fractures with their incidence in conservative group.
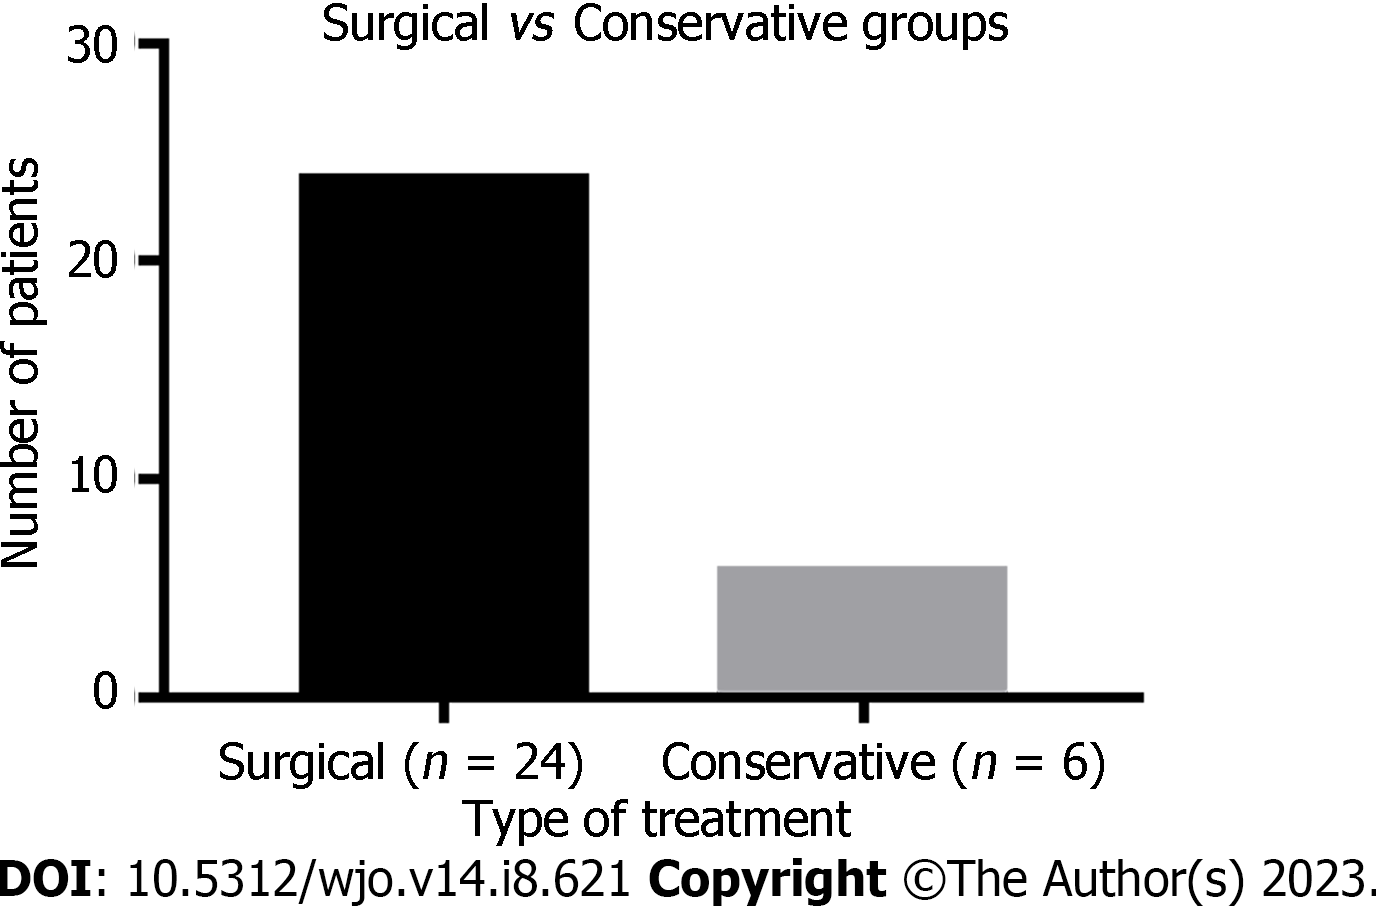
Figure 5 Number of patients respective to the management offered–surgical and conservative.
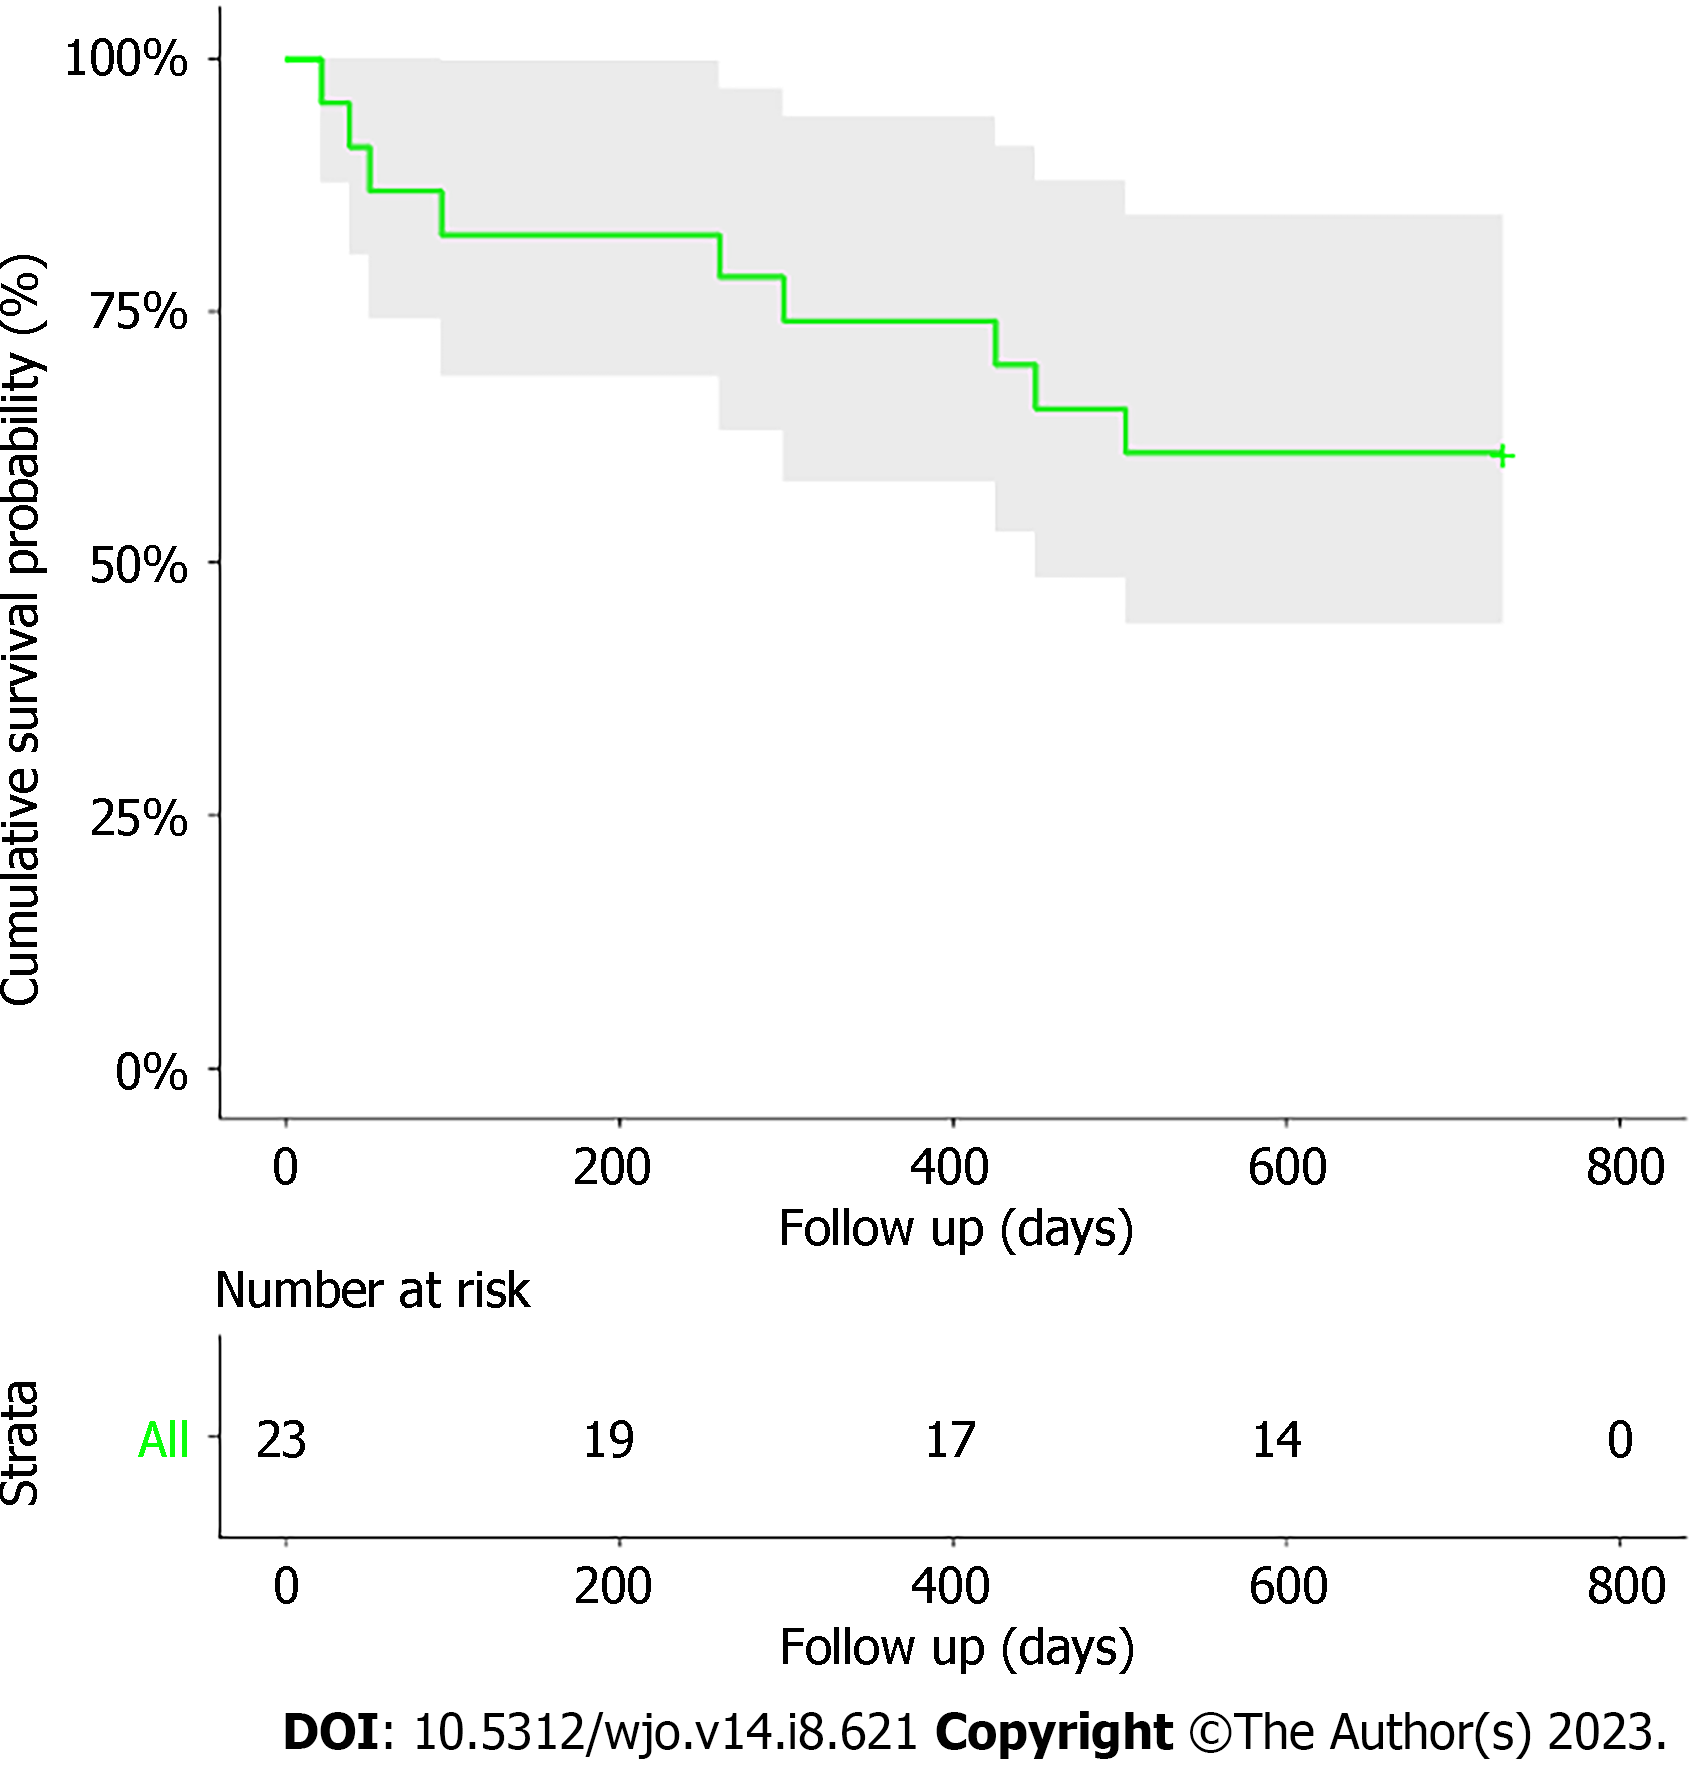
Figure 6 Cumulative survival probability (Y-axis) and follow-up in days (X-axis) showing survival analysis curve in Surgical group.
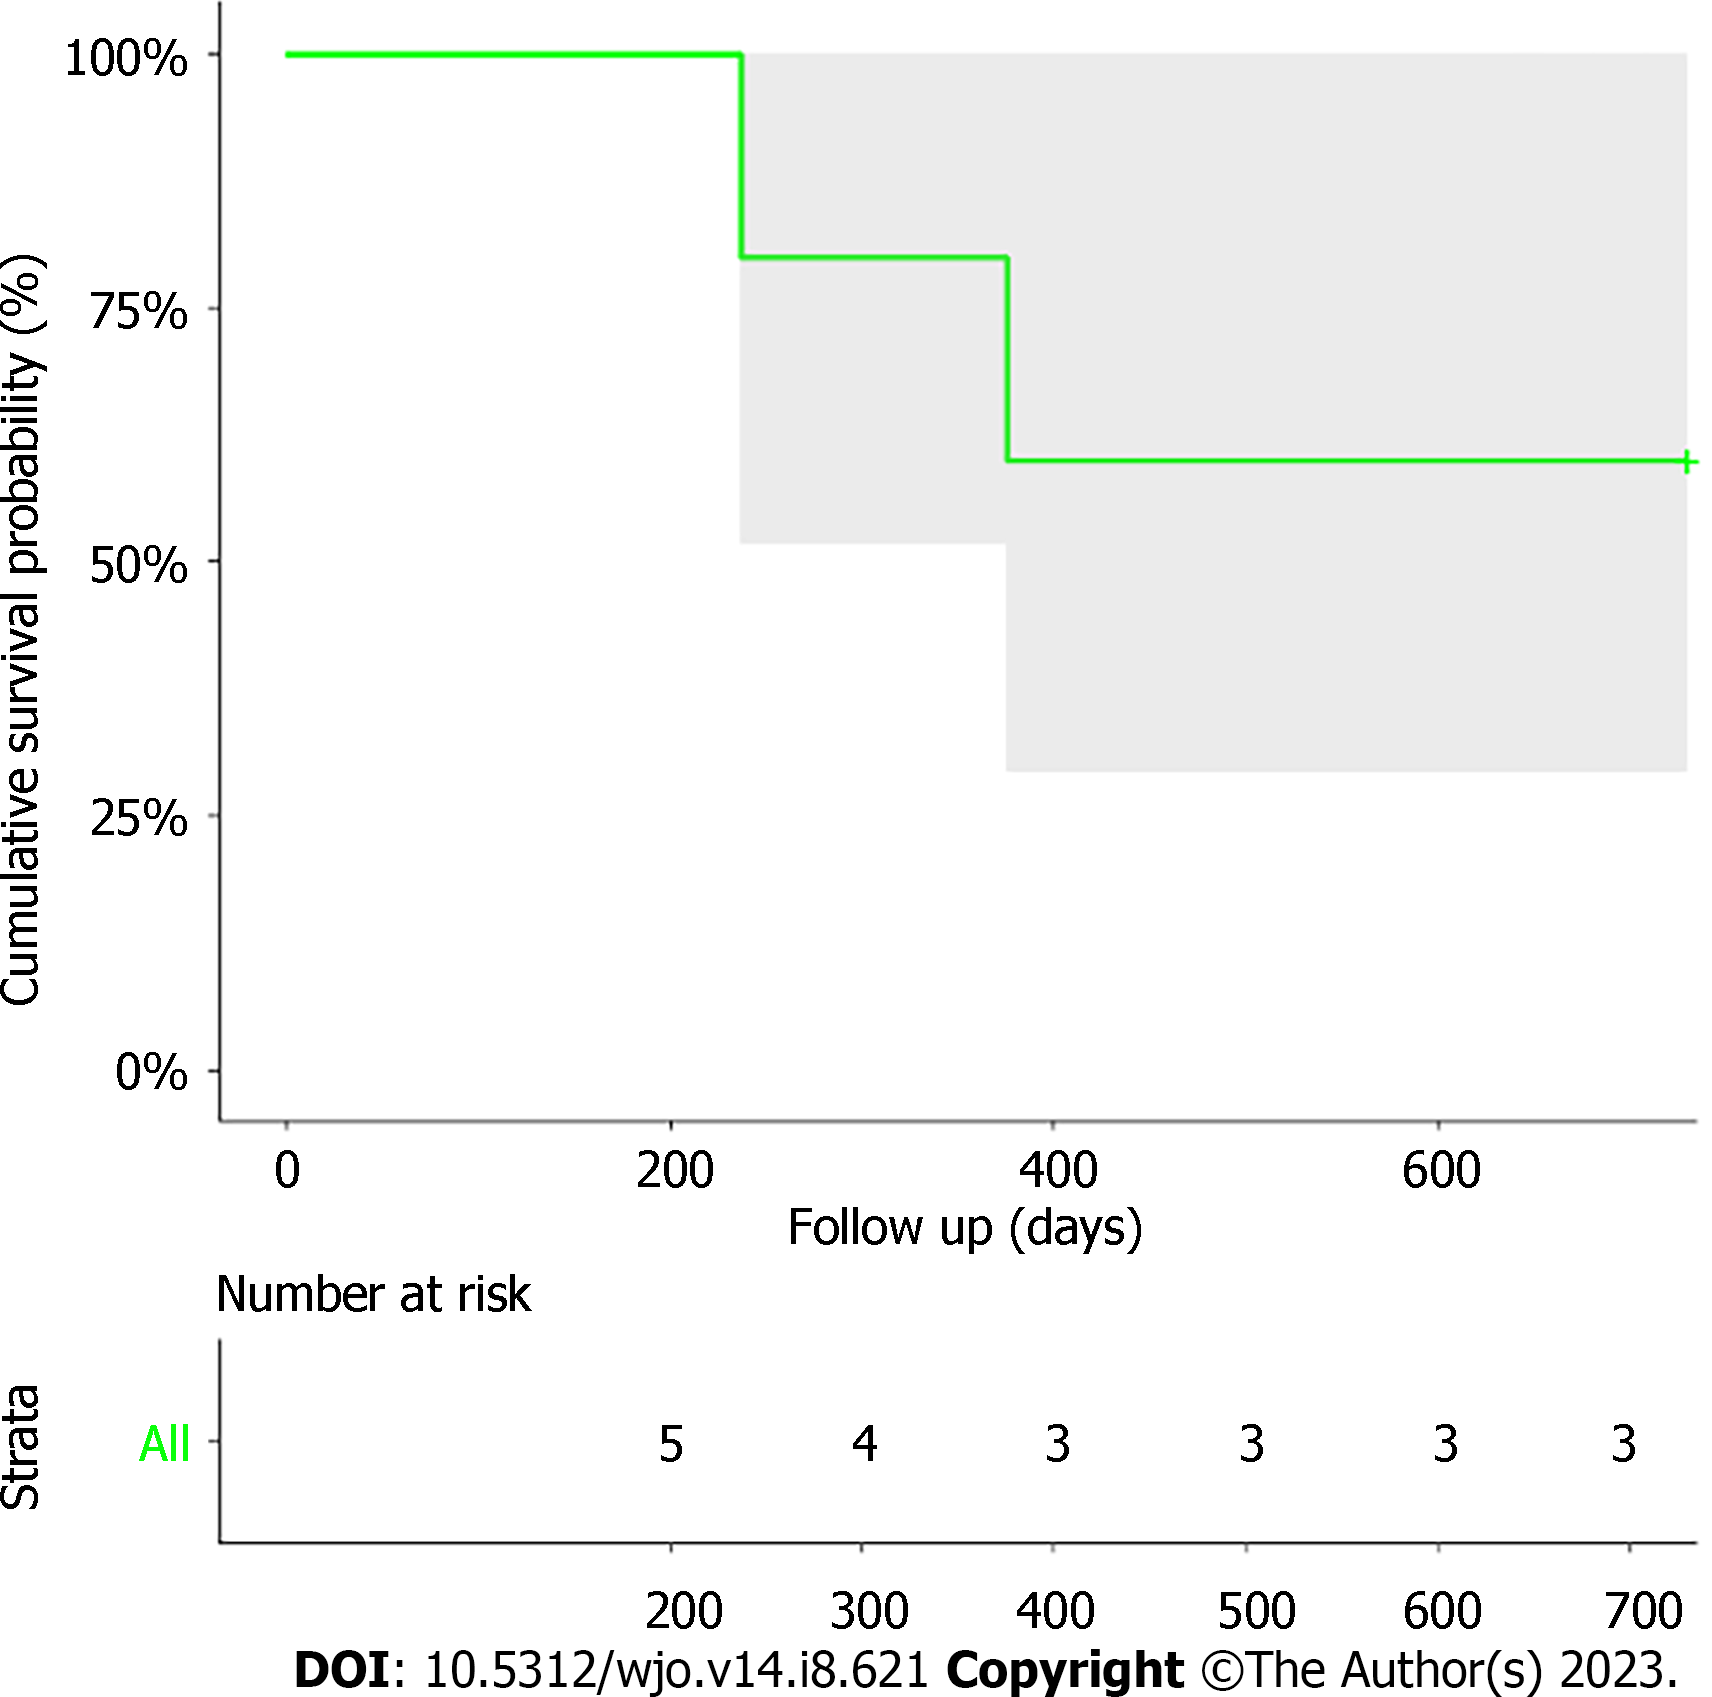
Figure 7 Cumulative survival probability (Y-axis) and follow-up in days (X-axis) showing survival analysis curve for conservative group.
- Citation: Narayana Murthy S, Cheruvu MS, Siddiqui RS, Sharma N, Dass D, Ali A. Survival analysis in nonagenarian patients with non-hip lower limb fractures. World J Orthop 2023; 14(8): 621-629
- URL: https://www.wjgnet.com/2218-5836/full/v14/i8/621.htm
- DOI: https://dx.doi.org/10.5312/wjo.v14.i8.621


