Copyright
©The Author(s) 2023.
World J Orthop. Mar 18, 2023; 14(3): 123-135
Published online Mar 18, 2023. doi: 10.5312/wjo.v14.i3.123
Published online Mar 18, 2023. doi: 10.5312/wjo.v14.i3.123
Figure 1 Perioperative surgical model (adapted from[4]).
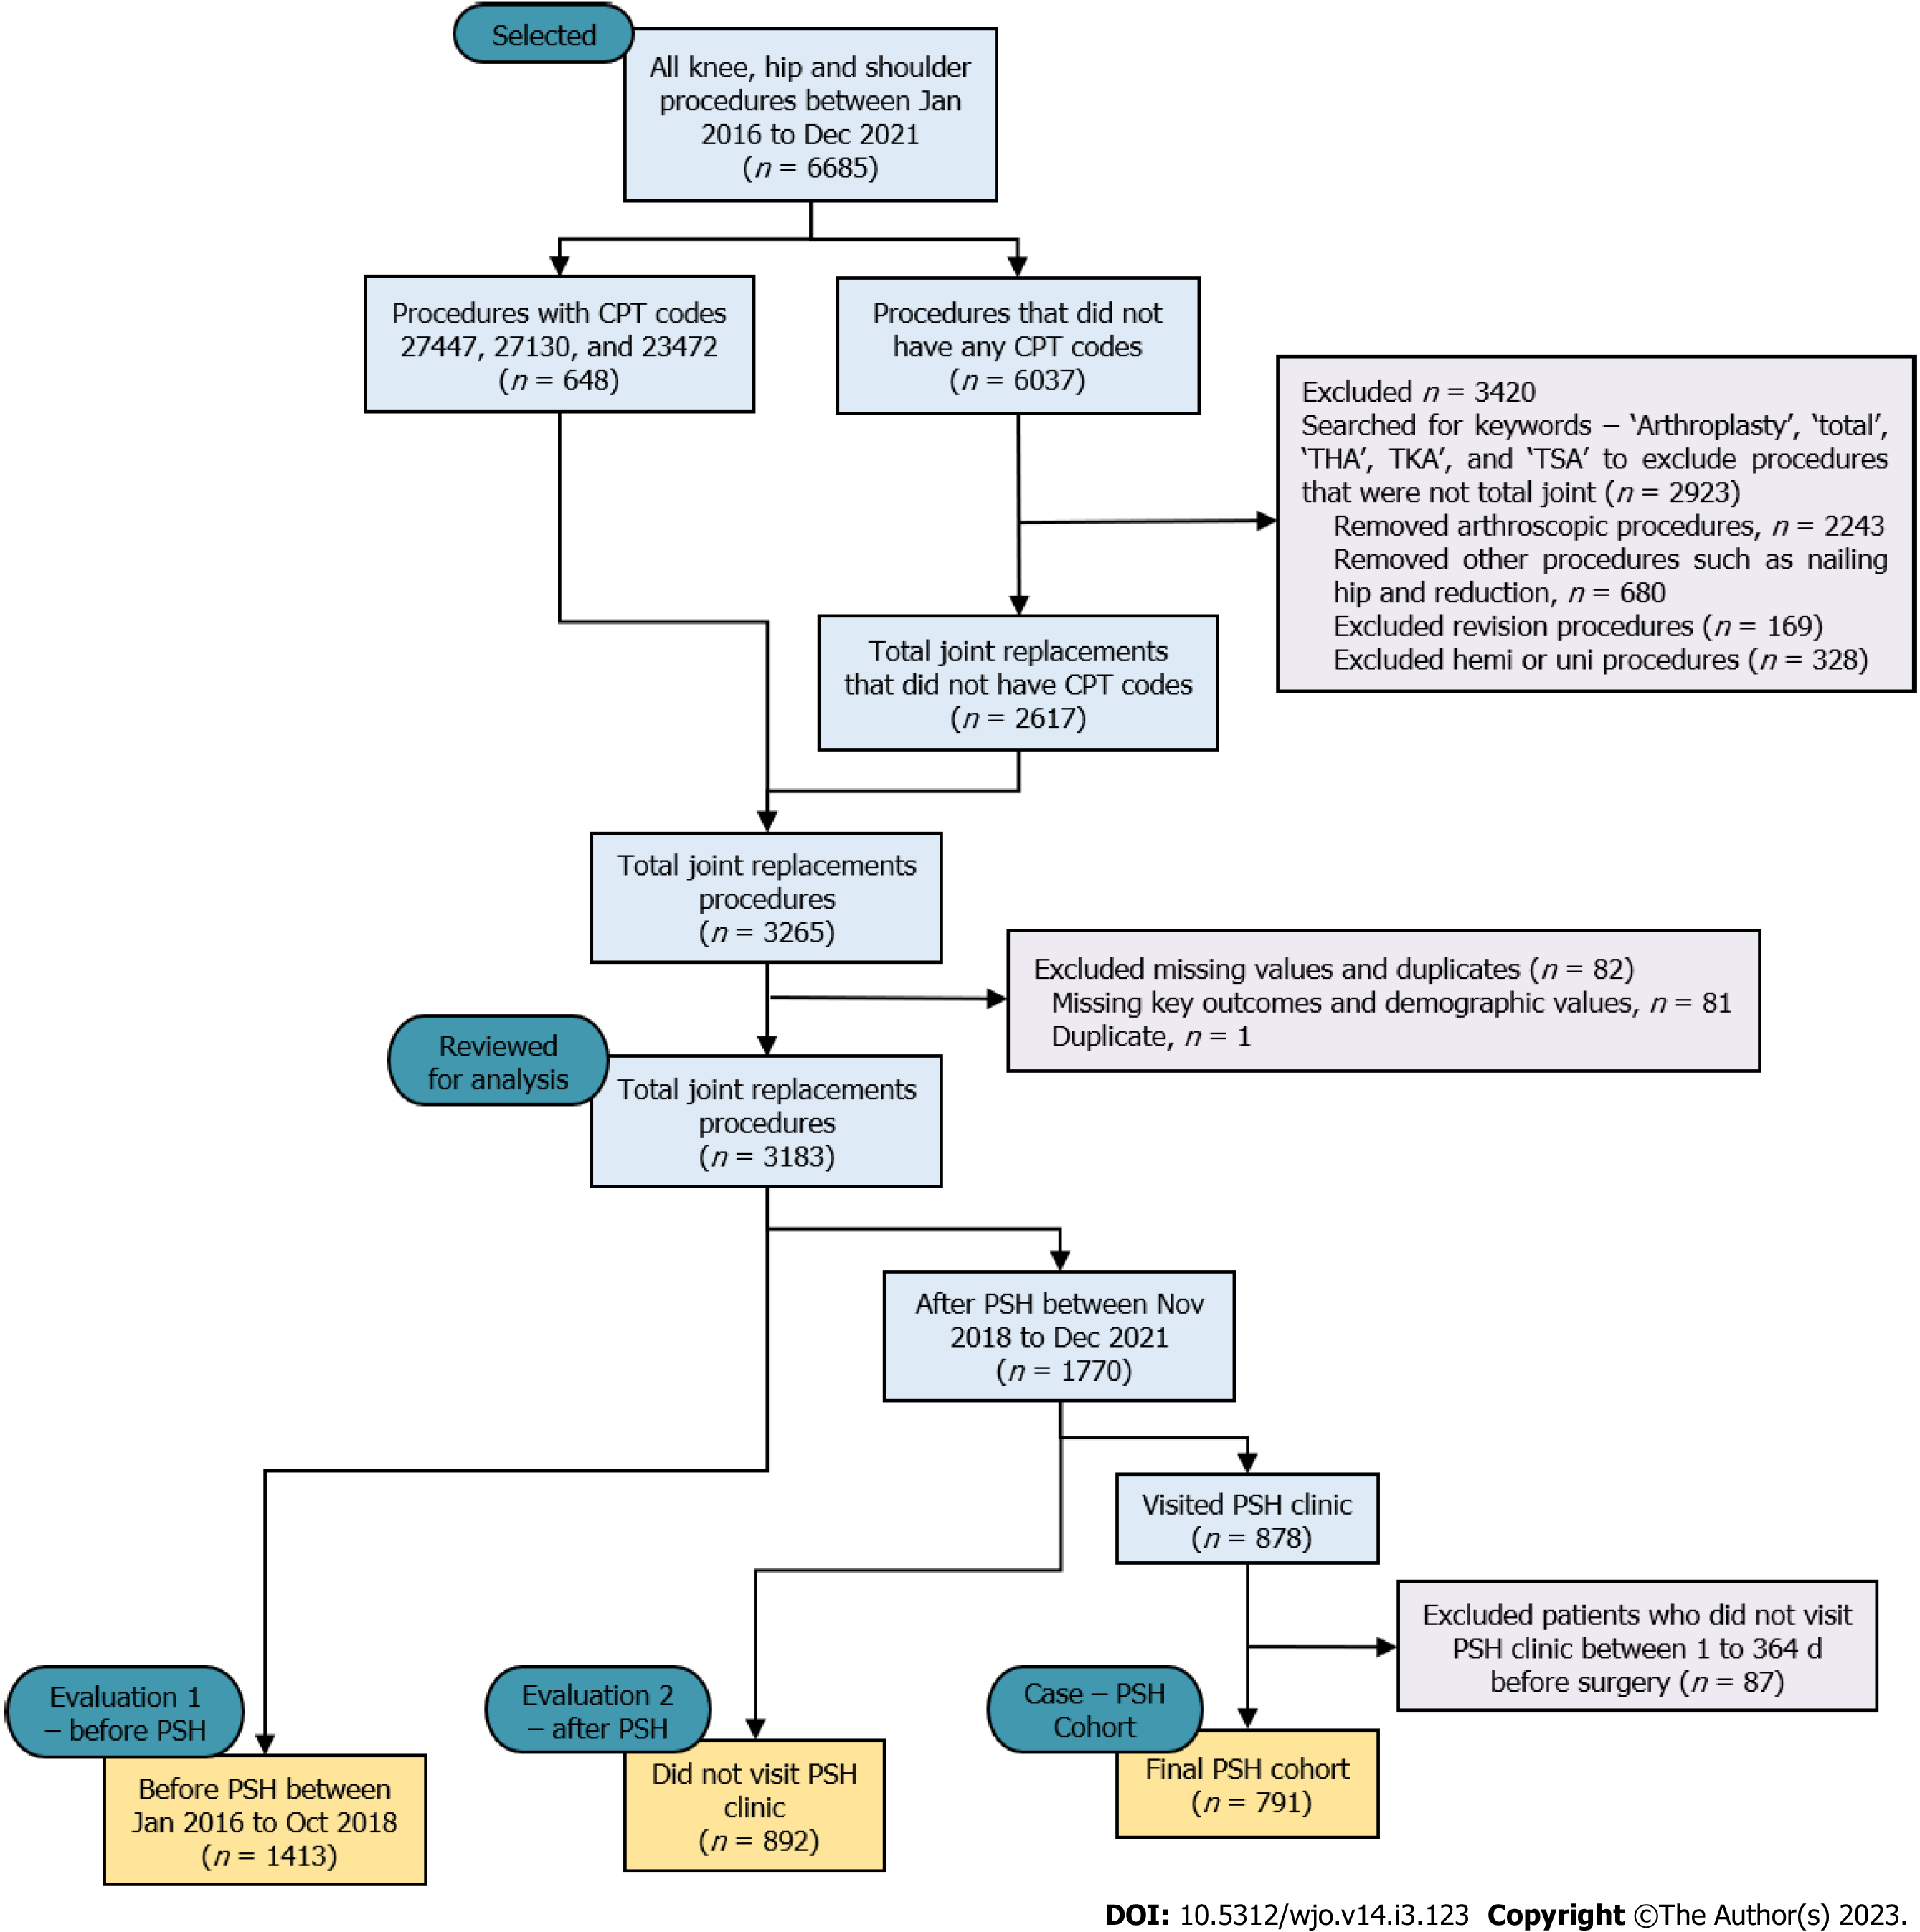
Figure 2 CONSORT diagram for perioperative surgical home case-control study.
PSH: Perioperative surgical home.
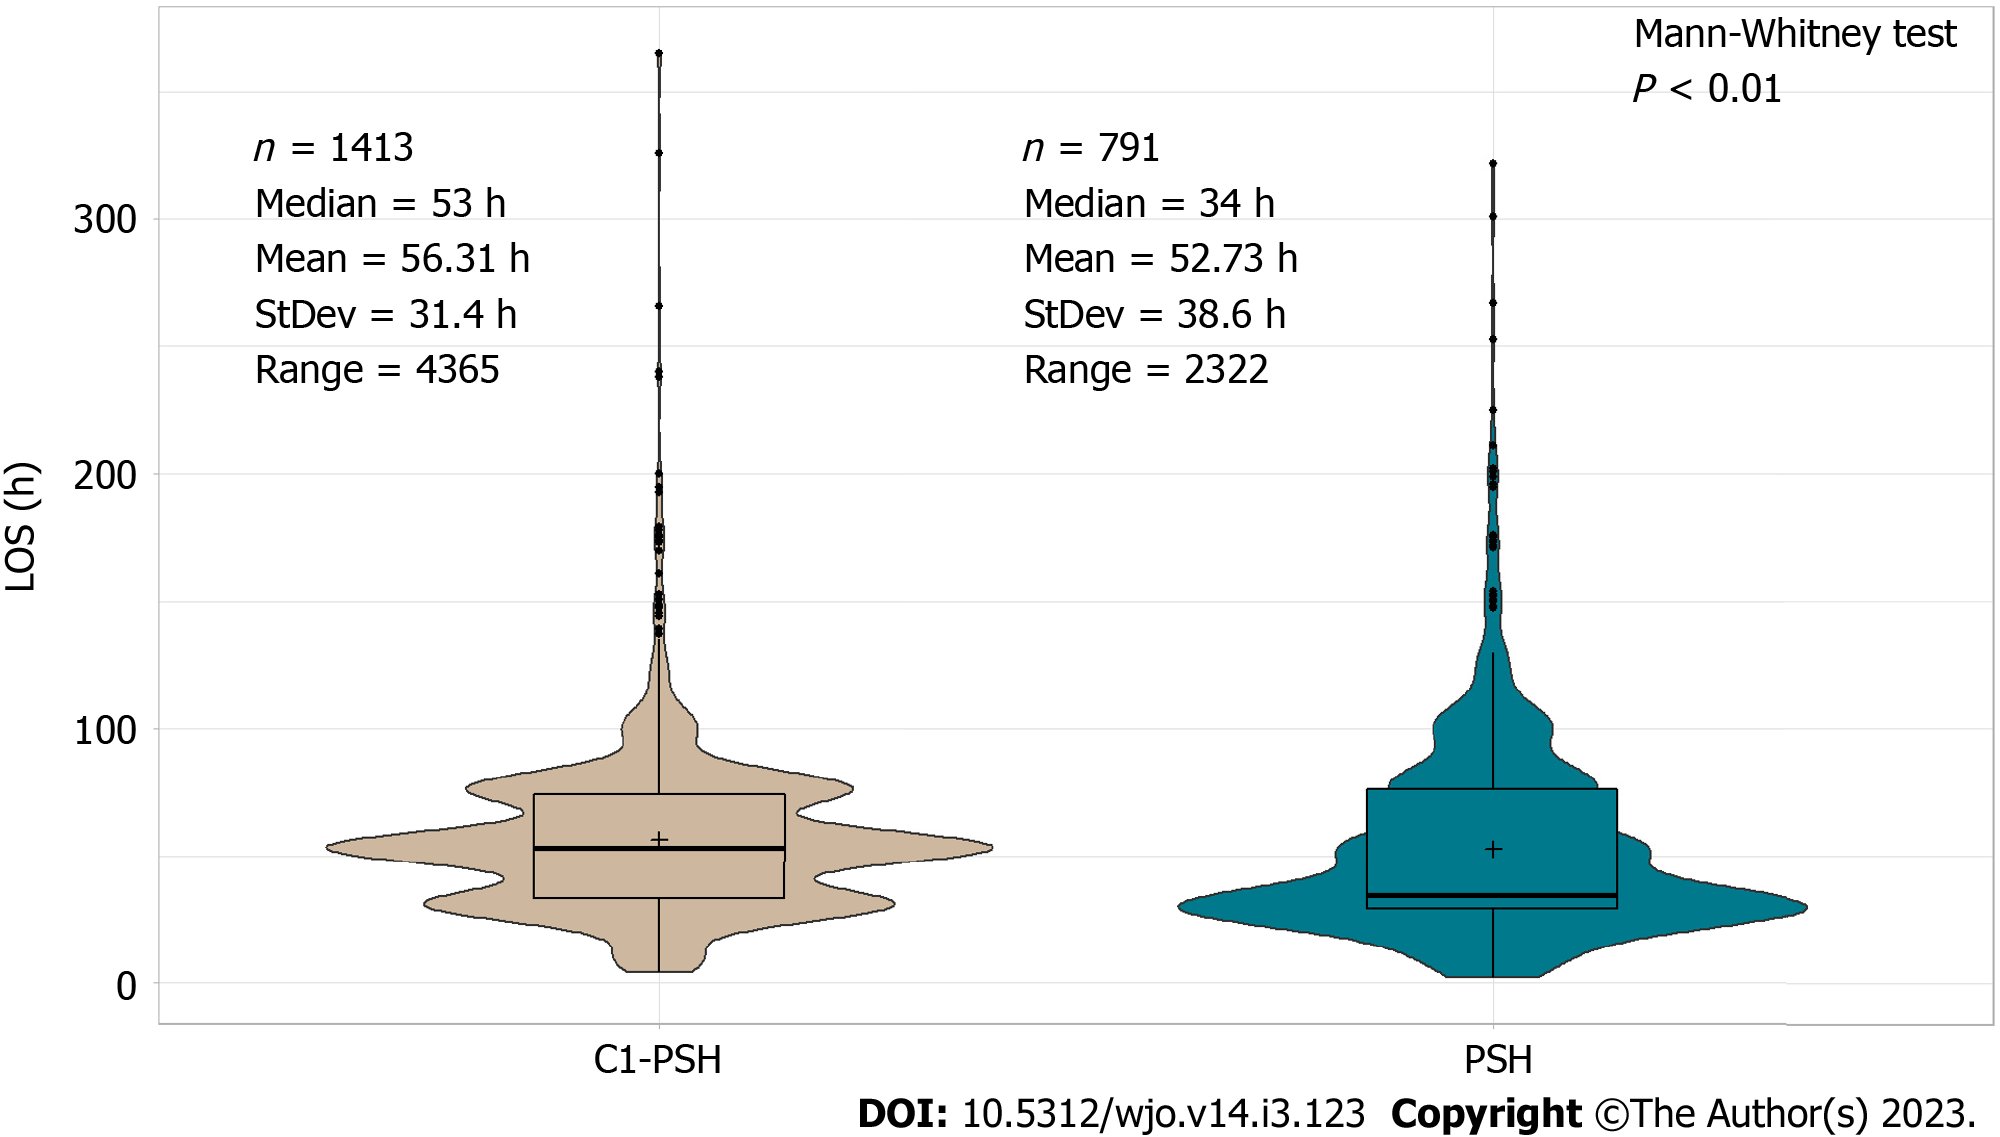
Figure 3 Length of stay distributional difference between the Control-1 perioperative surgical home and perioperative surgical home cohort.
PSH: Perioperative surgical home; C1-PSH: Control-1 PSH.
Figure 4 Discharge disposition and readmission between the Control-1 perioperative surgical home cohort and perioperative surgical home cohort.
PSH: Perioperative surgical home; C1-PSH: Control-1 PSH; C2-PSH: Control-2 PSH.
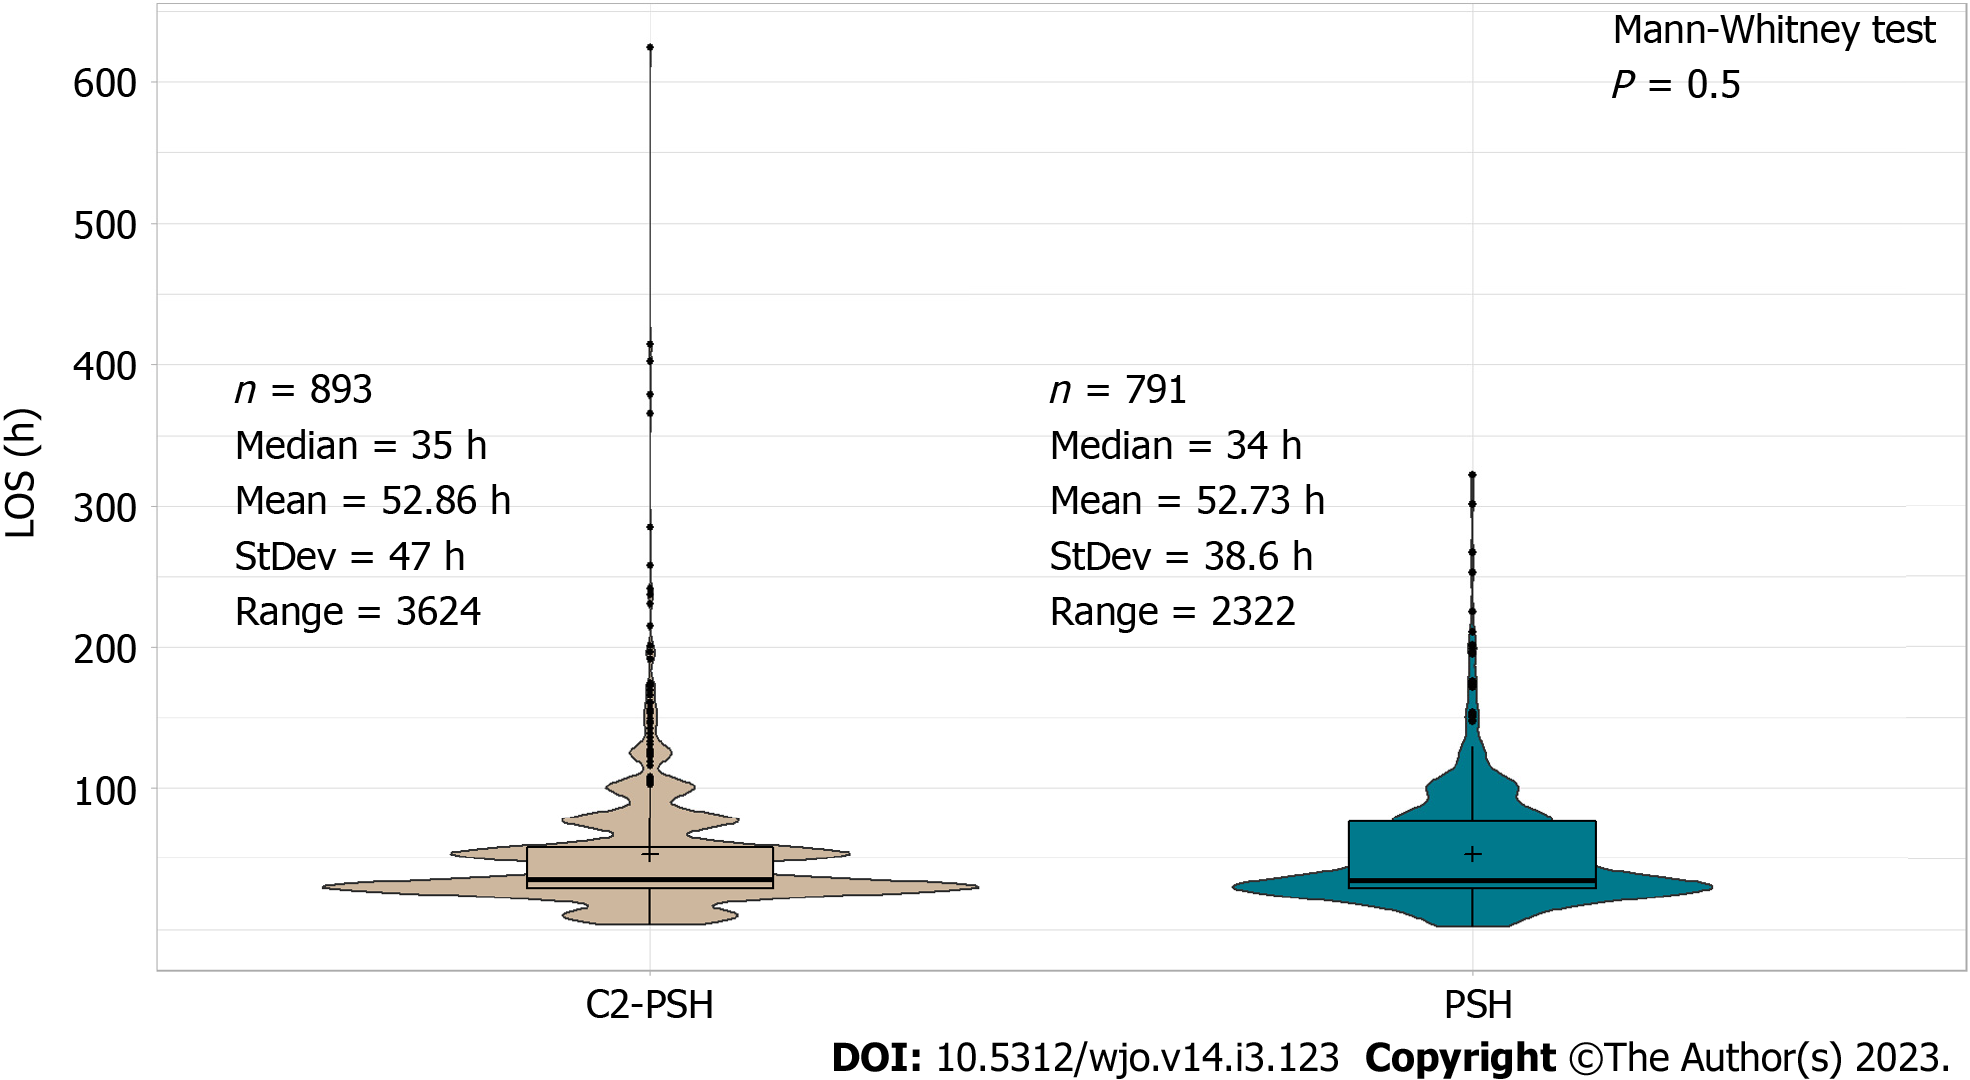
Figure 5 Length of stay distributional difference between Control-2 perioperative surgical home and perioperative surgical home cohort.
PSH: Perioperative surgical home; C2-PSH: Control-2 PSH.
Figure 6 Discharge disposition and readmission between the Control-2 perioperative surgical home cohort and perioperative surgical home cohort.
PSH: Perioperative surgical home; C2-PSH: Control-2 PSH.
- Citation: Sridhar S, Mouat-Hunter A, McCrory B. Rural implementation of the perioperative surgical home: A case-control study. World J Orthop 2023; 14(3): 123-135
- URL: https://www.wjgnet.com/2218-5836/full/v14/i3/123.htm
- DOI: https://dx.doi.org/10.5312/wjo.v14.i3.123


