Copyright
©The Author(s) 2023.
World J Orthop. Dec 18, 2023; 14(12): 878-888
Published online Dec 18, 2023. doi: 10.5312/wjo.v14.i12.878
Published online Dec 18, 2023. doi: 10.5312/wjo.v14.i12.878
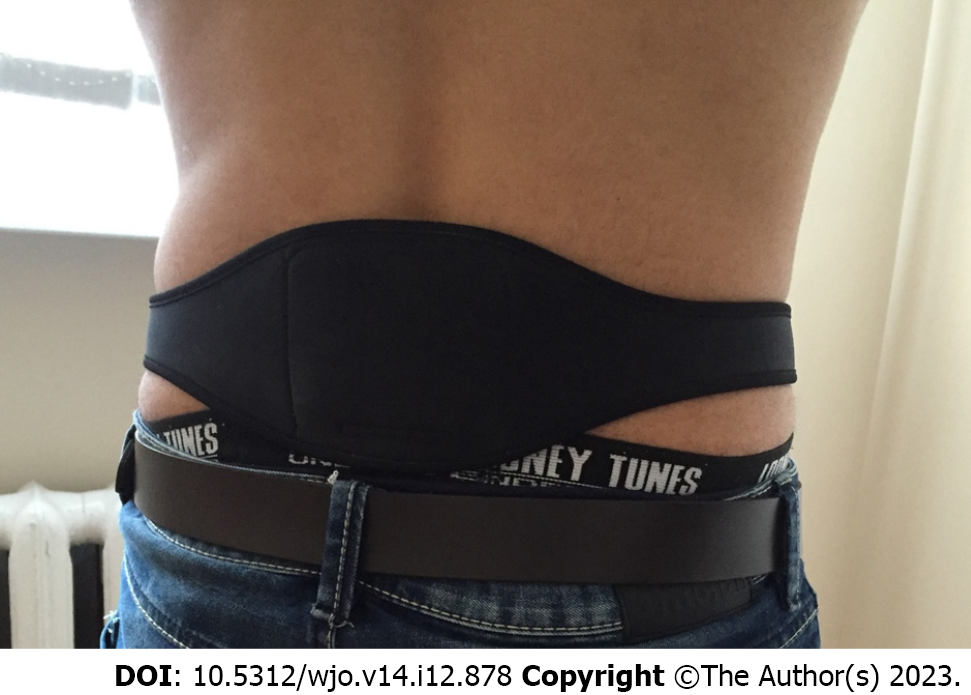
Figure 1 Dr Allen’s Device for Low Back Pain Treatment applied to the affected lower back area.
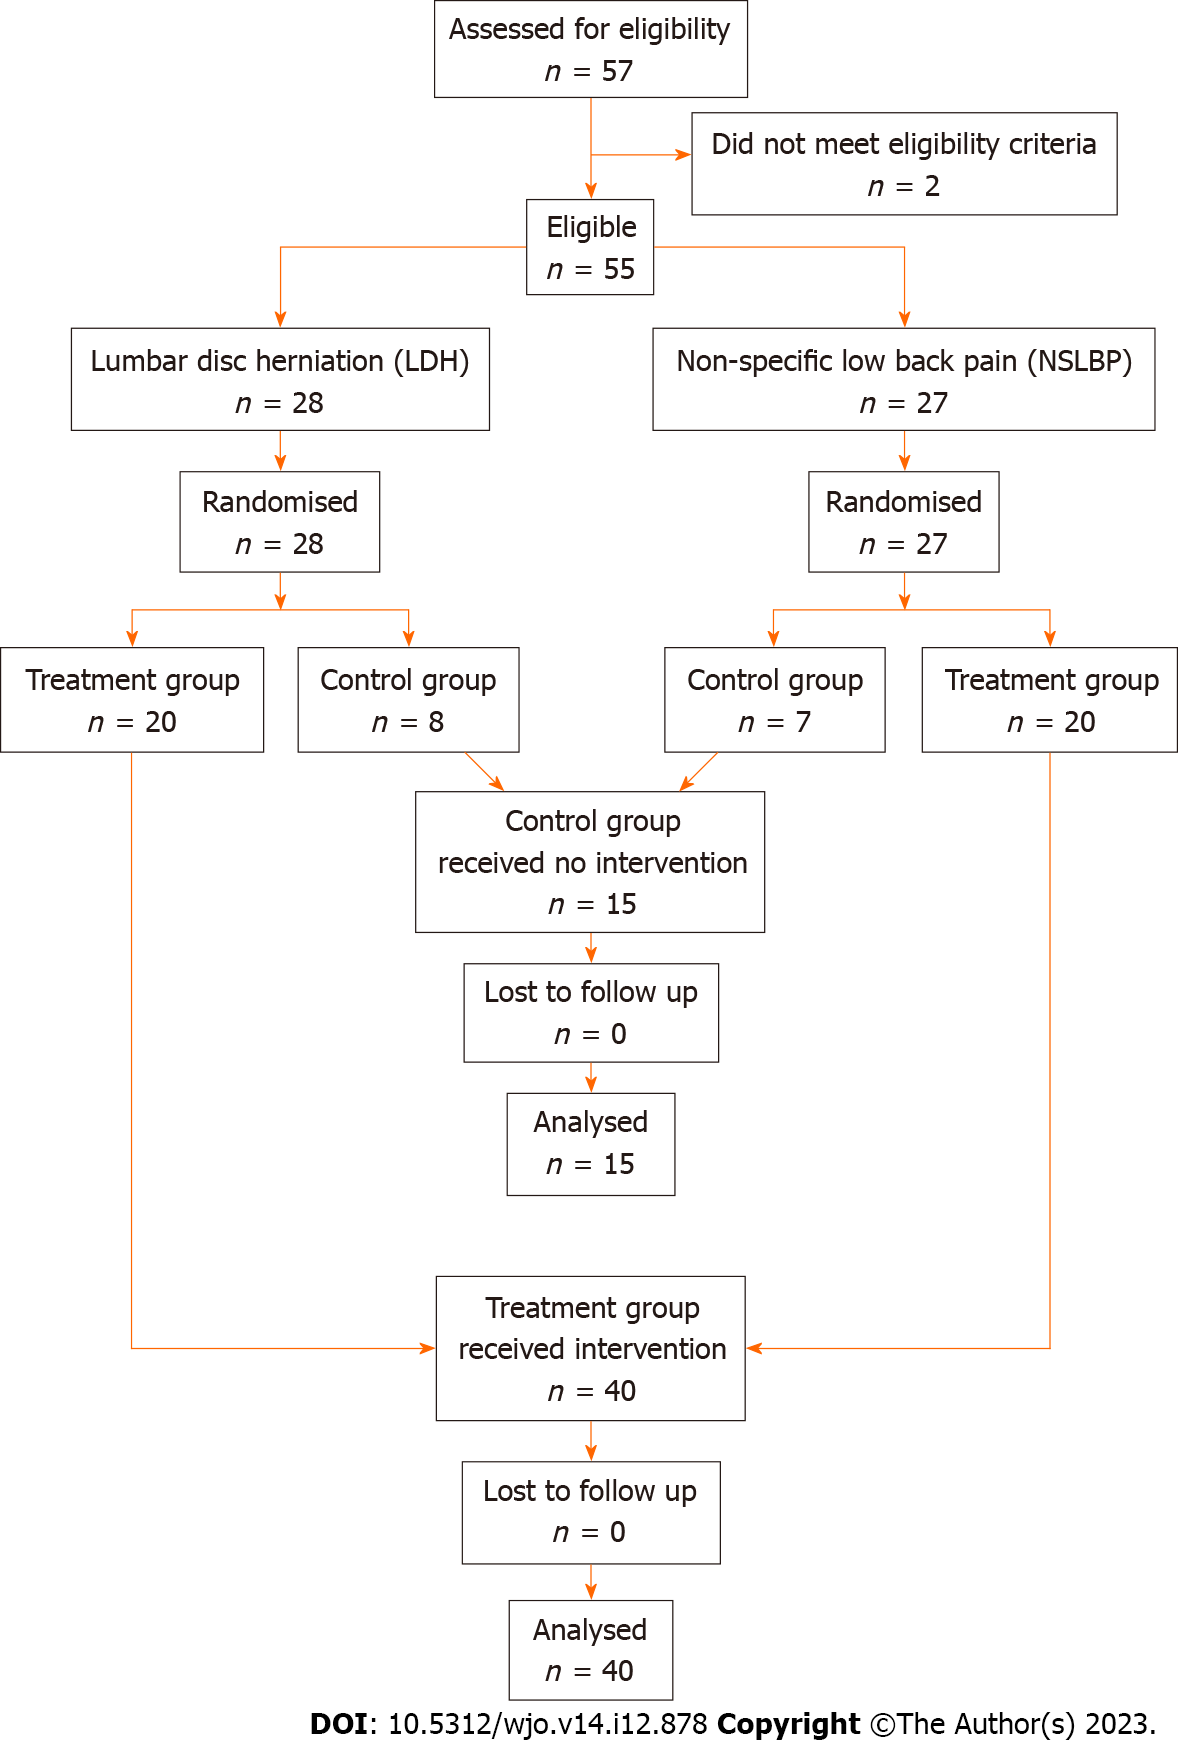
Figure 2 Patient allocation flow diagram.
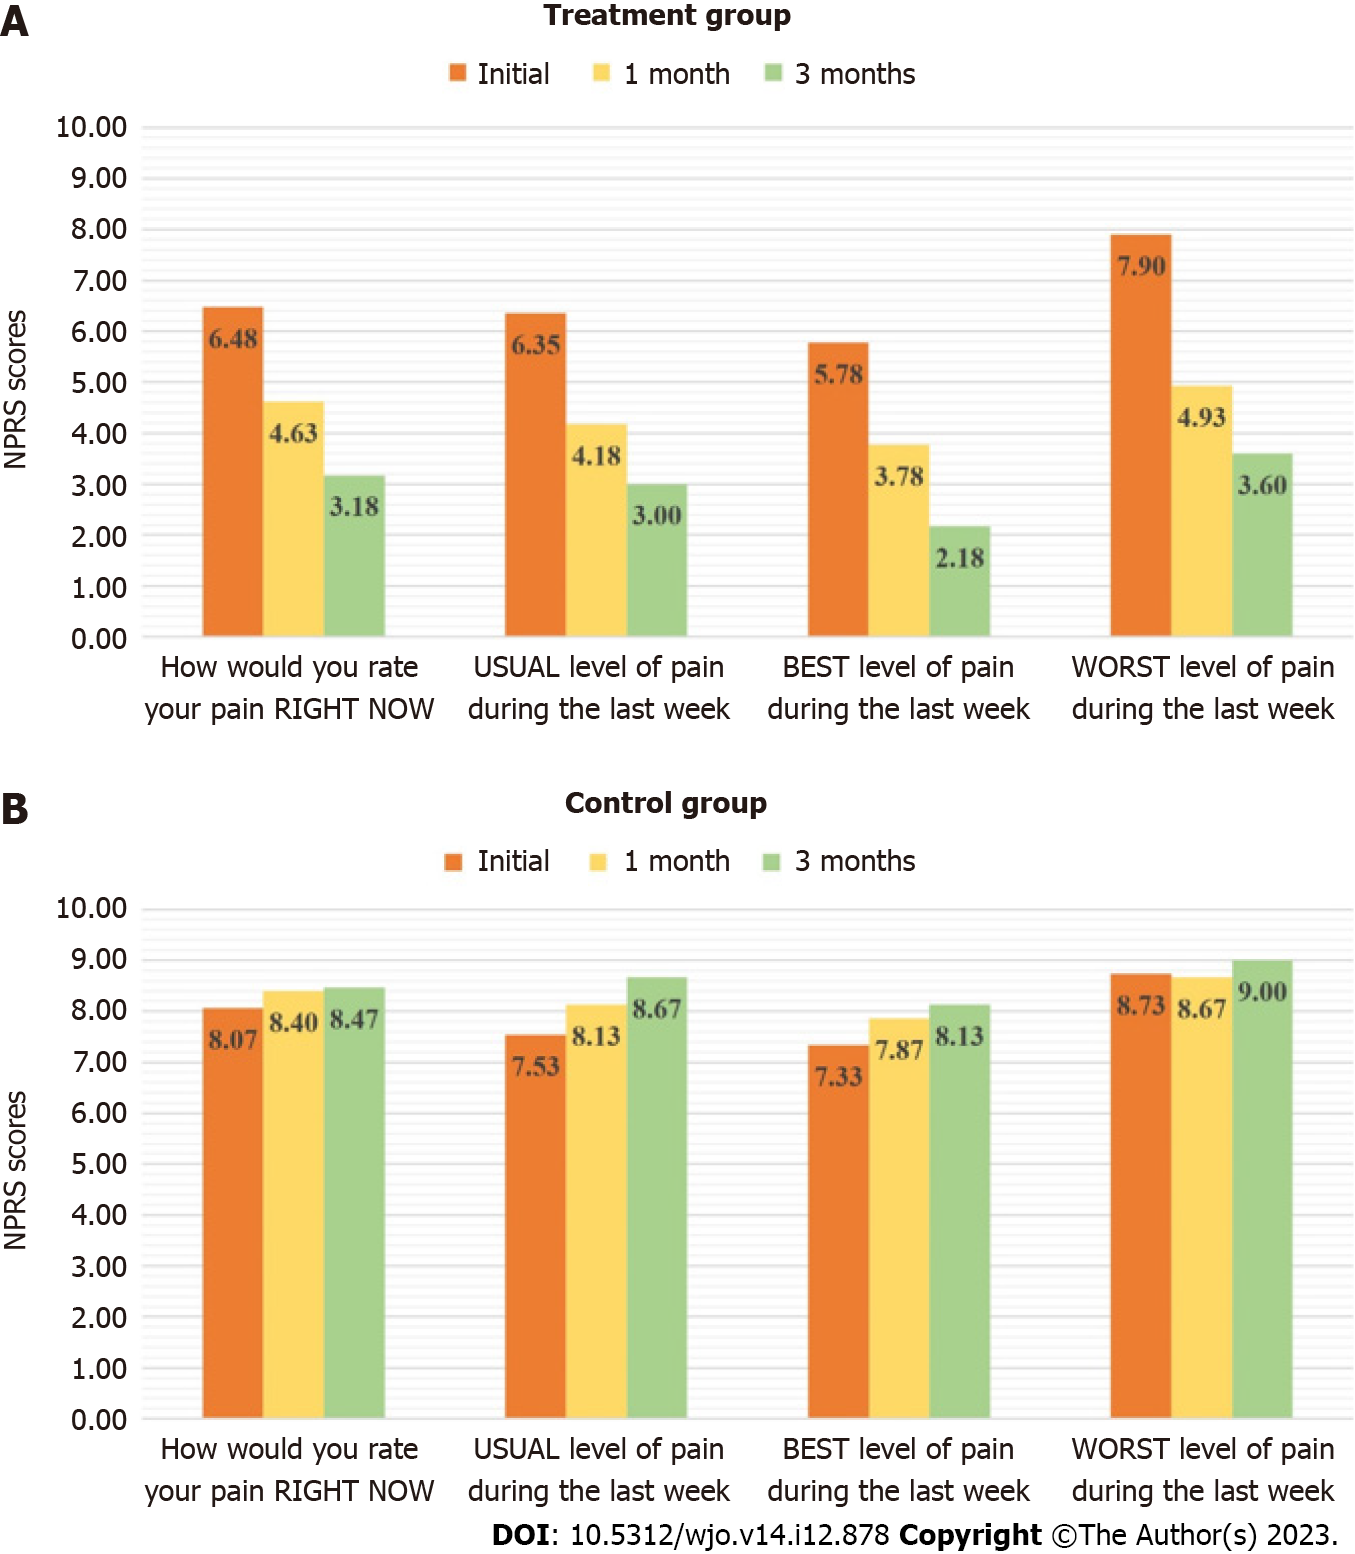
Figure 3 The comparison of mean Numerical Pain Rating Scale (NPRS) scores in the treatment and control groups at initial evaluation and at 1 and 3 mo.
A: Treatment group; B: Control group.
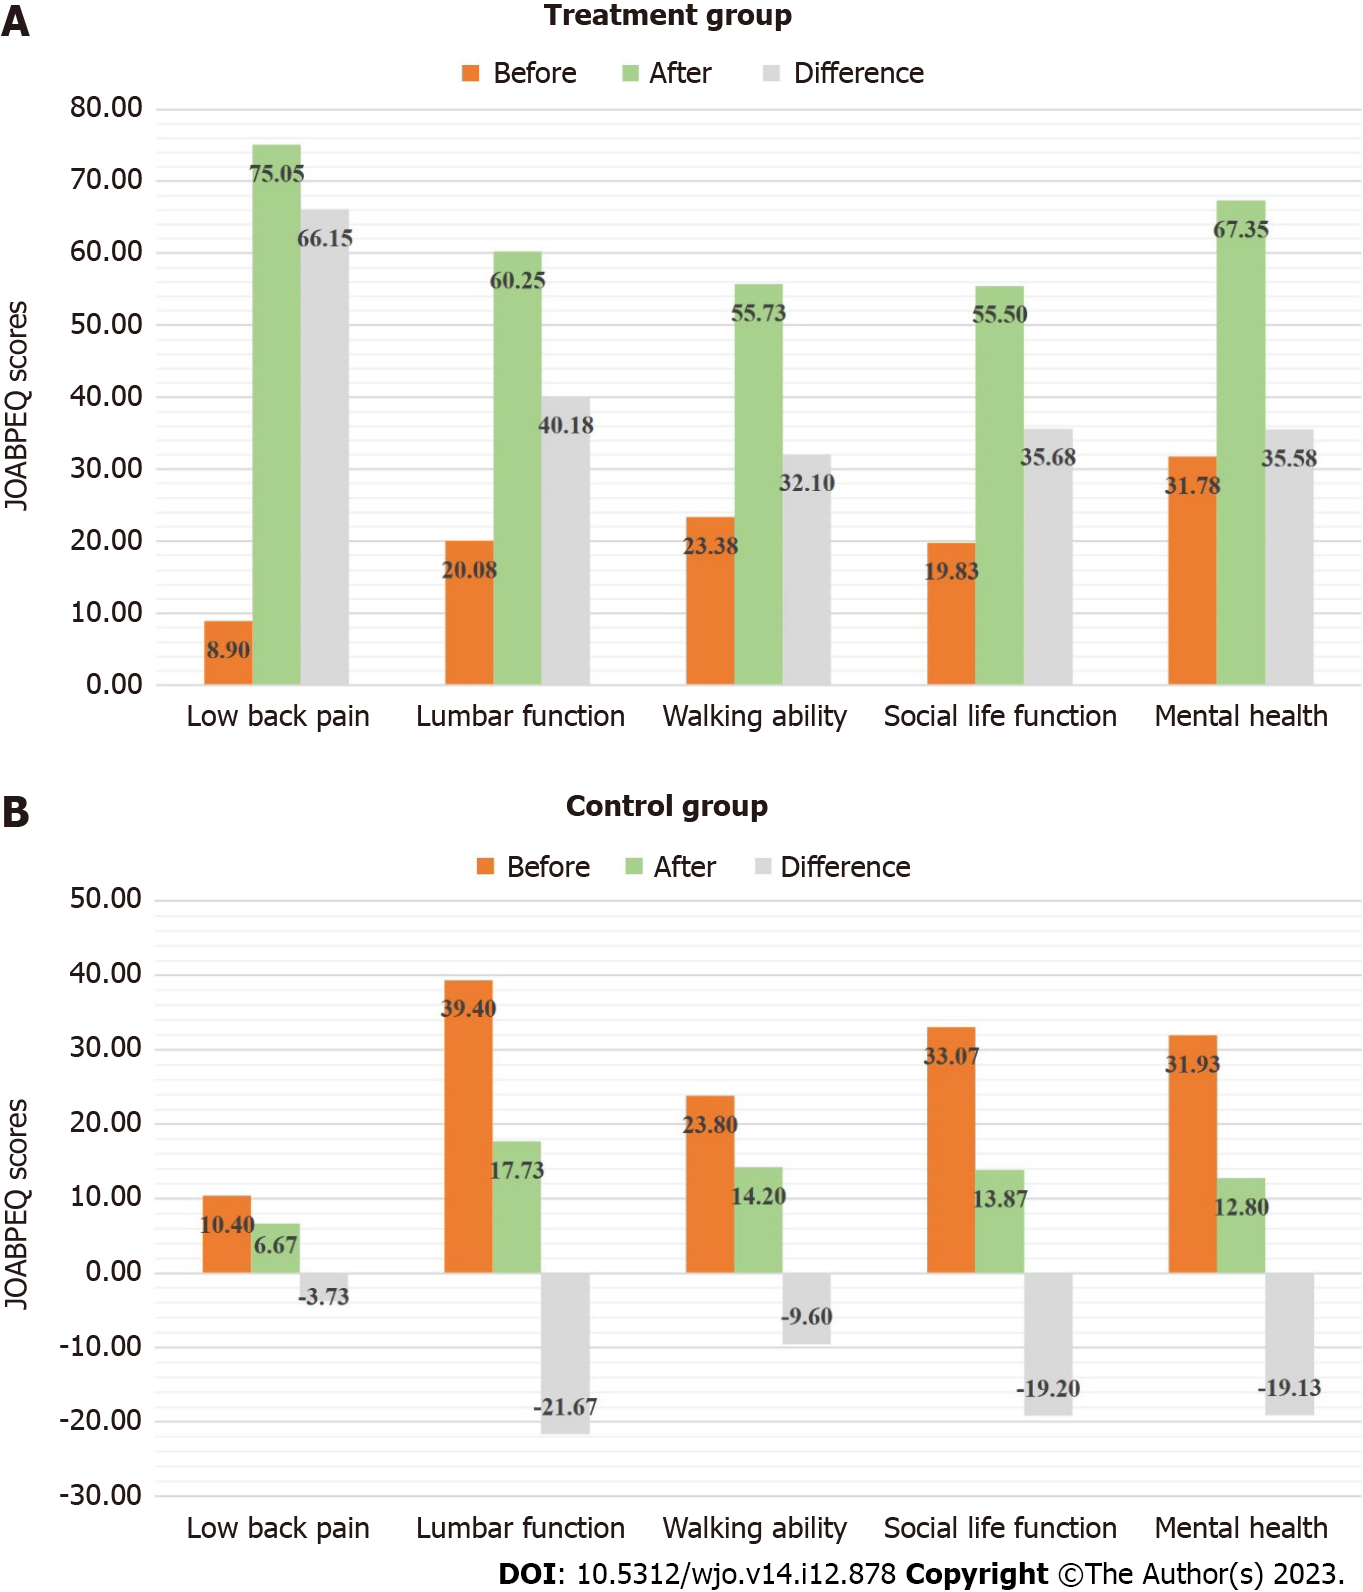
Figure 4 The comparison of mean Japanese Orthopedic Association Back Pain Evaluation Questionnaire (JOABPEQ) functional domains at initial and final evaluations at 3 mo, and their difference.
A: Treatment group; B: Control group.
- Citation: Allen S, Rashid A, Adjani A, Akram M, Khan FS, Sherwani R, Khalil MT. Efficacy and safety of thermobalancing therapy with Dr Allen’s Device for chronic low back pain: A randomised controlled trial. World J Orthop 2023; 14(12): 878-888
- URL: https://www.wjgnet.com/2218-5836/full/v14/i12/878.htm
- DOI: https://dx.doi.org/10.5312/wjo.v14.i12.878


