Copyright
©The Author(s) 2023.
World J Orthop. Jan 18, 2023; 14(1): 23-41
Published online Jan 18, 2023. doi: 10.5312/wjo.v14.i1.23
Published online Jan 18, 2023. doi: 10.5312/wjo.v14.i1.23
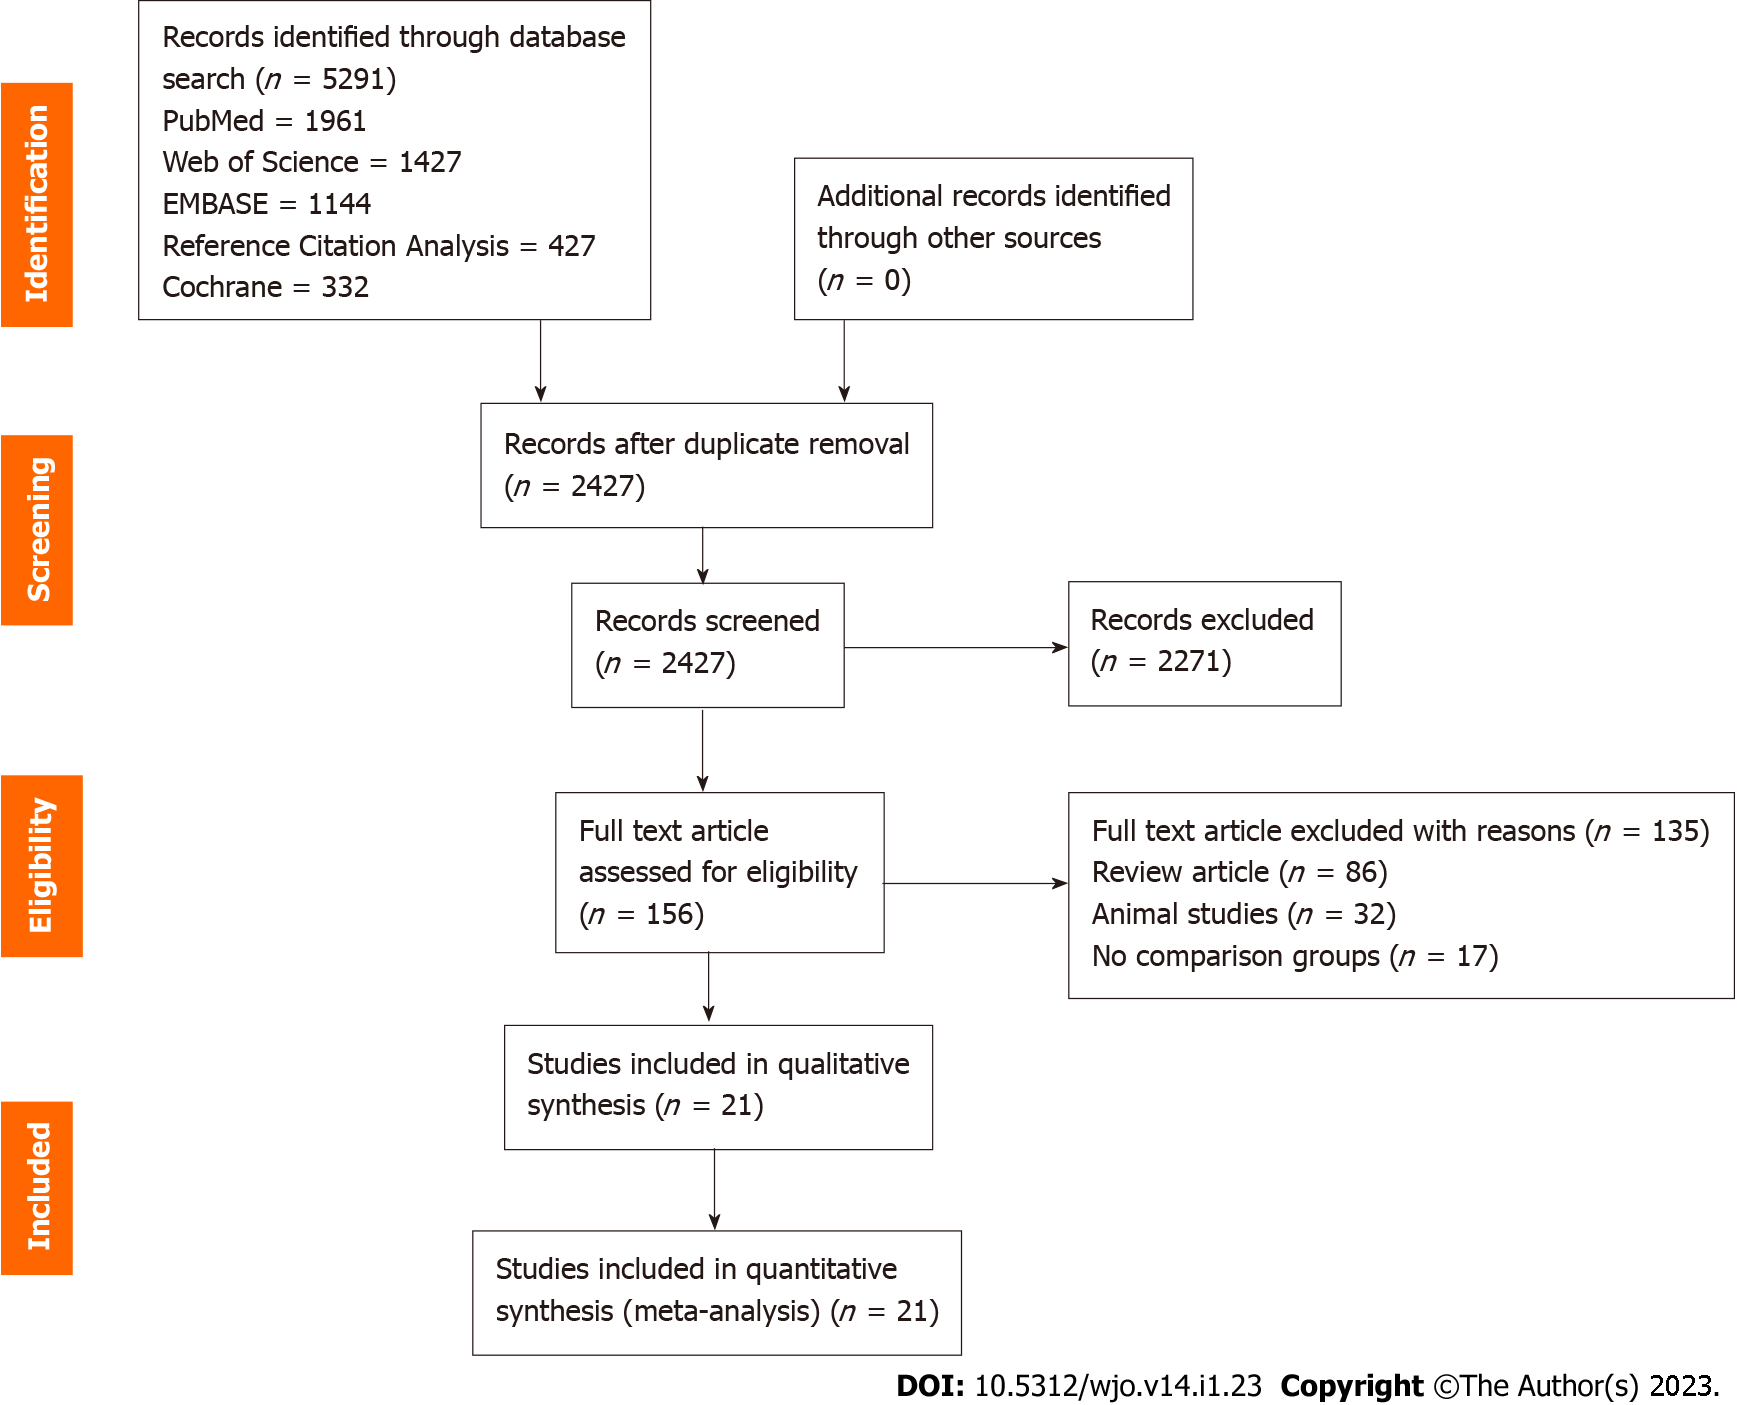
Figure 1 PRISMA flow diagram of the included studies.
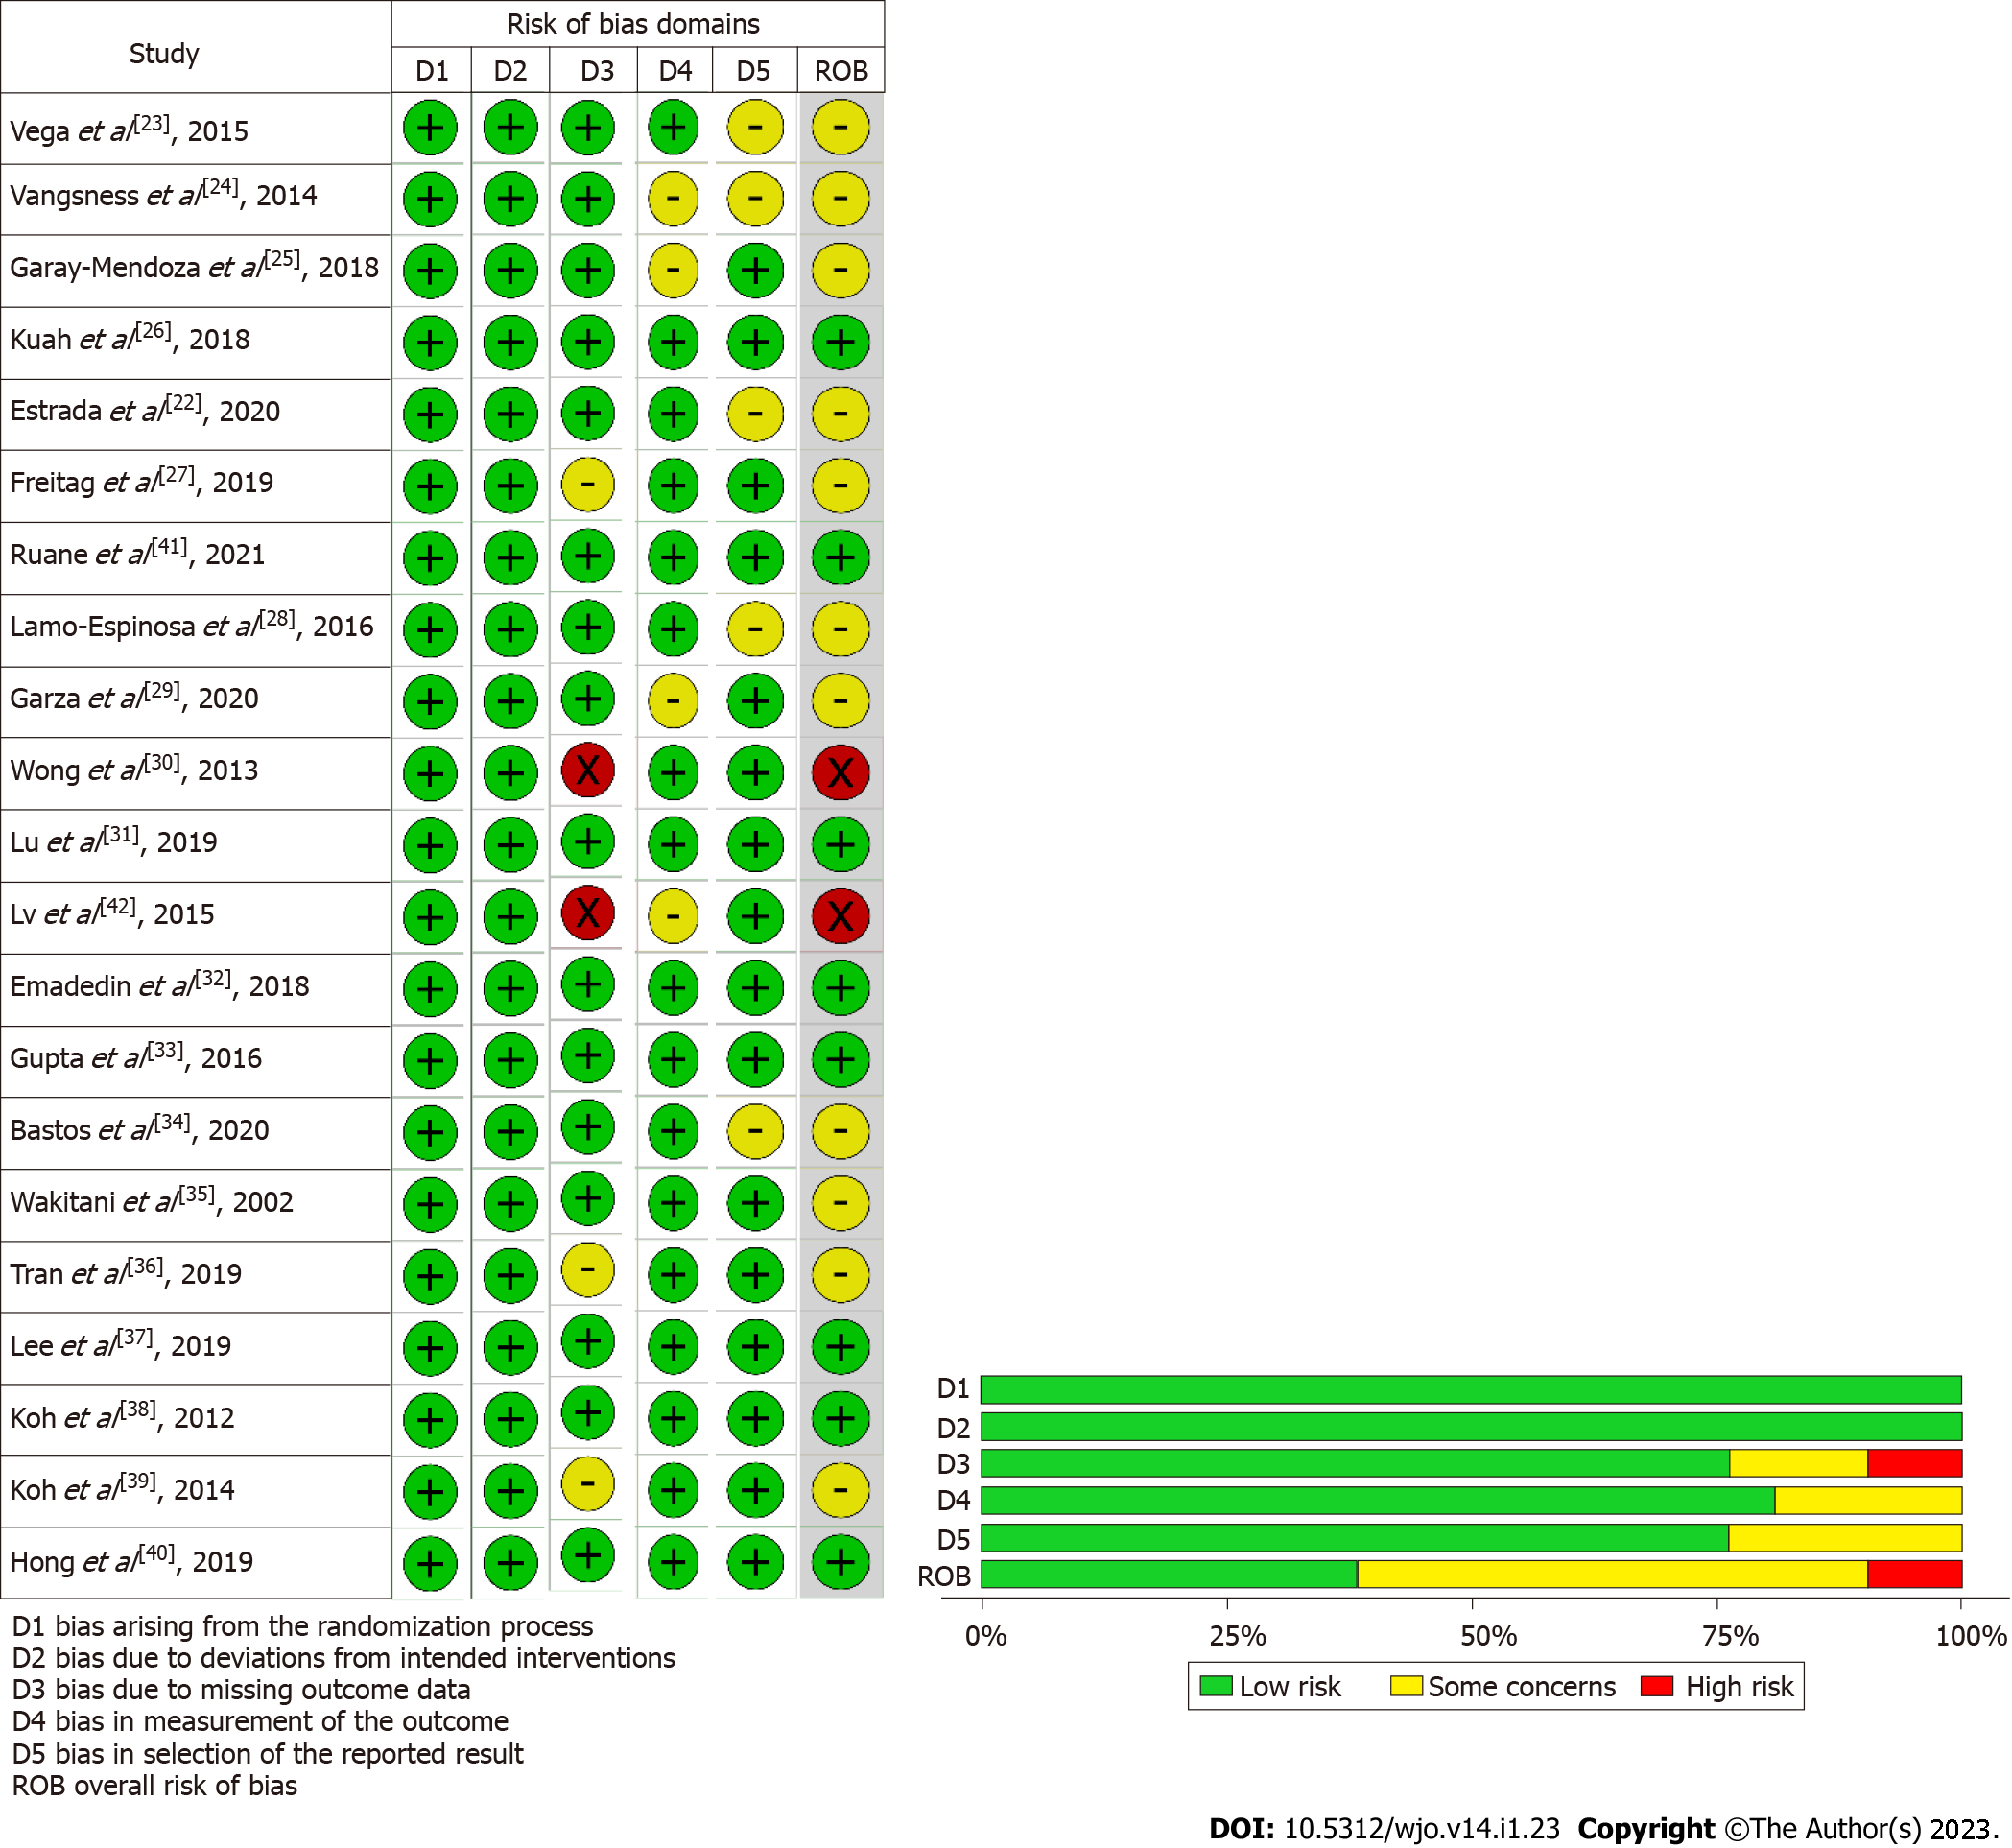
Figure 2 Methodological quality and risk of bias assessment of all the included studies.
Figure 3 Forest plot of the included studies comparing adipose tissue and bone marrow as a source of mesenchymal stromal cell therapy compared to their controls.
A: Visual analog scale (VAS) at 6 mo; B: VAS at 12 mo; C: VAS at 24 mo; D: Western Ontario McMaster Universities Osteoarthritis Index (WOMAC) at 6 mo; E: WOMAC at 12 mo; F: Lysholm at 12 mo; G: Lysholm at 24 mo; H: Knee osteoarthritis outcome score at 12 mo; I: Magnetic resonance observation of cartilage repair tissue score at 12 mo. CI: Confidence interval; NA: Not available.
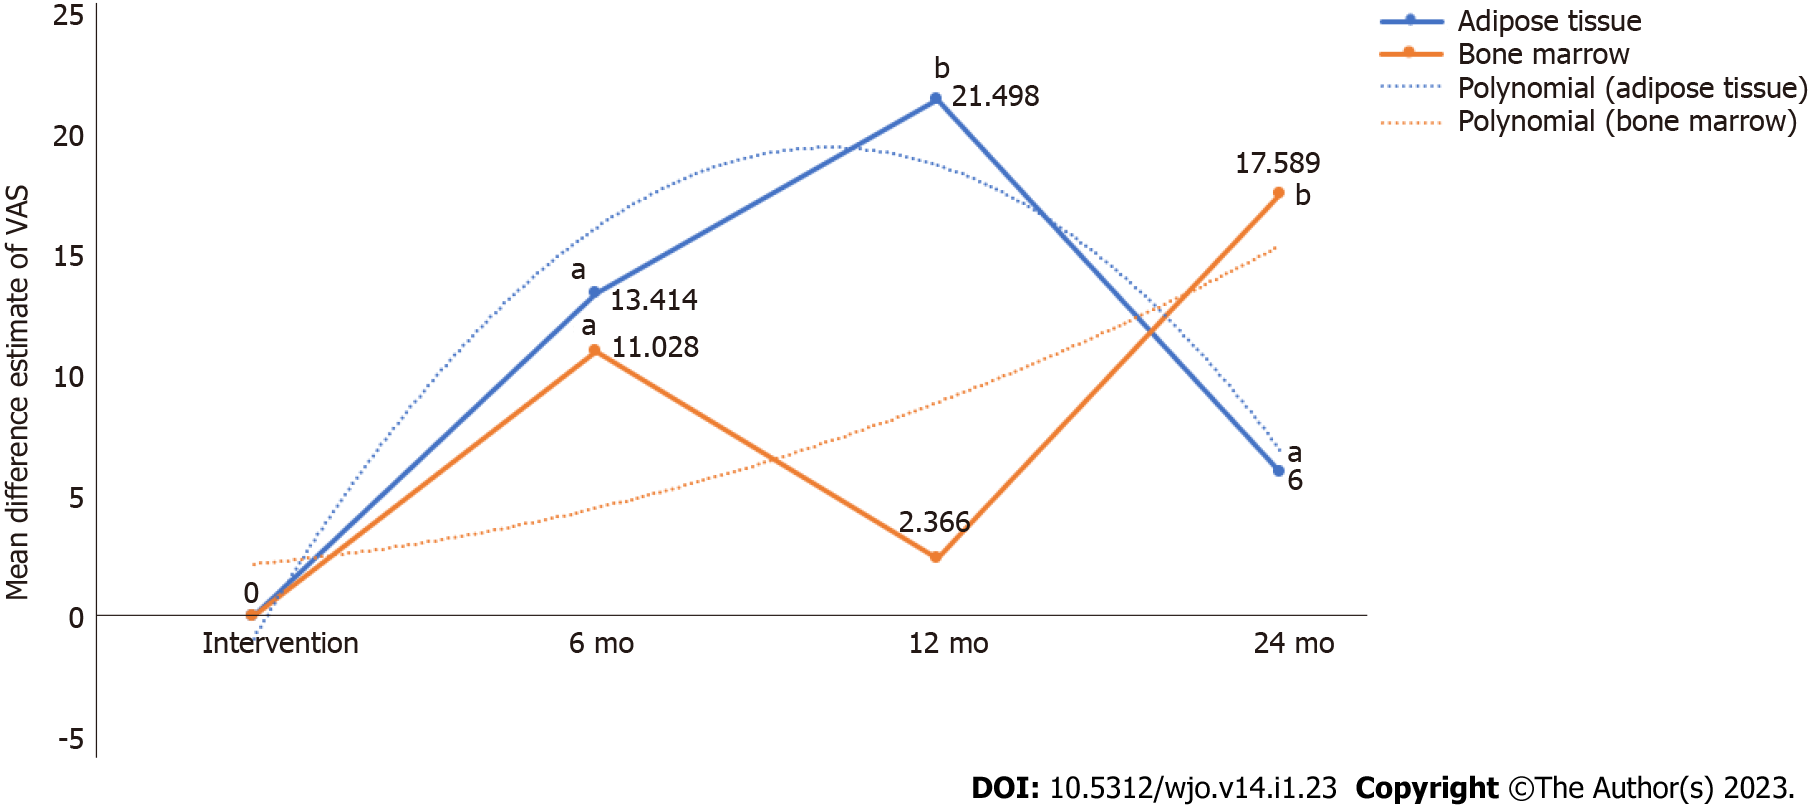
Figure 4 Pain reduction potential of adipose tissue and bone marrow at various timepoints based on visual analog scale score.
aP < 0.05; bP < 0.001. VAS: Visual analog scale.
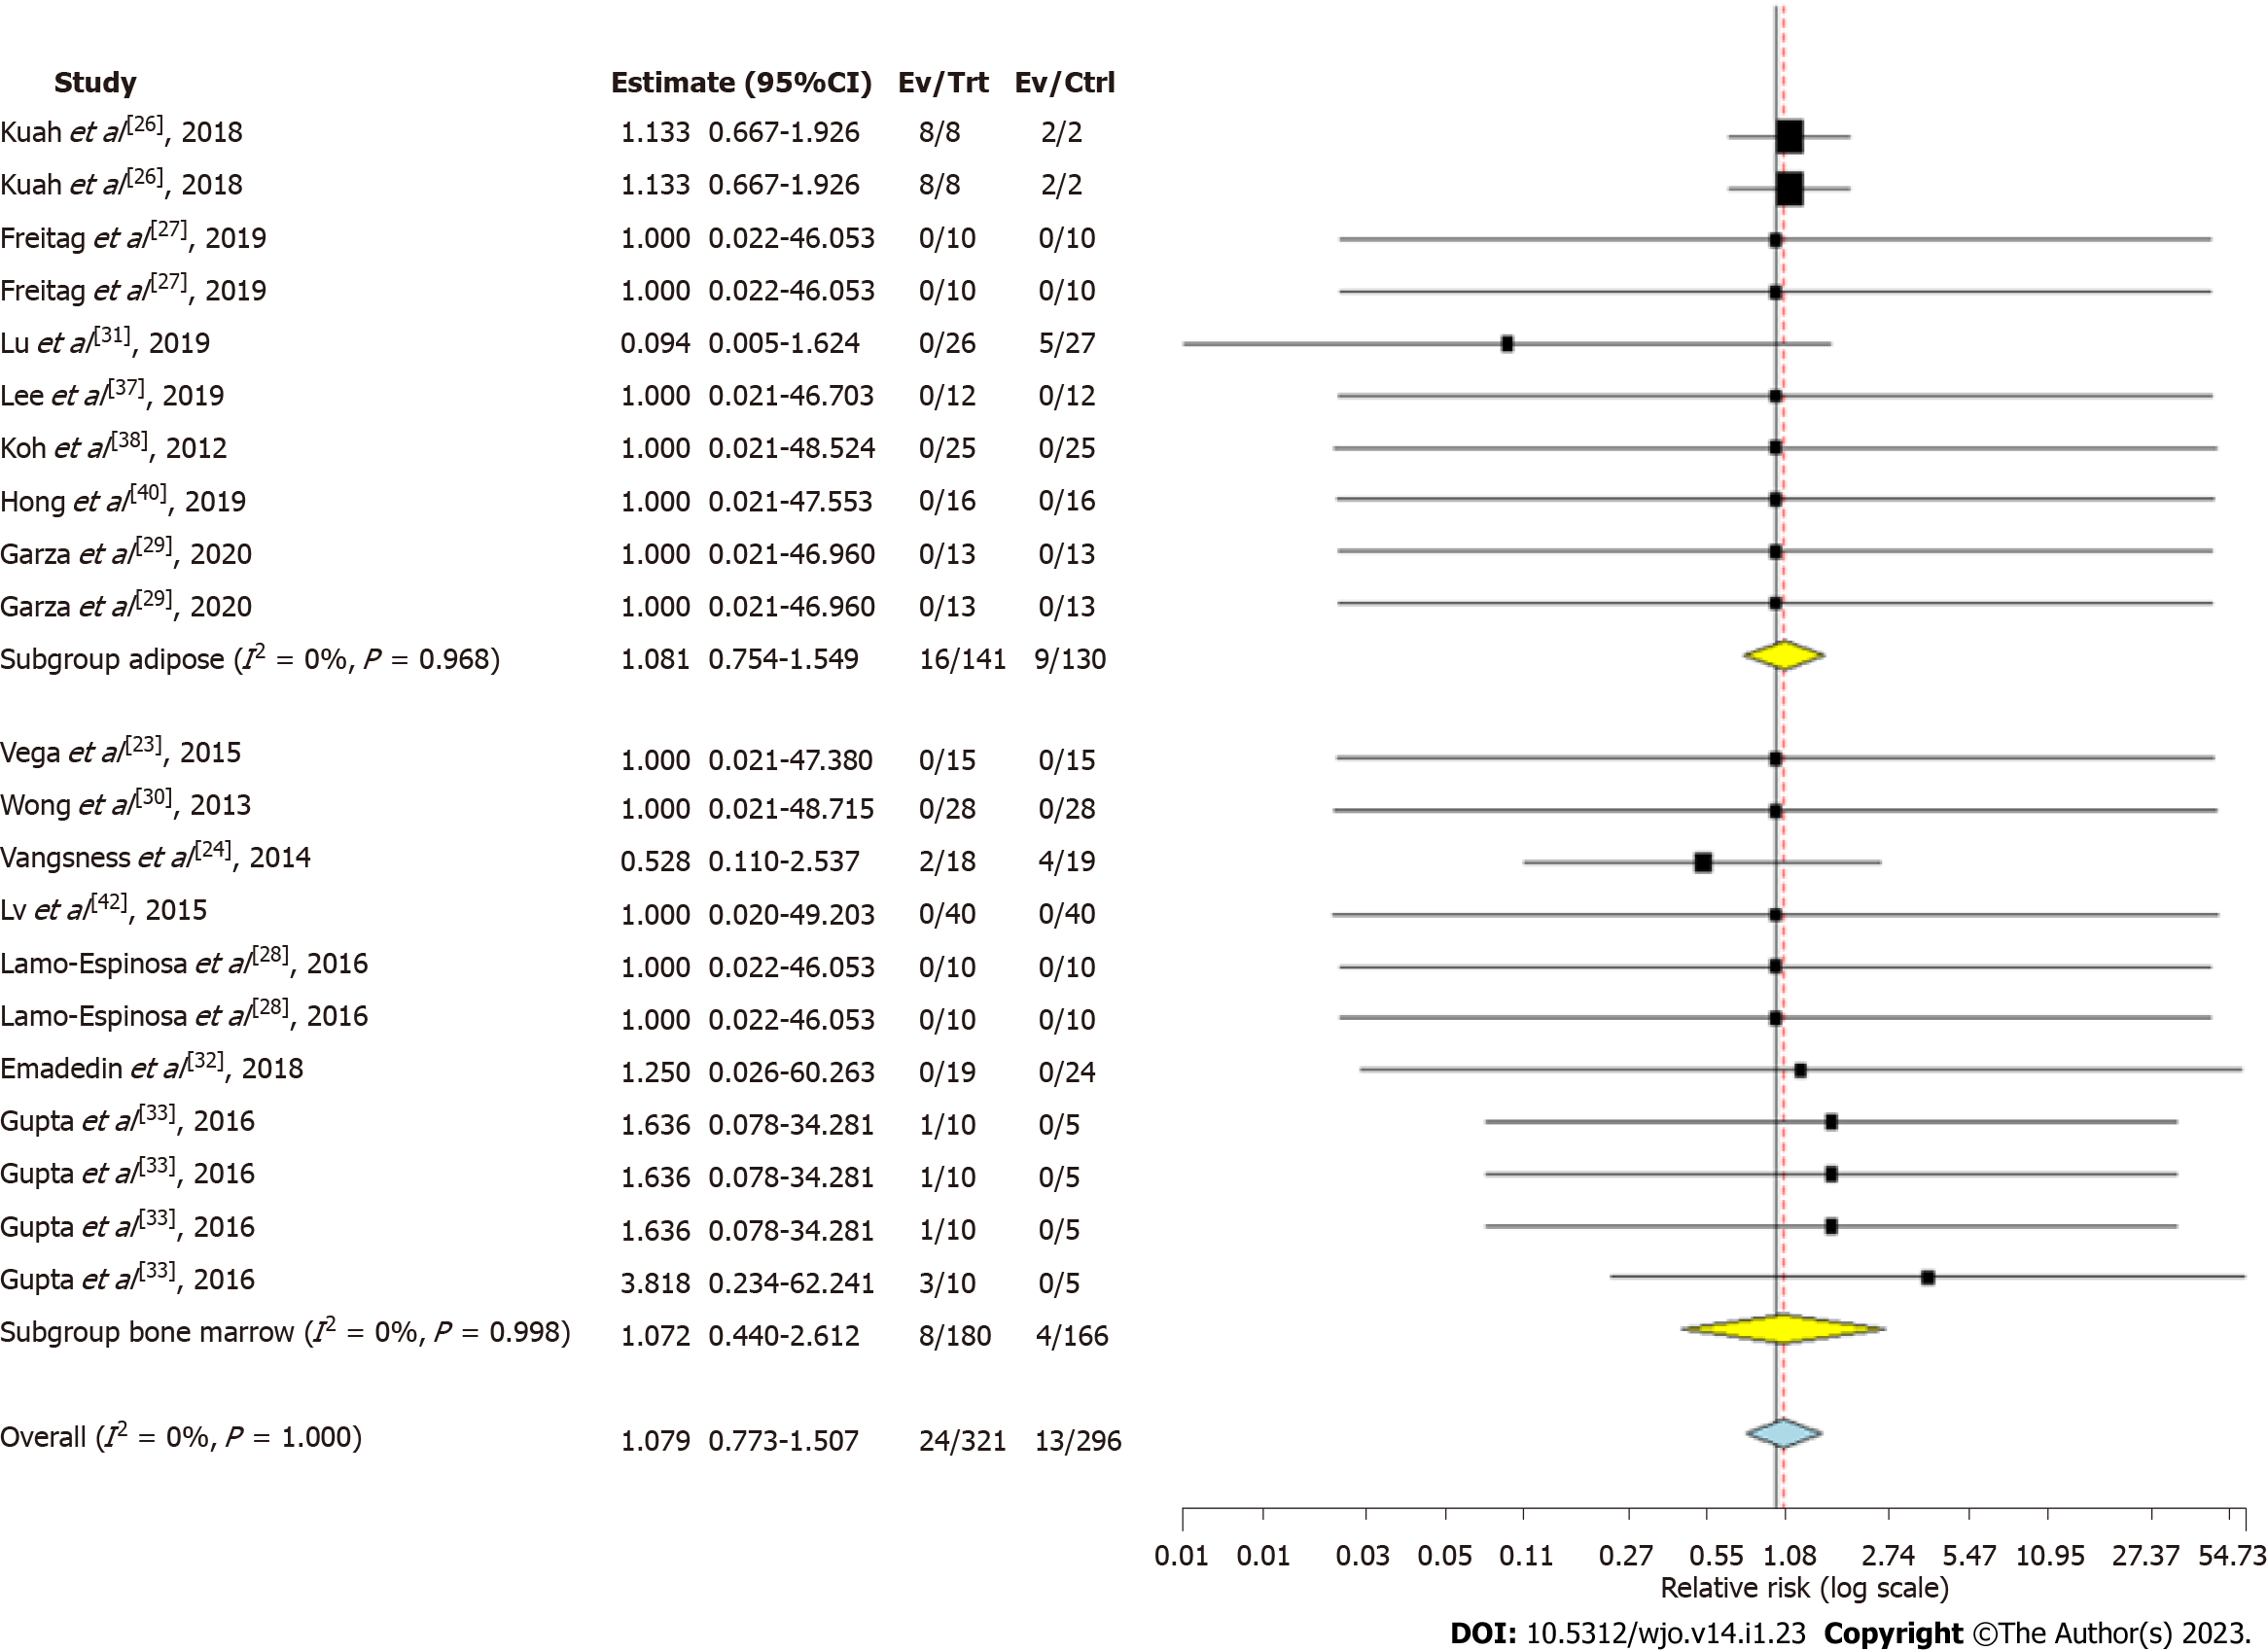
Figure 5 Forest plot of the included studies comparing adverse events upon using adipose tissue and bone marrow as a source of mesenchymal stromal cell therapy compared to their controls.
CI: Confidence interval.
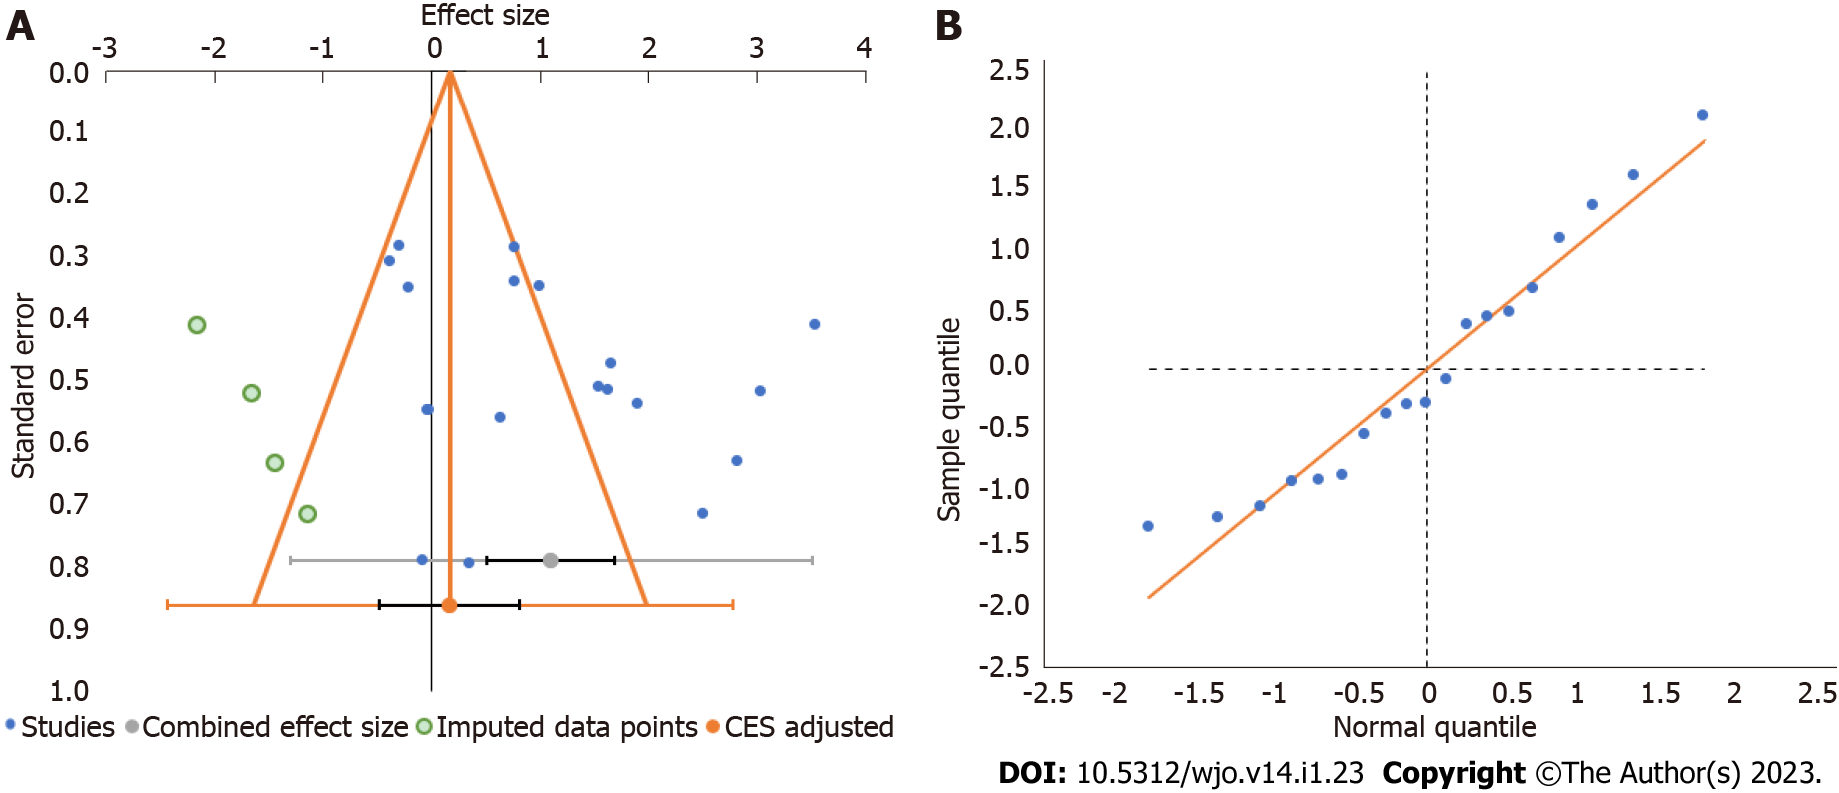
Figure 6 Publication bias assessment.
A: Funnel plot; B: Quantile plot for the visual analog score outcome at 6 mo in the included studies. CES: Combined effect size.
- Citation: Muthu S, Patil SC, Jeyaraman N, Jeyaraman M, Gangadaran P, Rajendran RL, Oh EJ, Khanna M, Chung HY, Ahn BC. Comparative effectiveness of adipose-derived mesenchymal stromal cells in the management of knee osteoarthritis: A meta-analysis. World J Orthop 2023; 14(1): 23-41
- URL: https://www.wjgnet.com/2218-5836/full/v14/i1/23.htm
- DOI: https://dx.doi.org/10.5312/wjo.v14.i1.23


