Copyright
©The Author(s) 2022.
World J Orthop. Feb 18, 2022; 13(2): 178-192
Published online Feb 18, 2022. doi: 10.5312/wjo.v13.i2.178
Published online Feb 18, 2022. doi: 10.5312/wjo.v13.i2.178
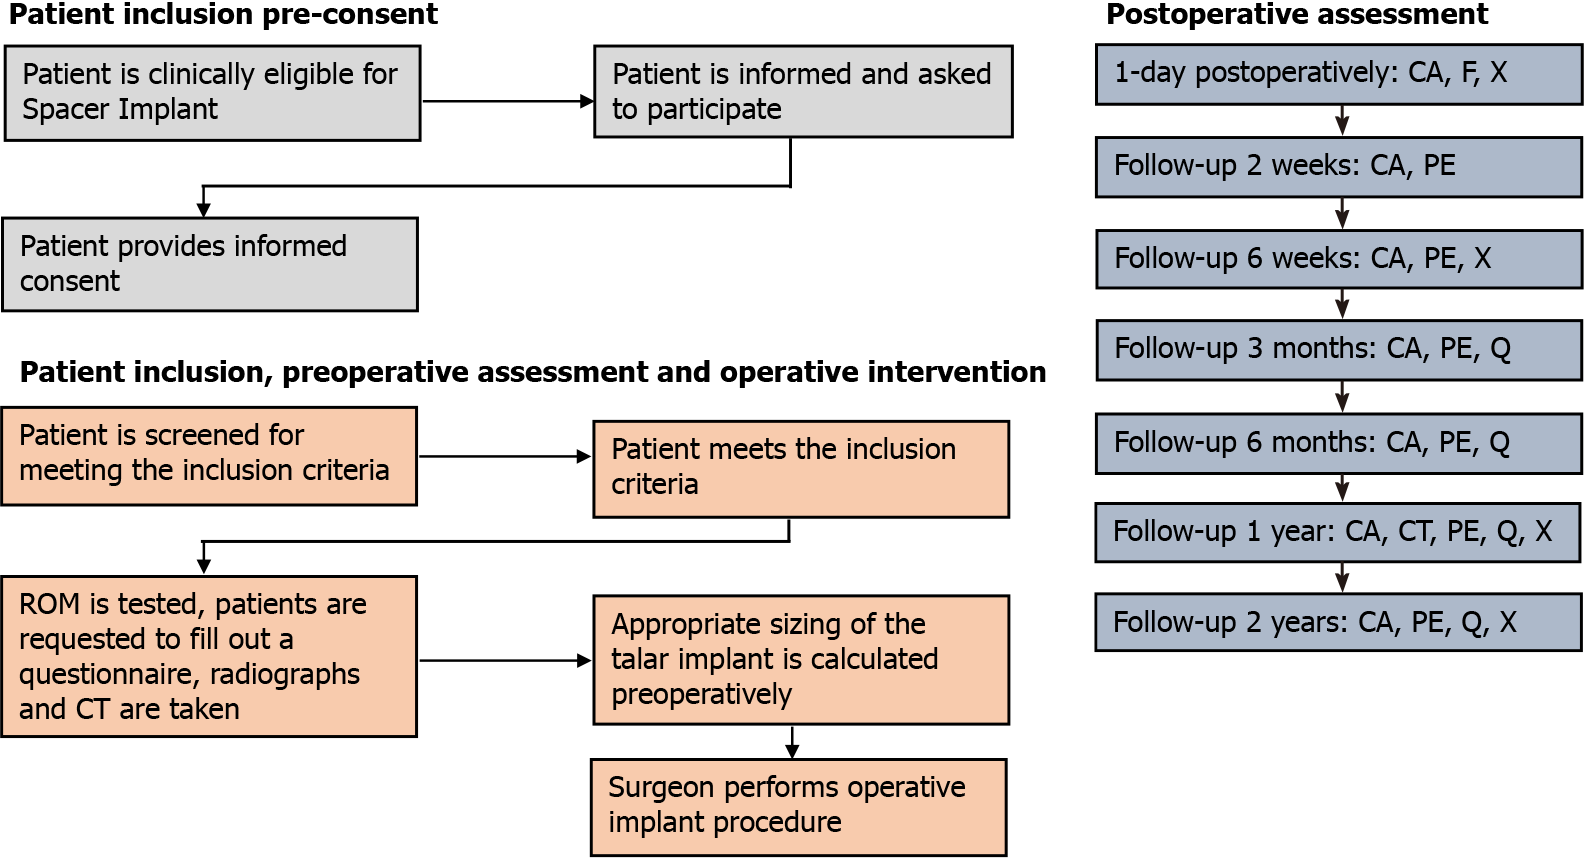
Figure 1 Flow-chart of the study design and main procedures participants will undergo during this study.
CA: Complication assessment; CT: Computed tomography; PE: Physical examination; Q: Questionnaires; ROM: Range of motion; X: Mortise and lateral radiographs.
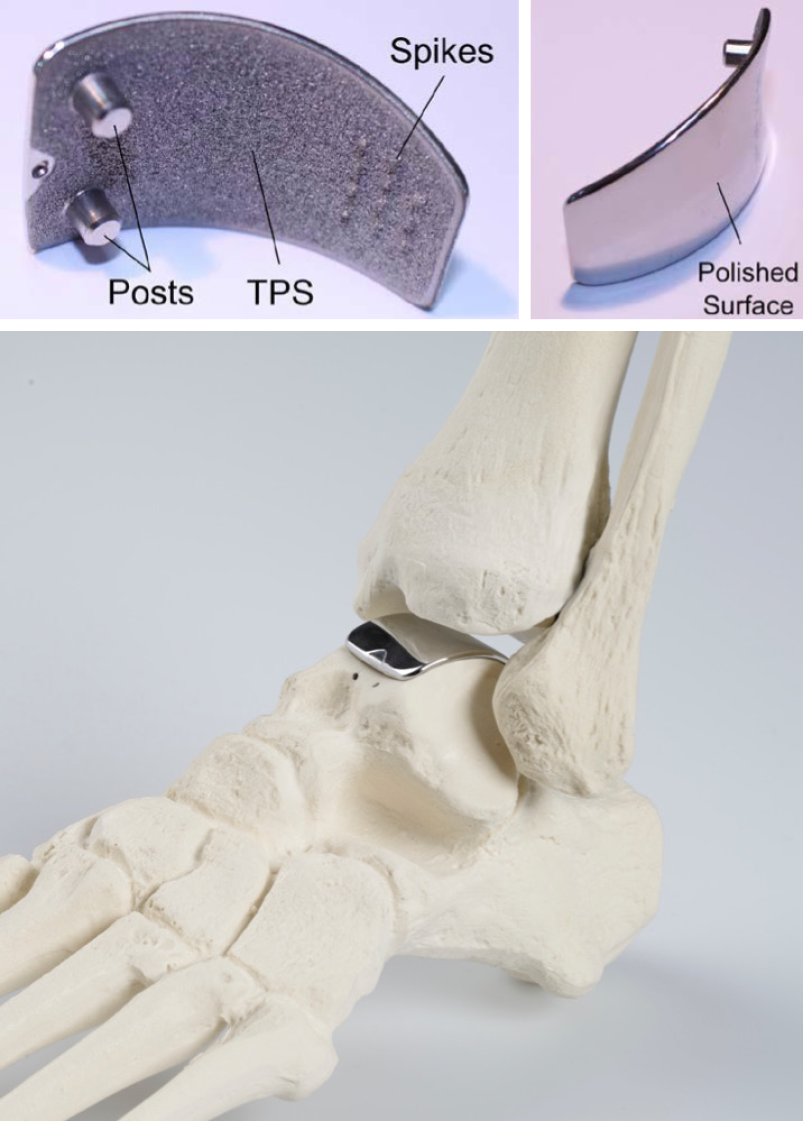
Figure 2 The Ankle Spacer Implant.
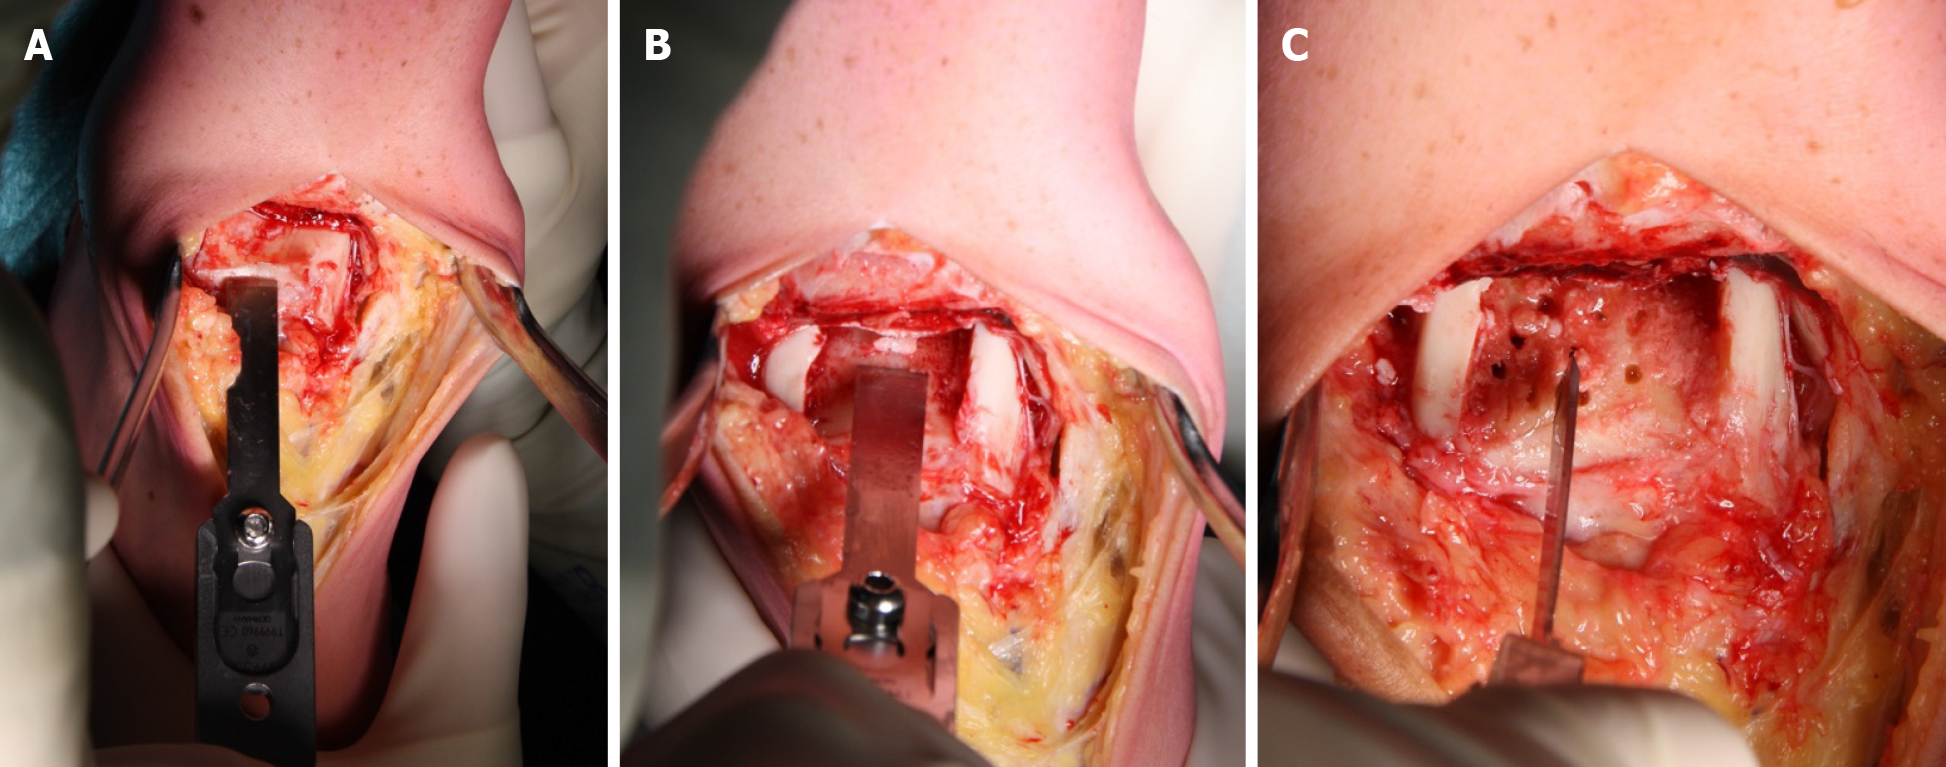
Figure 3 Preparation of cartilage and bone prior to insertion.
A: Removal of the talar cartilage; B: Removal of the subchondral bone; C: Bone marrow stimulation of the subchondral bone.
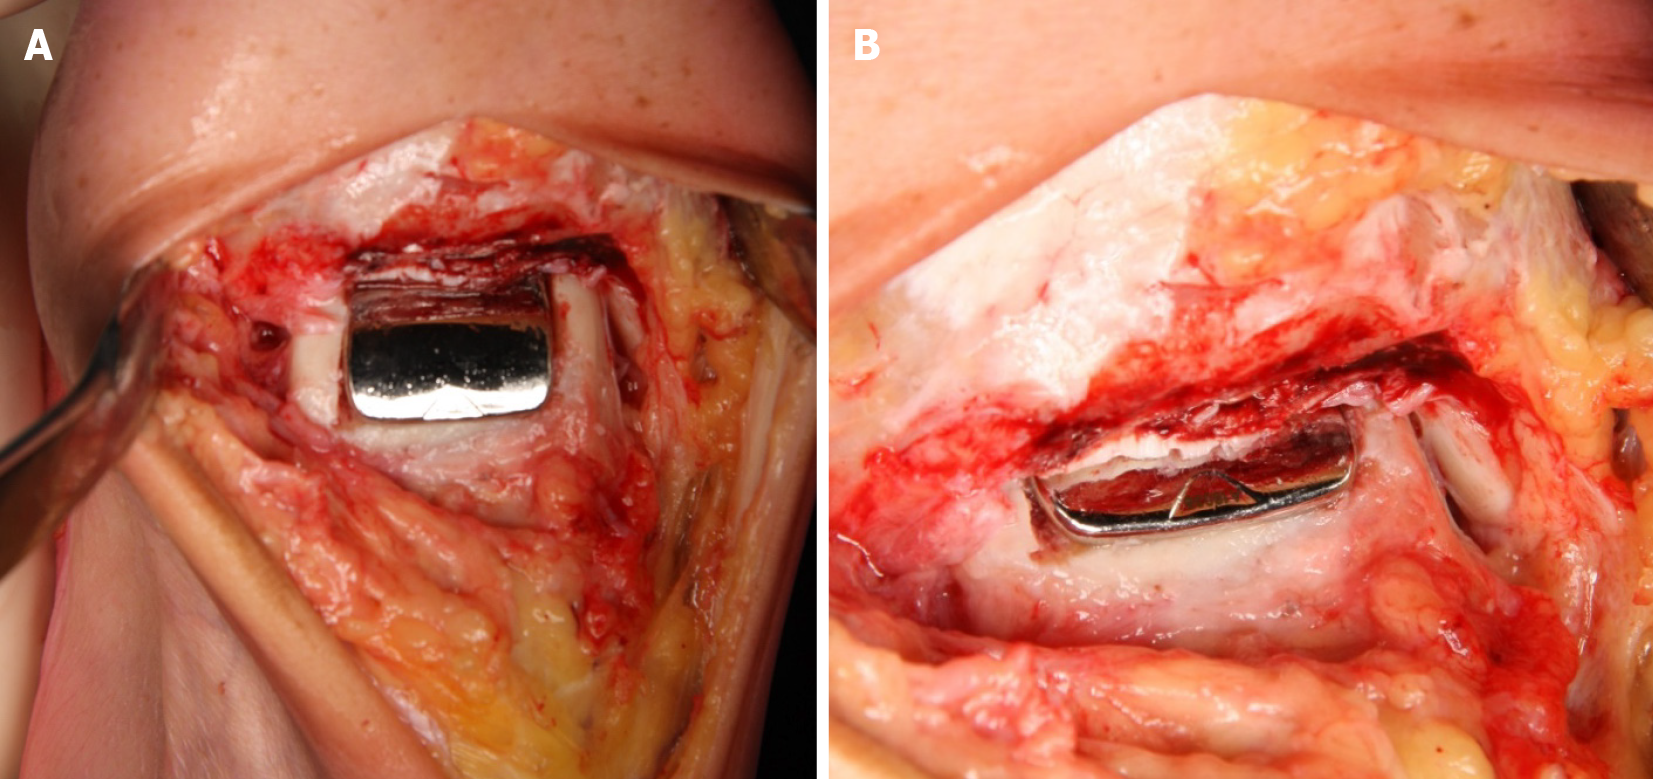
Figure 4 After the insertion of the Ankle Spacer.
A: End-result after the insertion of the Ankle Spacer; B: End-result after the insertion of the Ankle Spacer.
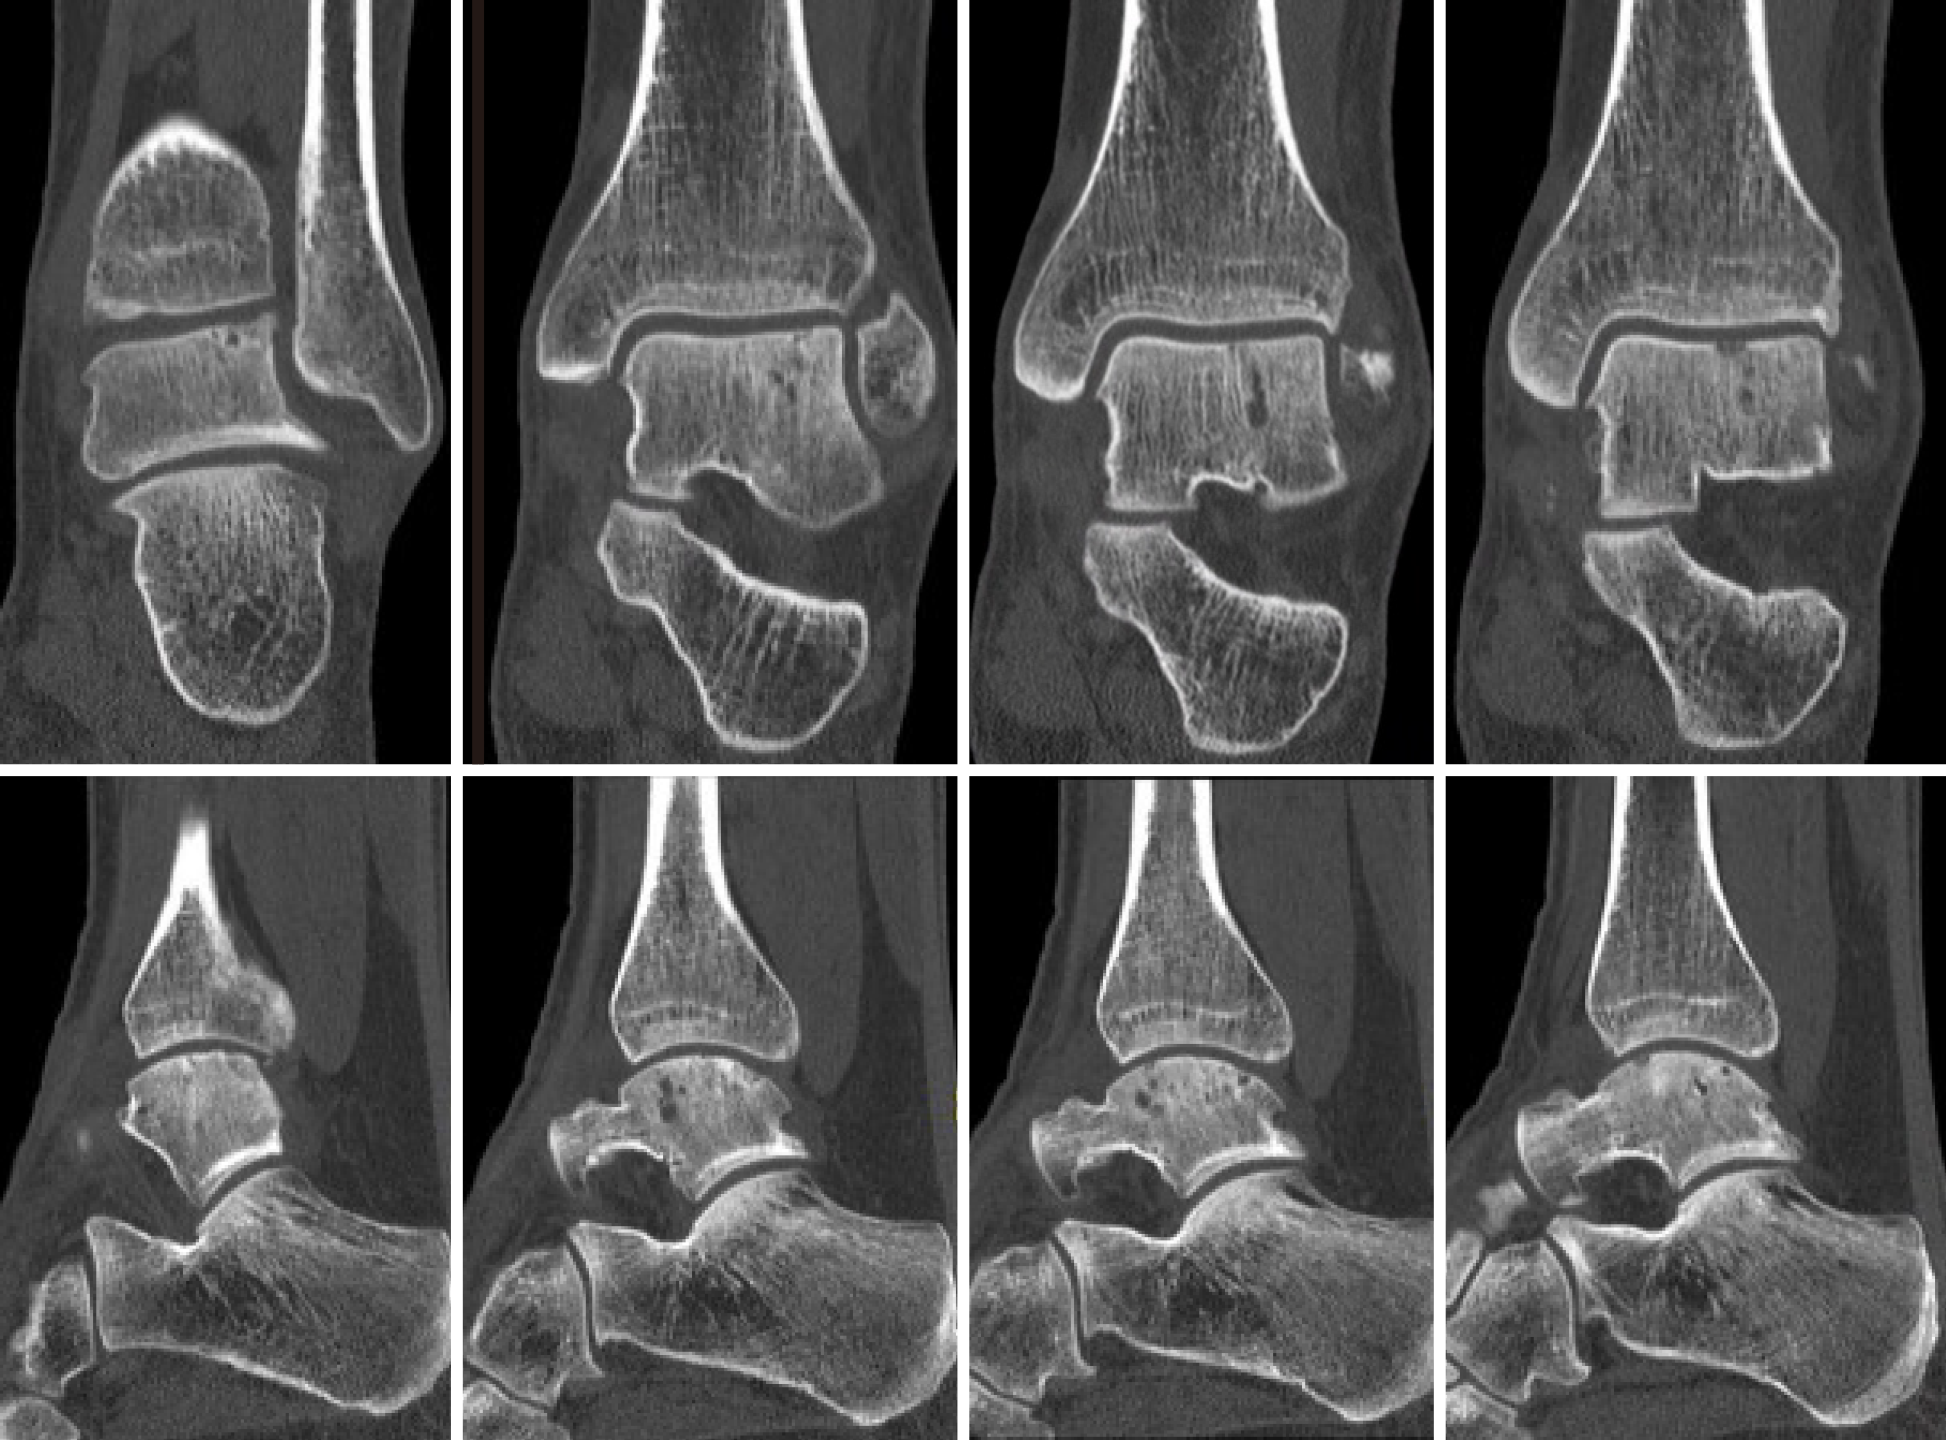
Figure 5 Pre-operative computed tomography scan of patient number 1: Upper part shows coronal slides with the images from left to right going into the posterior to anterior direction.
The lower part shows sagittal slides with the images from left to right going from lateral to medial.
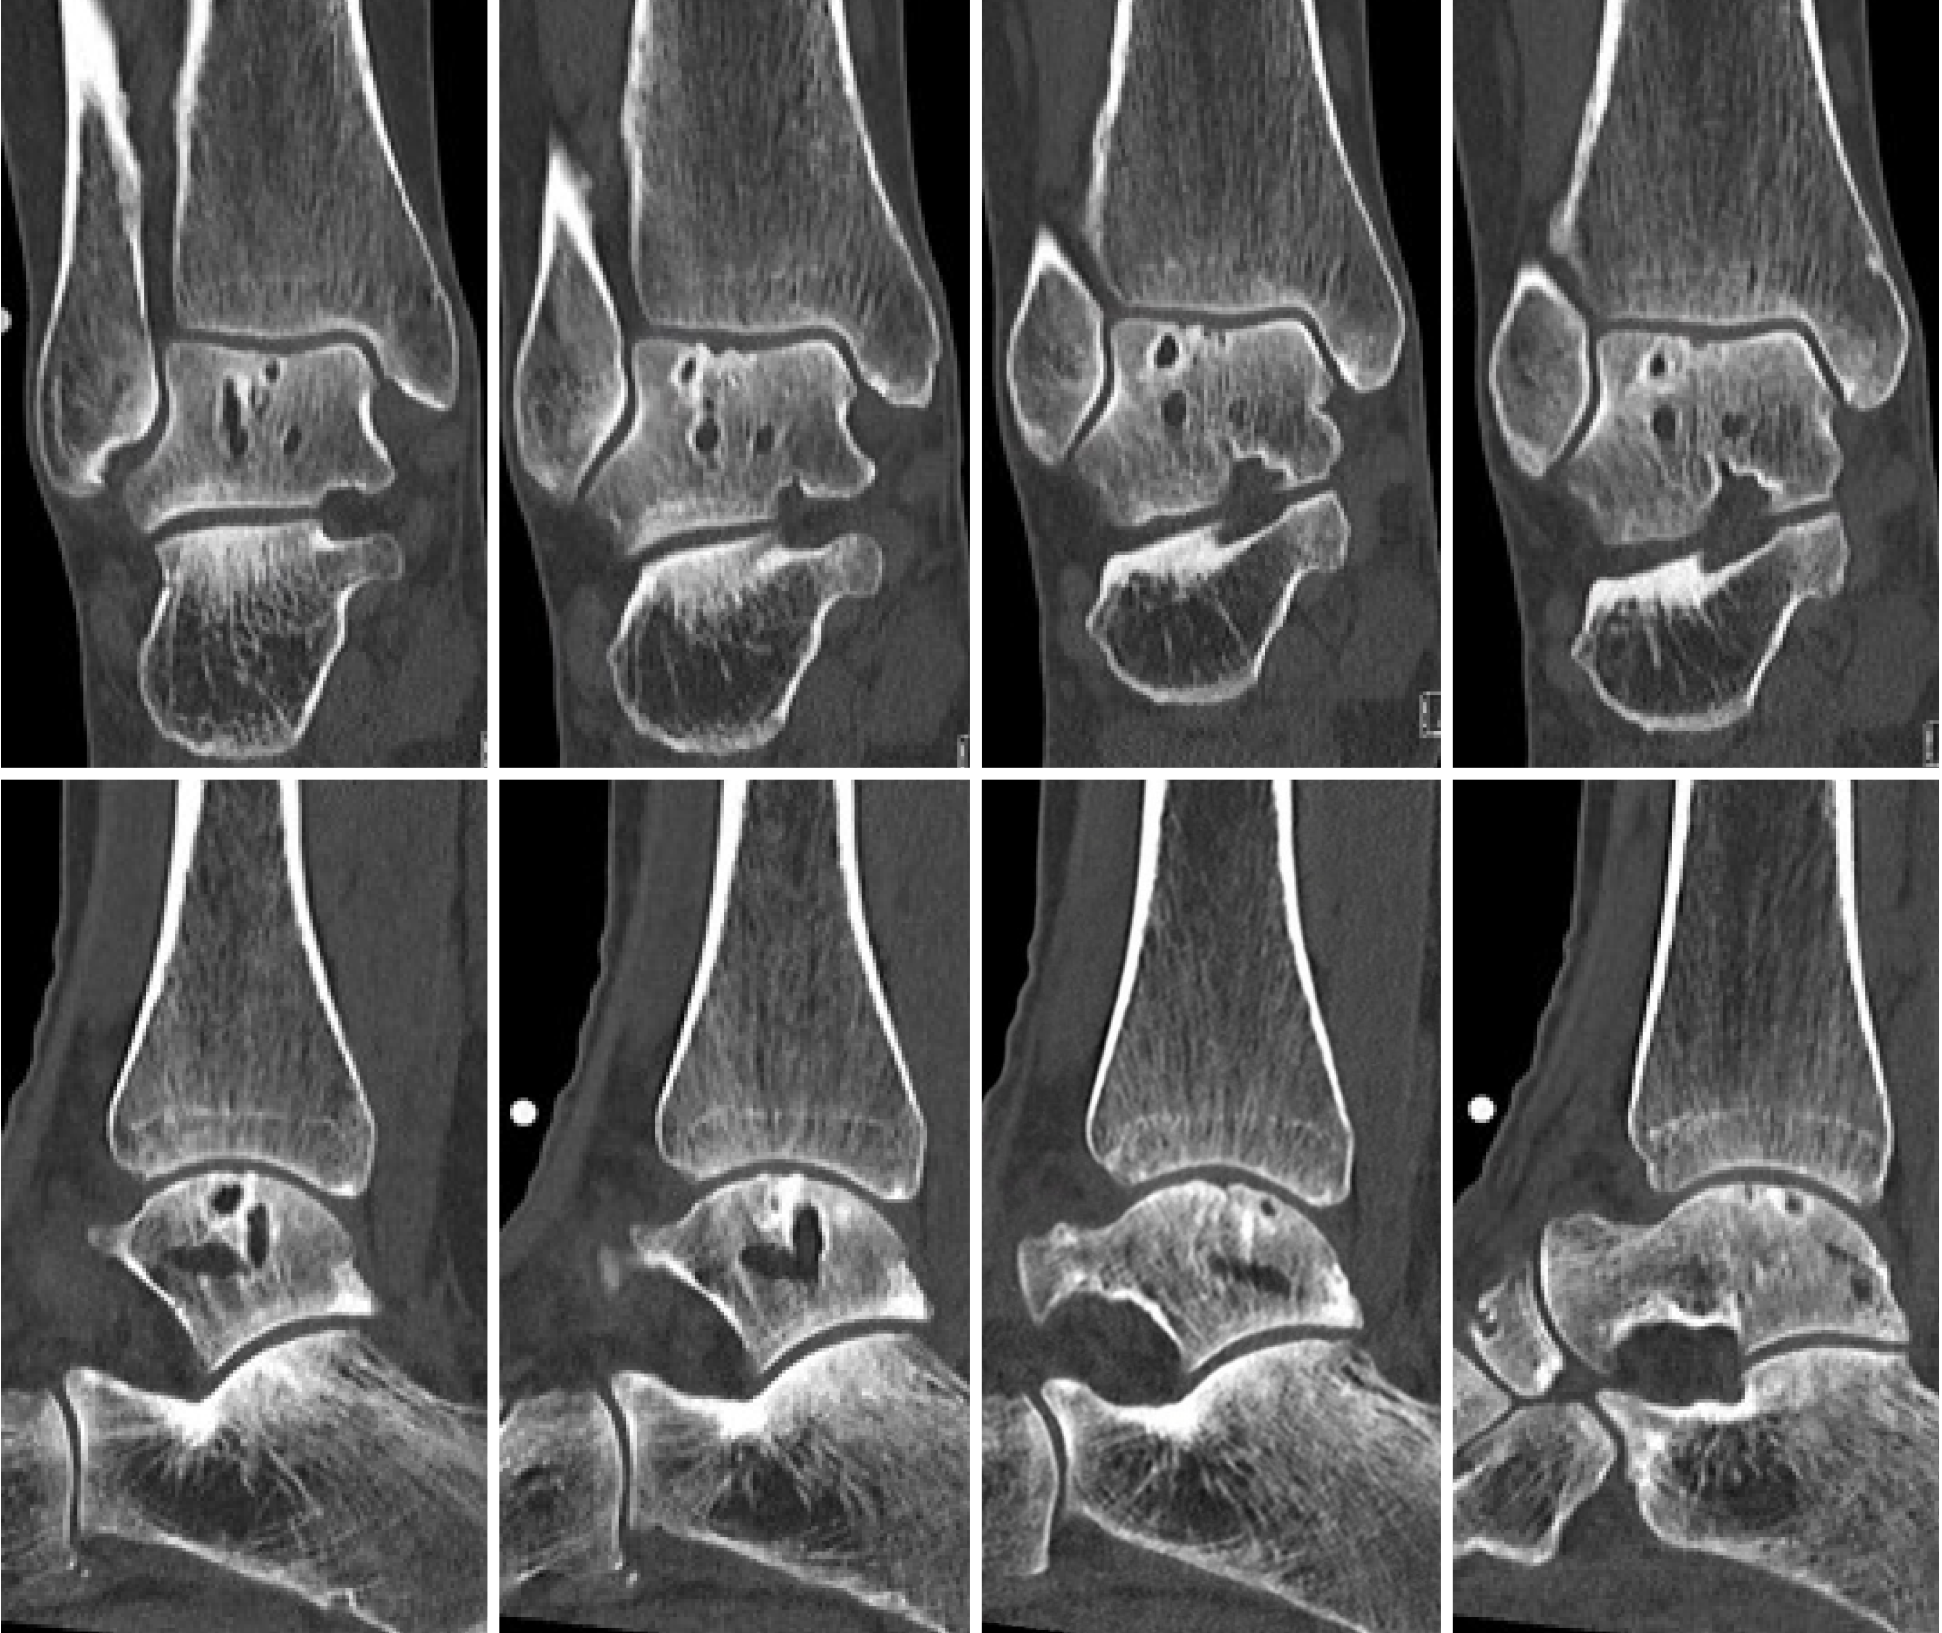
Figure 6 Pre-operative computed tomography scan of patient number 2: Upper part shows coronal slides with the images from left to right going into the posterior to anterior direction.
The lower part shows sagittal slides with the images from left to right going from lateral to medial.
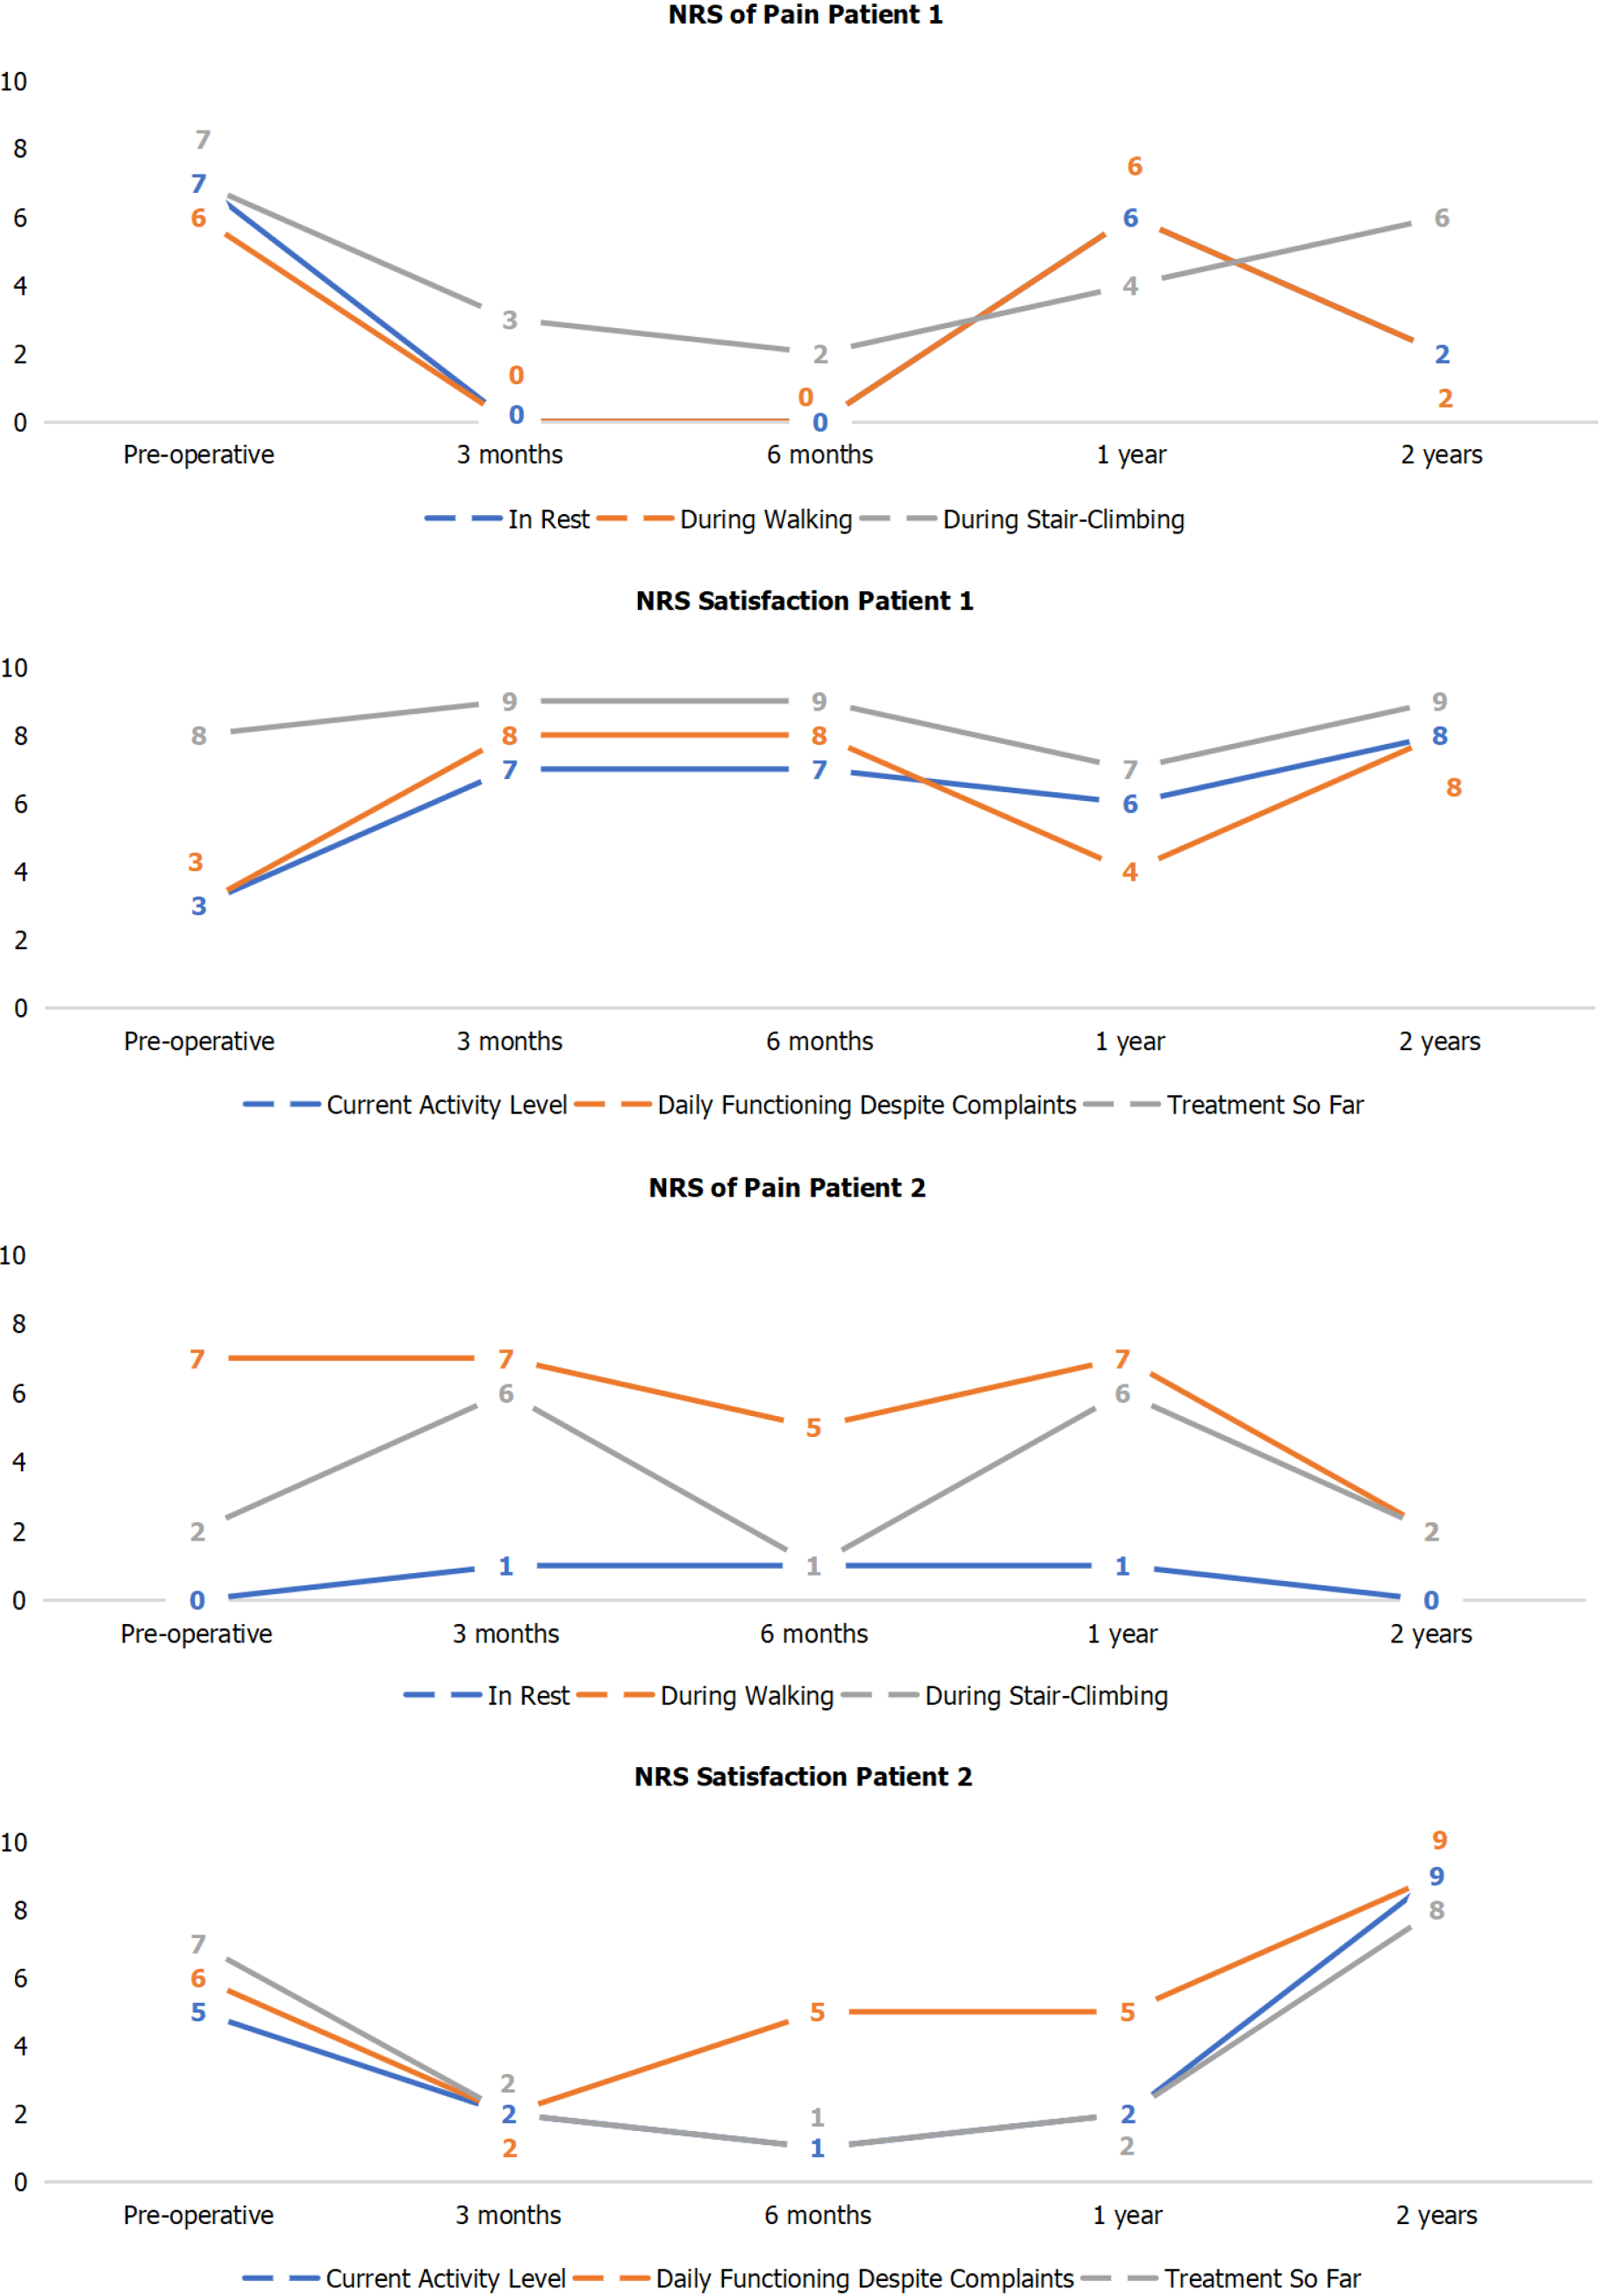
Figure 7 Pre-and postoperative Numeric Rating Scale scores of pain and satisfaction for patients 1 and 2.
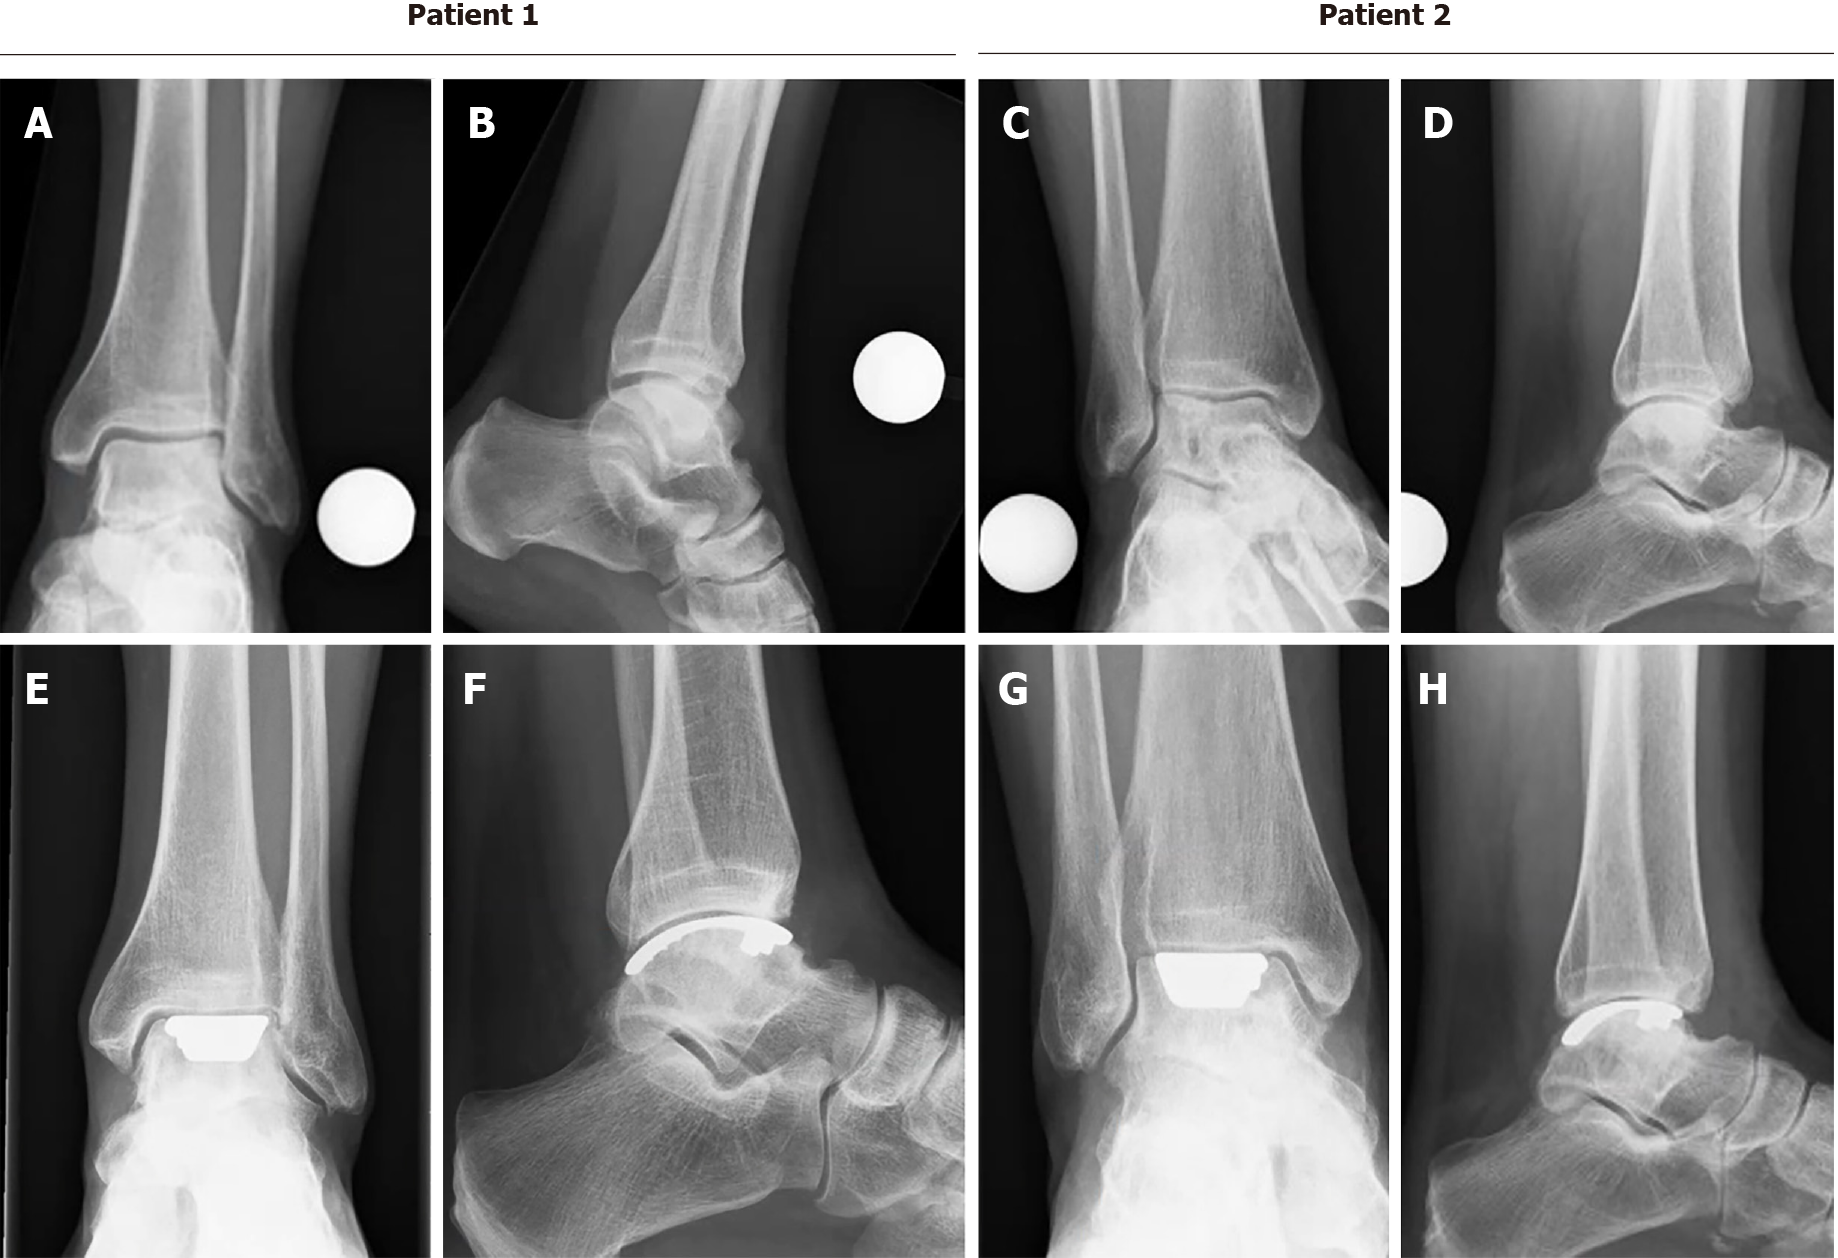
Figure 8 Preoperative and postoperative radiographs.
A and C: Preoperative mortise radiographs; B and D: Preoperative lateral radiograph; E and G: Postoperative mortise radiograph (2-years); F and H: Postoperative radiograph.
- Citation: Dahmen J, Altink JN, Vuurberg G, Wijdicks CA, Stufkens SA, Kerkhoffs GM. Clinical efficacy of the Ankle Spacer for the treatment of multiple secondary osteochondral lesions of the talus. World J Orthop 2022; 13(2): 178-192
- URL: https://www.wjgnet.com/2218-5836/full/v13/i2/178.htm
- DOI: https://dx.doi.org/10.5312/wjo.v13.i2.178


