Copyright
©The Author(s) 2022.
World J Orthop. Feb 18, 2022; 13(2): 160-170
Published online Feb 18, 2022. doi: 10.5312/wjo.v13.i2.160
Published online Feb 18, 2022. doi: 10.5312/wjo.v13.i2.160
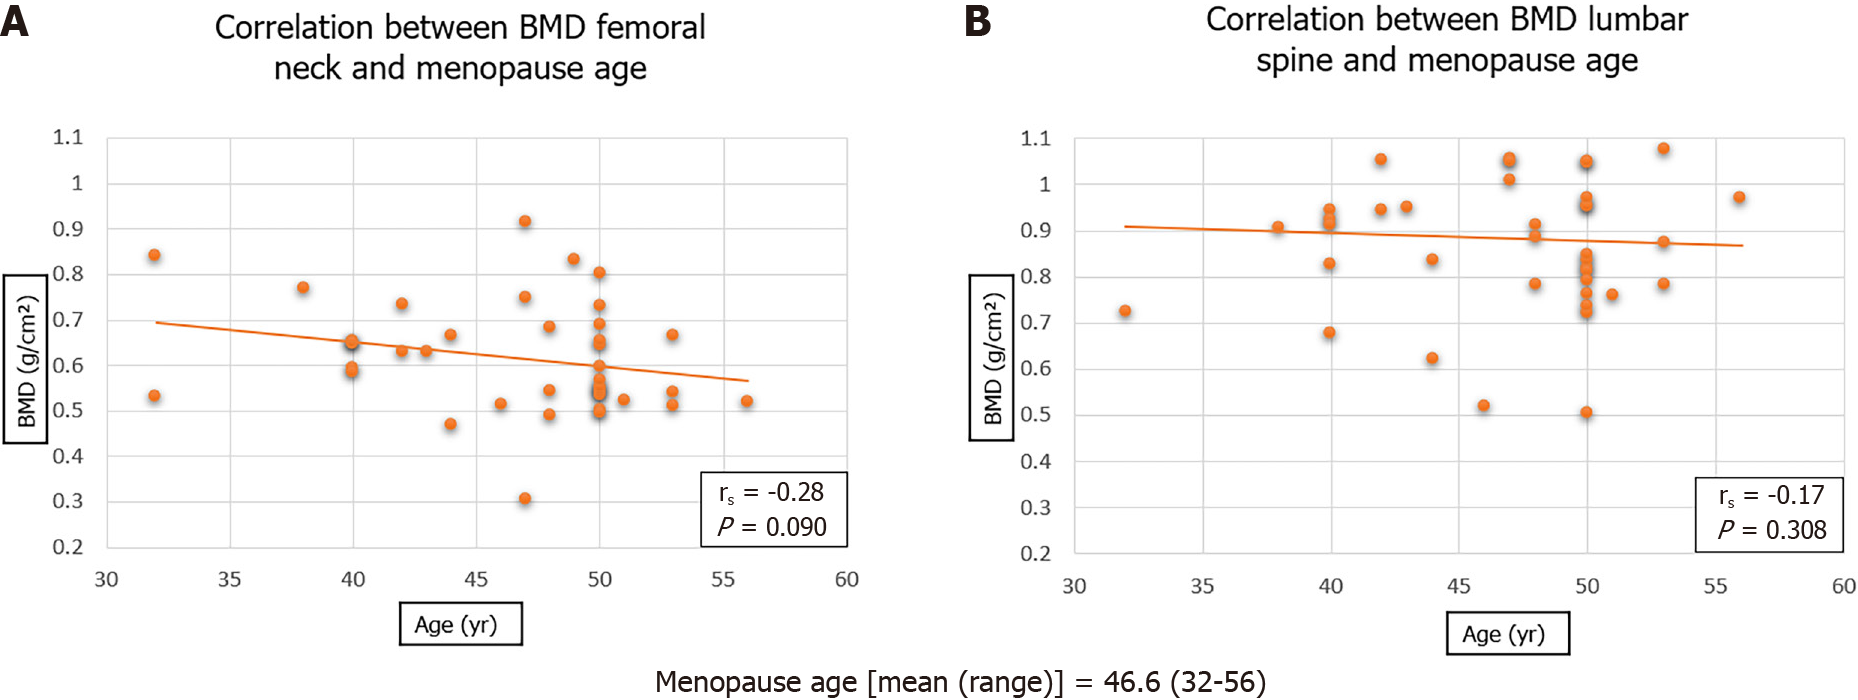
Figure 1 Scatter plot graphs of bone mineral density of femoral neck and lumbar spine with menopause age of female patients (n = 44) (Spearman Rank Correlation analysis).
A: Femoral neck; B: Lumbar spine. BMD: Bone mineral density.
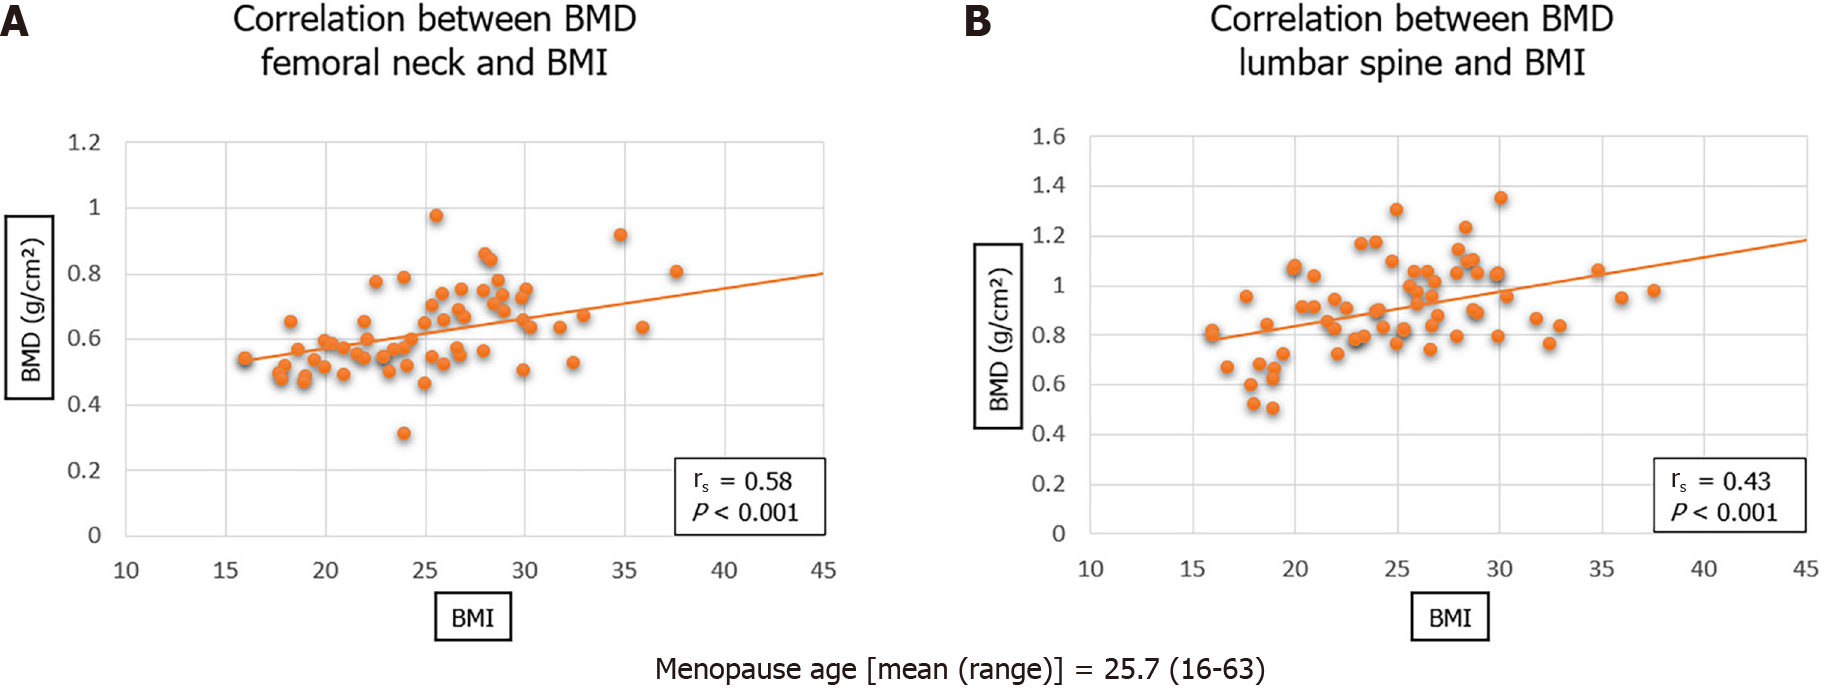
Figure 2 Scatter plot graphs of bone mineral density of femoral neck and lumbar spine with body mass index (n = 69) (Spearman Rank Correlation analysis).
A: Femoral neck; B: Lumbar spine. BMD: Bone mineral density; BMI: Body mass index.
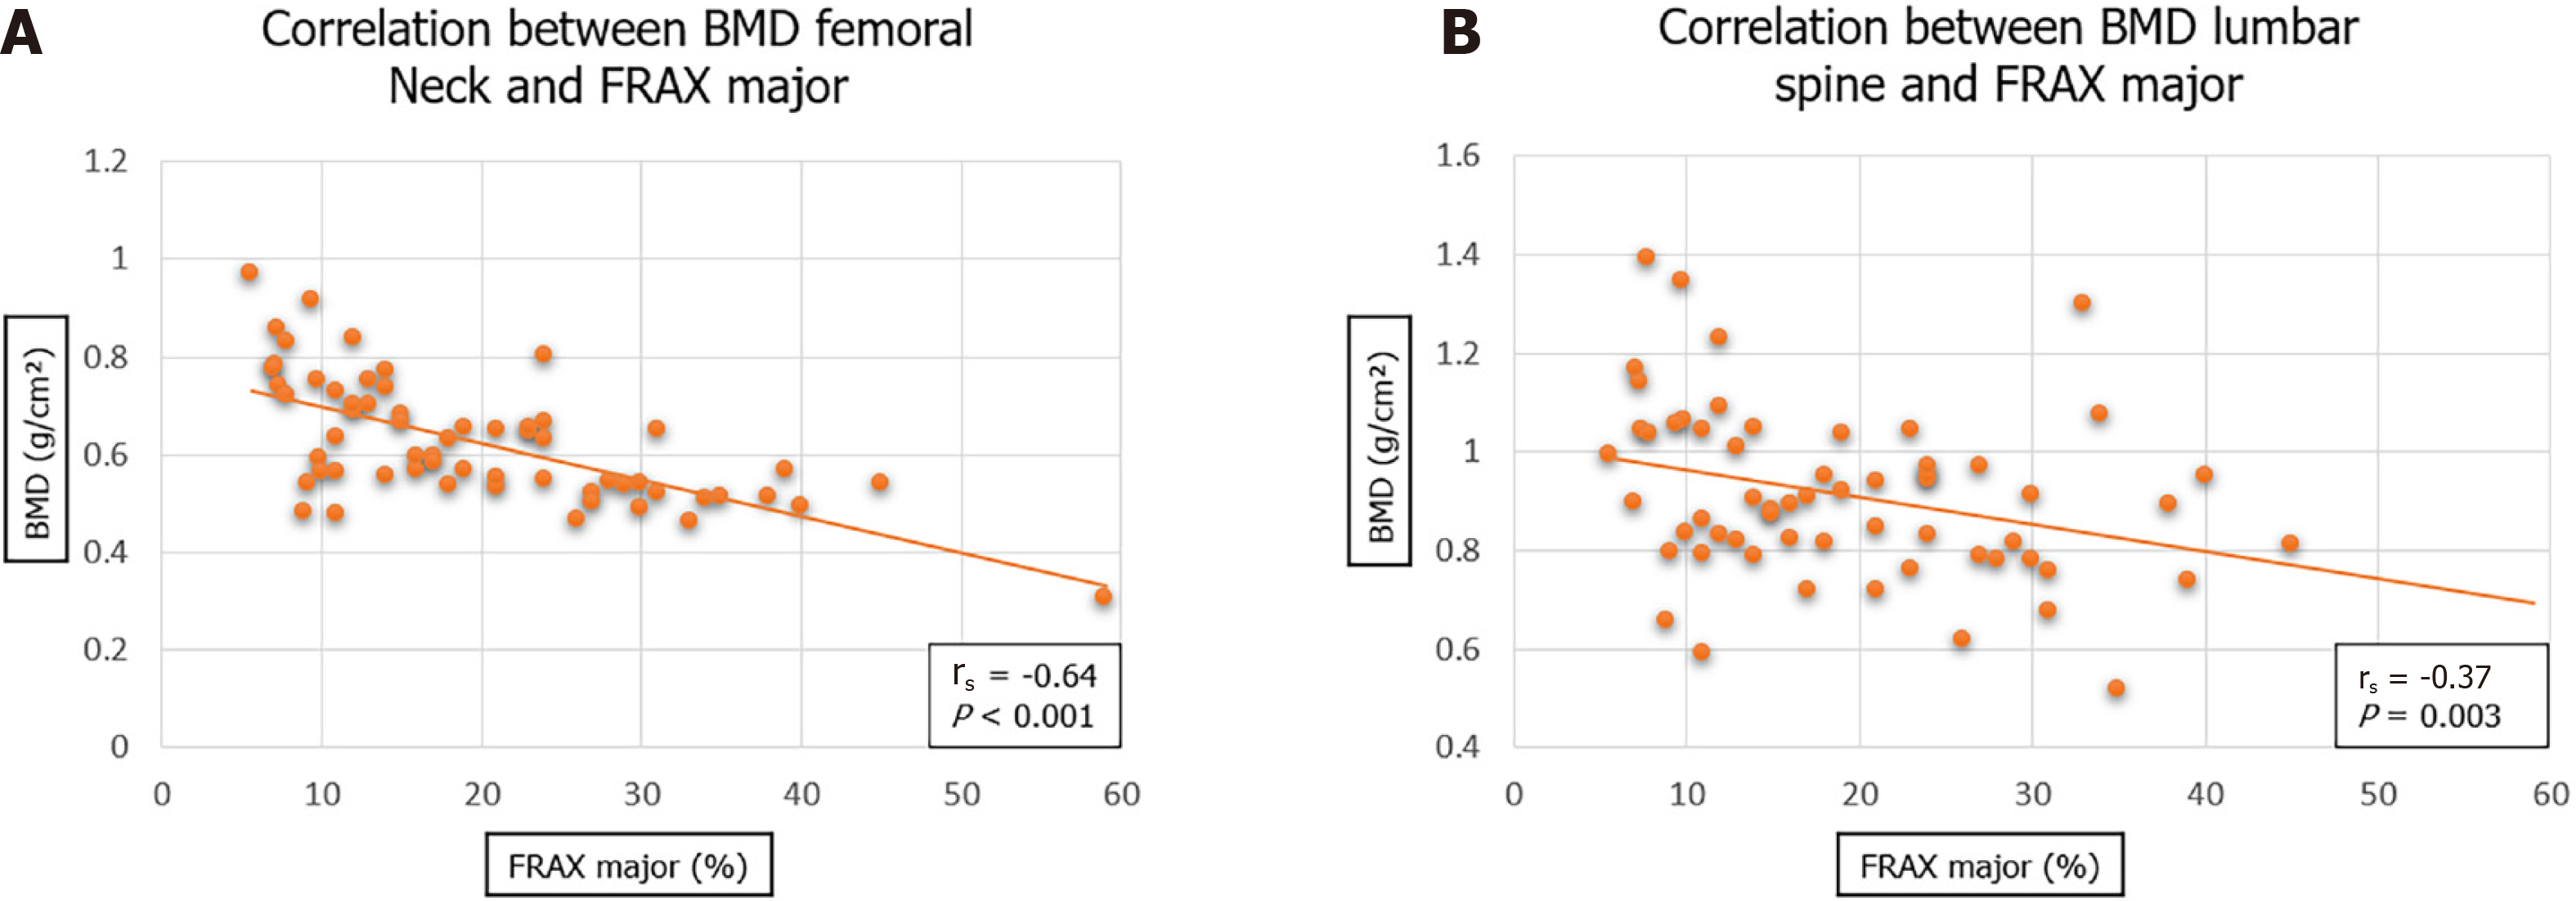
Figure 3 Scatter plot graphs of bone mineral density of femoral neck and lumbar spine with Fracture Risk Assessment Tool major score (n = 69) (Spearman Rank Correlation analysis).
A: Femoral neck; B: Lumbar spine. BMD: Bone mineral density; FRAX: Fracture Risk Assessment Tool.
- Citation: Elamin Ahmed H, Al-Dadah O. Bone mineral density in fracture neck of femur patients: What's the significance? World J Orthop 2022; 13(2): 160-170
- URL: https://www.wjgnet.com/2218-5836/full/v13/i2/160.htm
- DOI: https://dx.doi.org/10.5312/wjo.v13.i2.160


