Copyright
©The Author(s) 2022.
World J Orthop. Oct 18, 2022; 13(10): 921-931
Published online Oct 18, 2022. doi: 10.5312/wjo.v13.i10.921
Published online Oct 18, 2022. doi: 10.5312/wjo.v13.i10.921
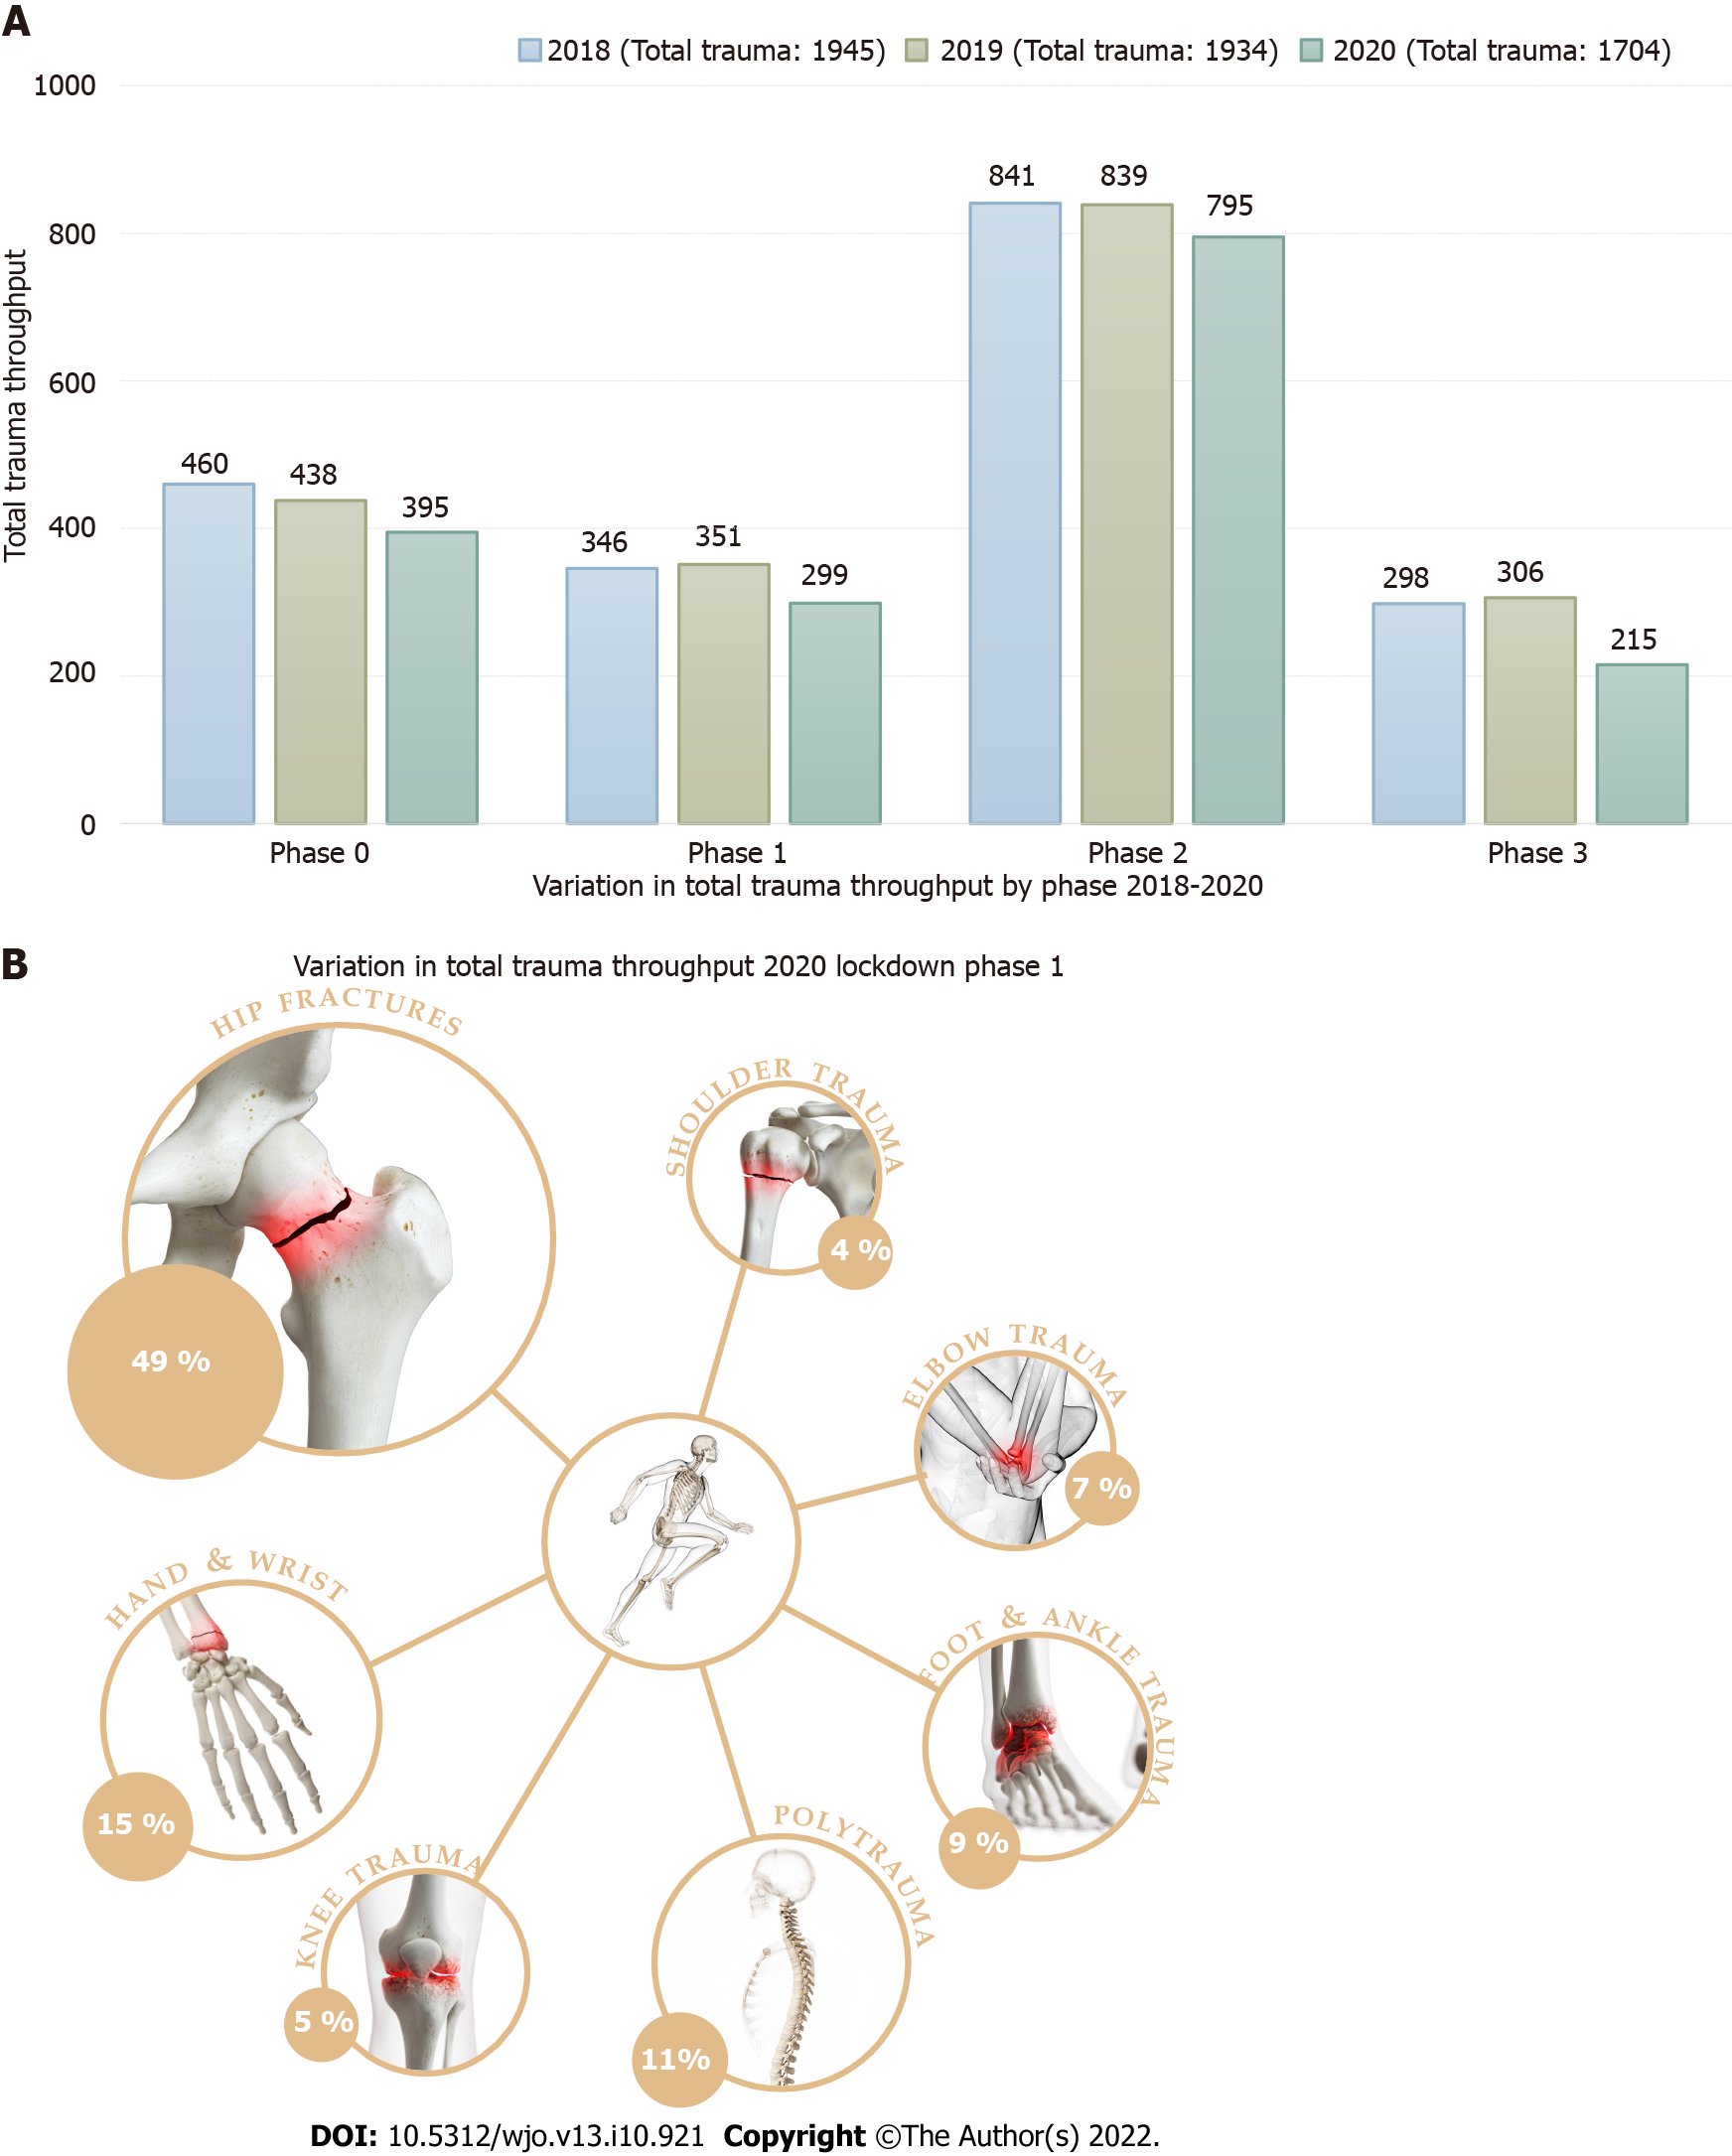
Figure 1 Variation in total trauma throughput.
A: By phase; B: During the 2020 lockdown phase 1, images obtained viawww.shutterstock.com using standard image licence agreement. (SciePro/shutterstock). Complete image exclusively designed and created by the authors.
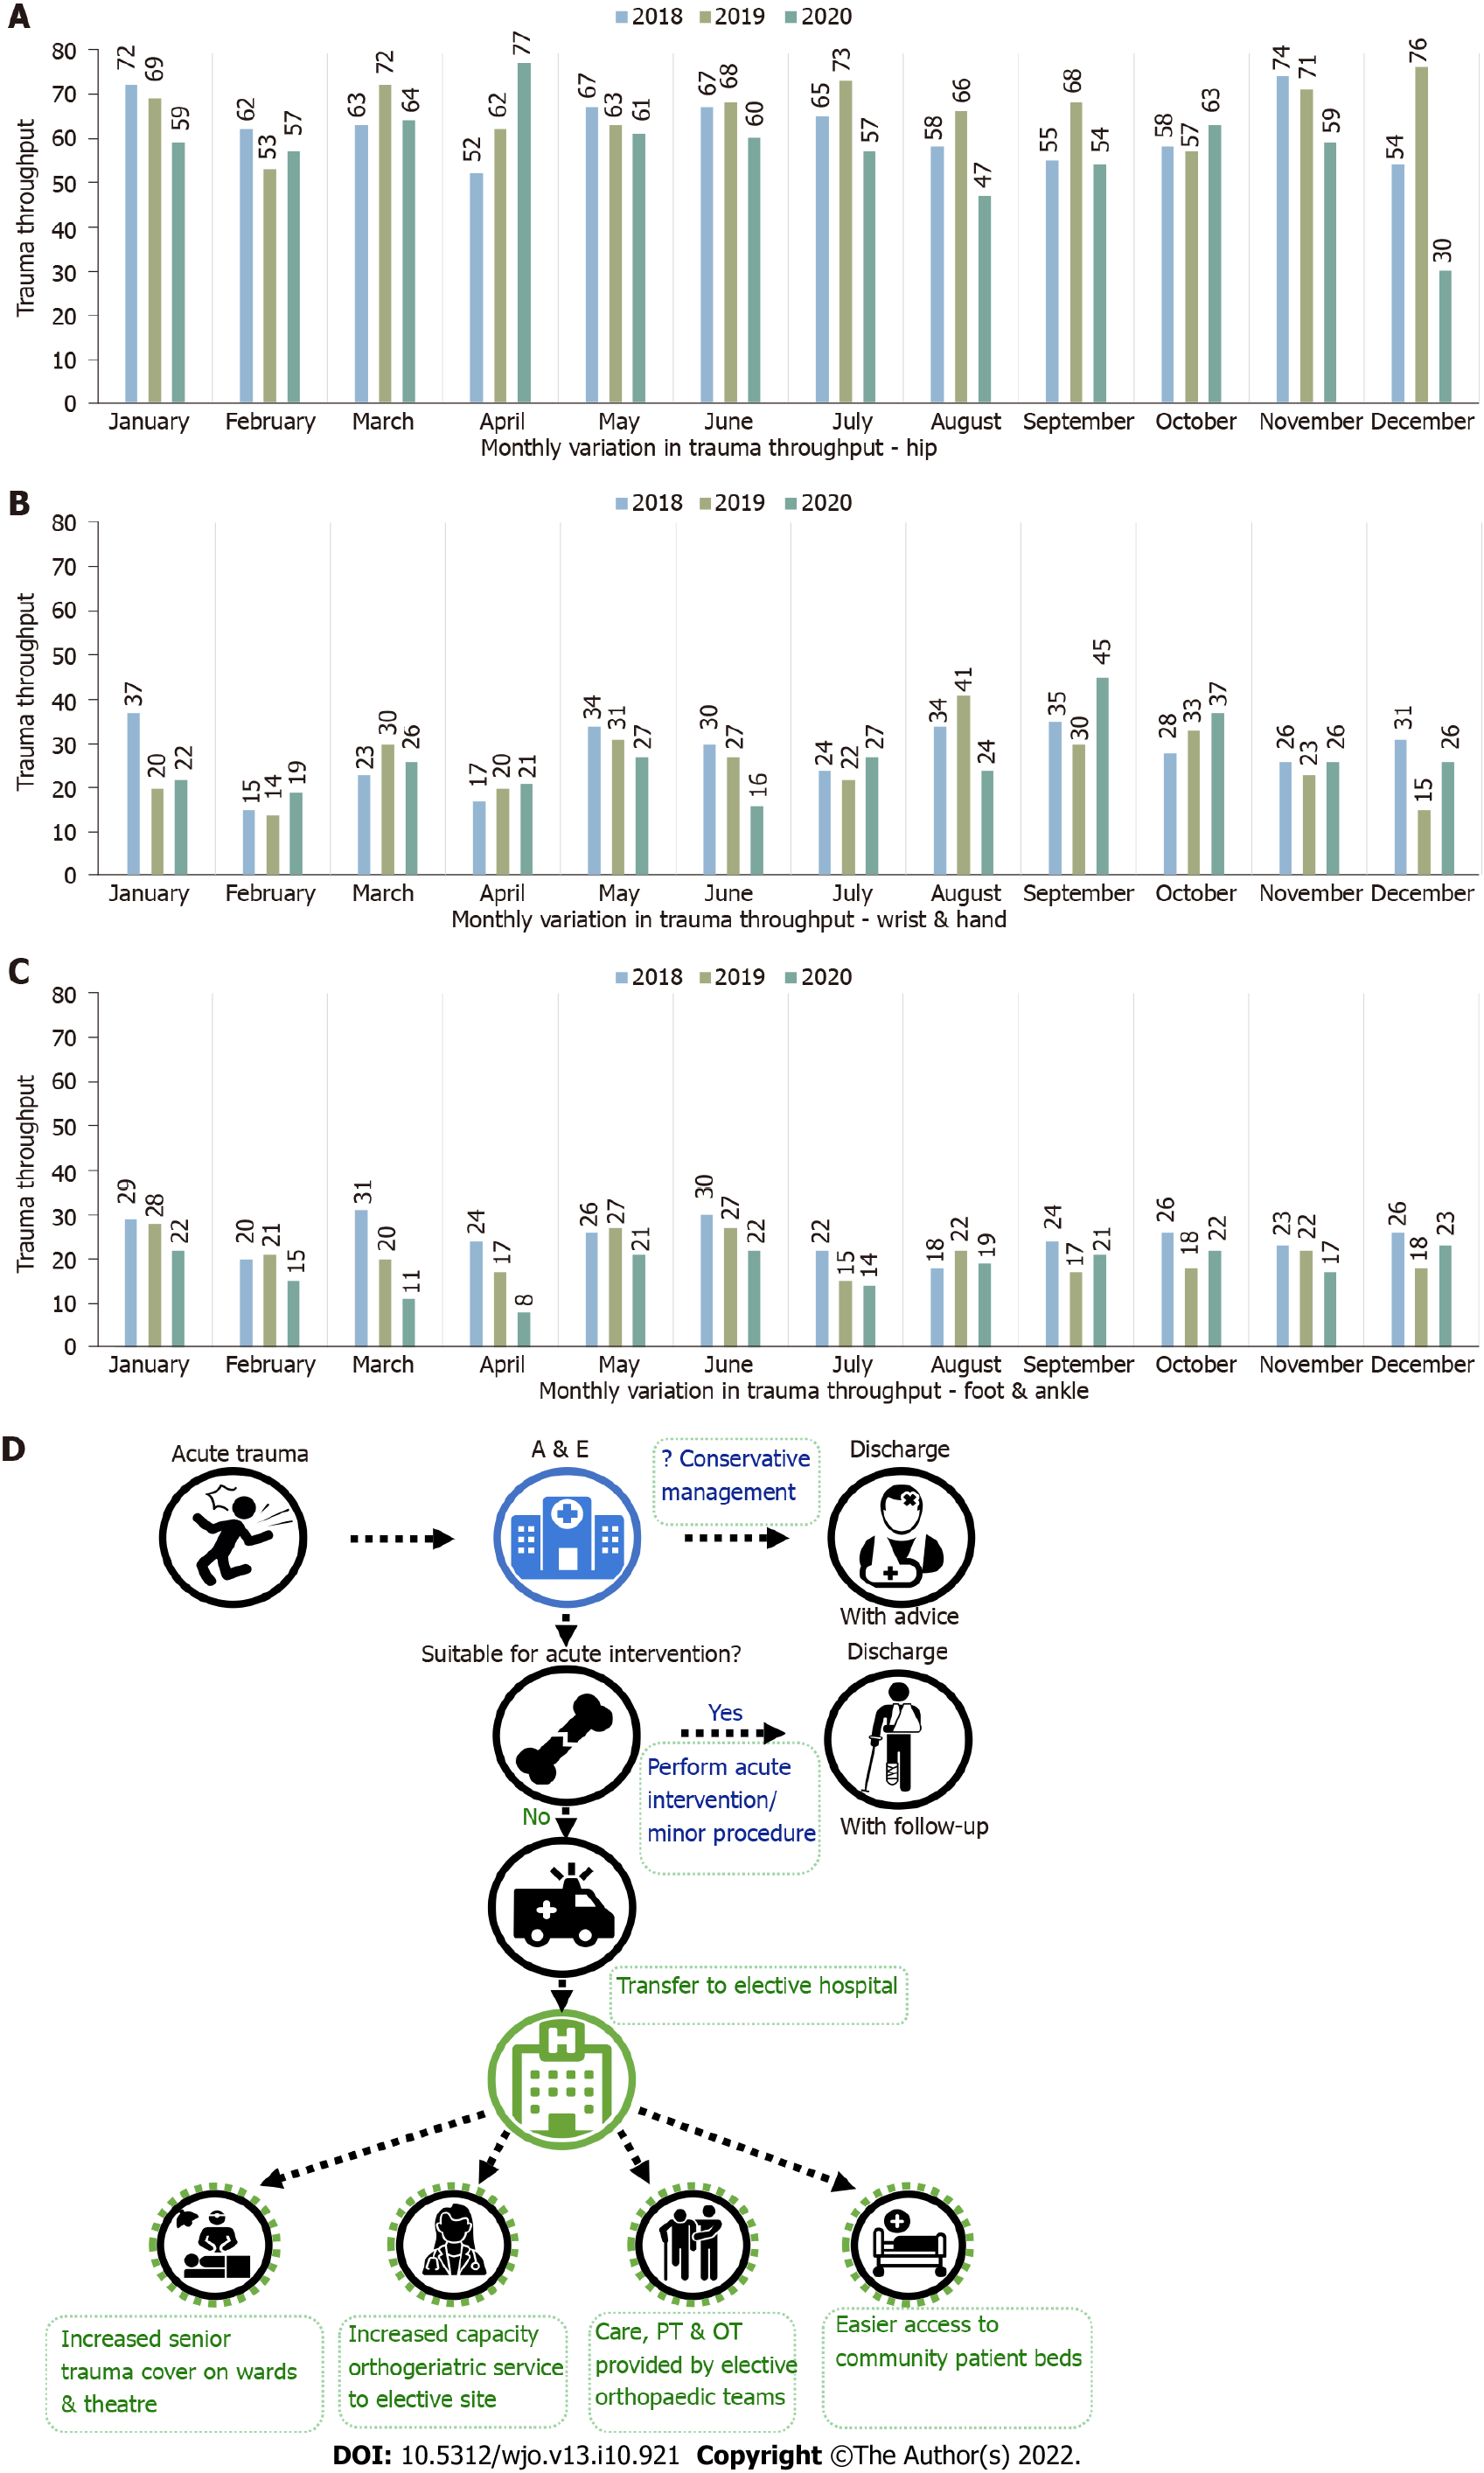
Figure 2 Monthly variation in trauma throughput.
A: Hip; B: Wrist & hand; C: Foot & ankle; D: Infographic, icons made by Freepik, icongeek26, iconmas and uniconlabs from www.flaticon.com and www.pngwing.com. Complete image exclusively designed and created by the authors.
- Citation: Kulkarni K, Shah R, Mangwani J, Ullah A, Gabbar O, James E, Dias J. Utilising the impact of COVID-19 on trauma throughput to adapt elective care models for more efficient trauma care. World J Orthop 2022; 13(10): 921-931
- URL: https://www.wjgnet.com/2218-5836/full/v13/i10/921.htm
- DOI: https://dx.doi.org/10.5312/wjo.v13.i10.921


