Copyright
©The Author(s) 2022.
World J Orthop. Jan 18, 2022; 13(1): 87-101
Published online Jan 18, 2022. doi: 10.5312/wjo.v13.i1.87
Published online Jan 18, 2022. doi: 10.5312/wjo.v13.i1.87
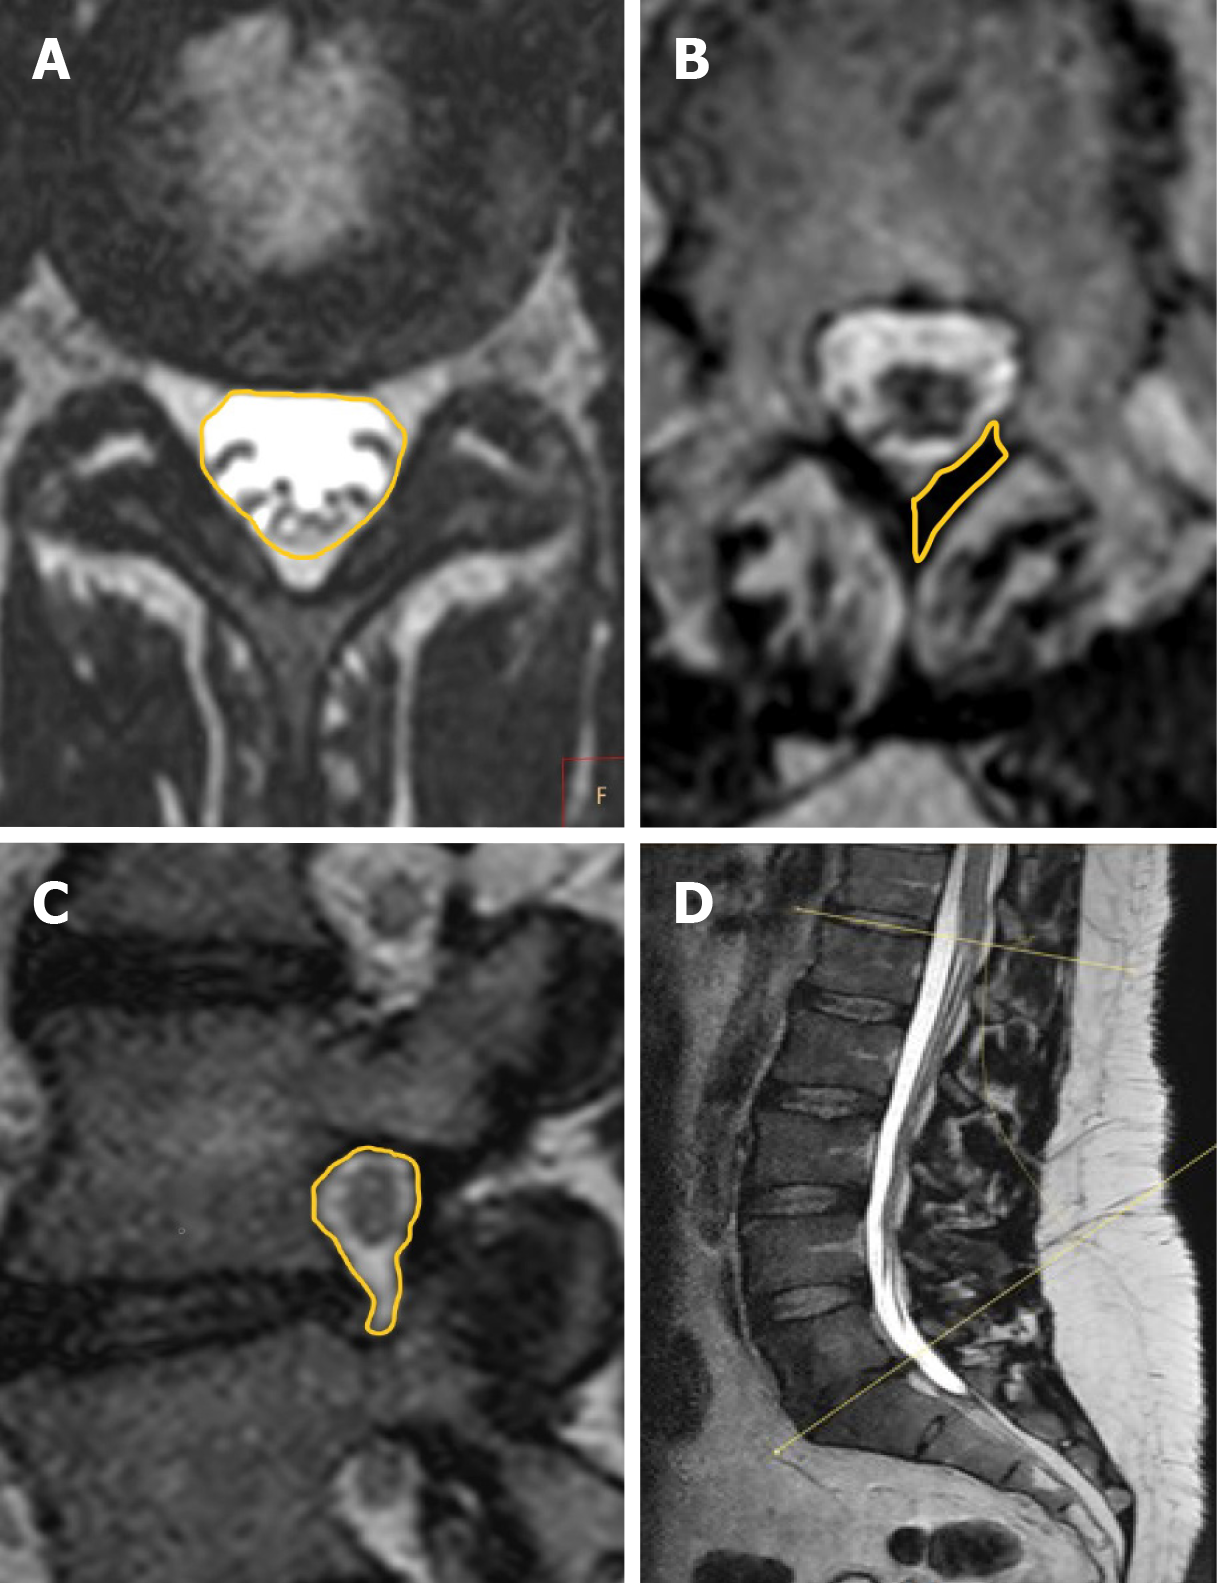
Figure 1 Specific measurements of (A) the cross-section area of the dural sac on transverse magnetic resonance imaging, (B) the cross-section area of the ligamentum flavum, (C) the sagittal cross-section area of vertebral foramina and (D) the lumbosacral angles between L1 and S1.
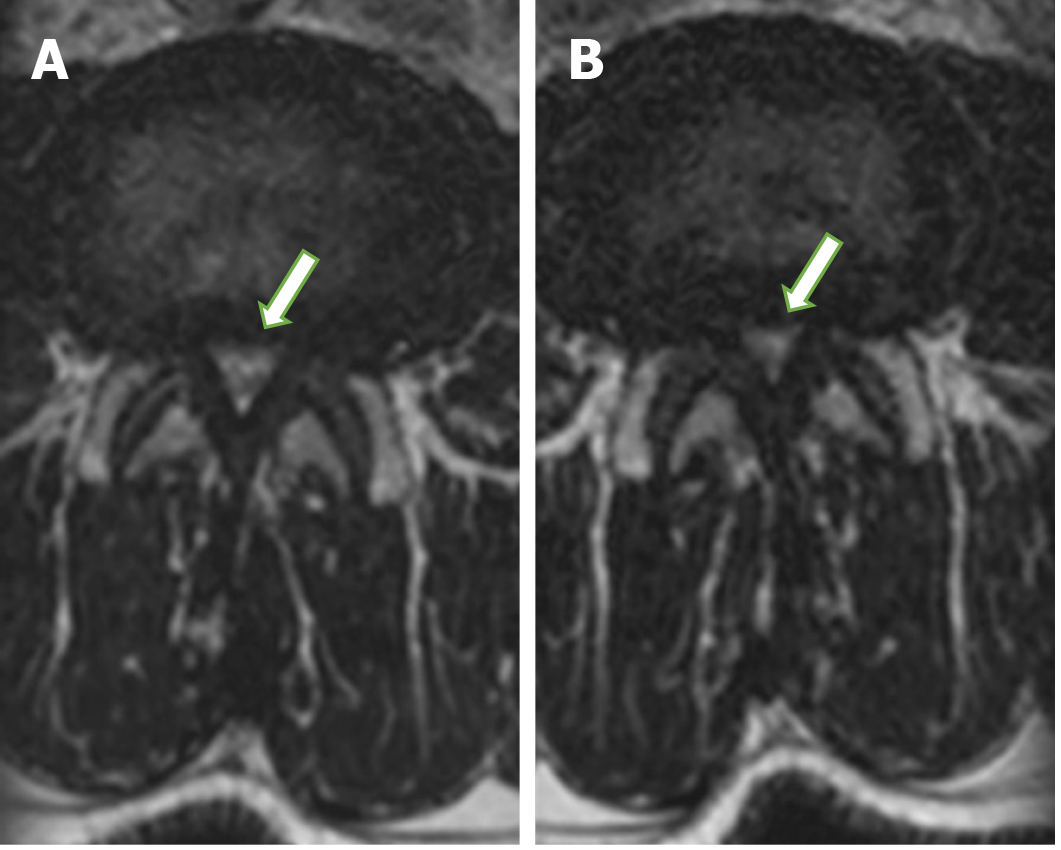
Figure 2 Transverse magnetic resonance imaging.
A: Recumbent T2-weighted images. The rootlets occupy the whole of the dural sac (arrow), but they can still be individualized; B: Spinal stenosis with a reduction in the dural sac size after axial loading. No rootlets can be recognized, but some cerebrospinal fluid is still present, giving a grainy appearance to the sac (arrow).
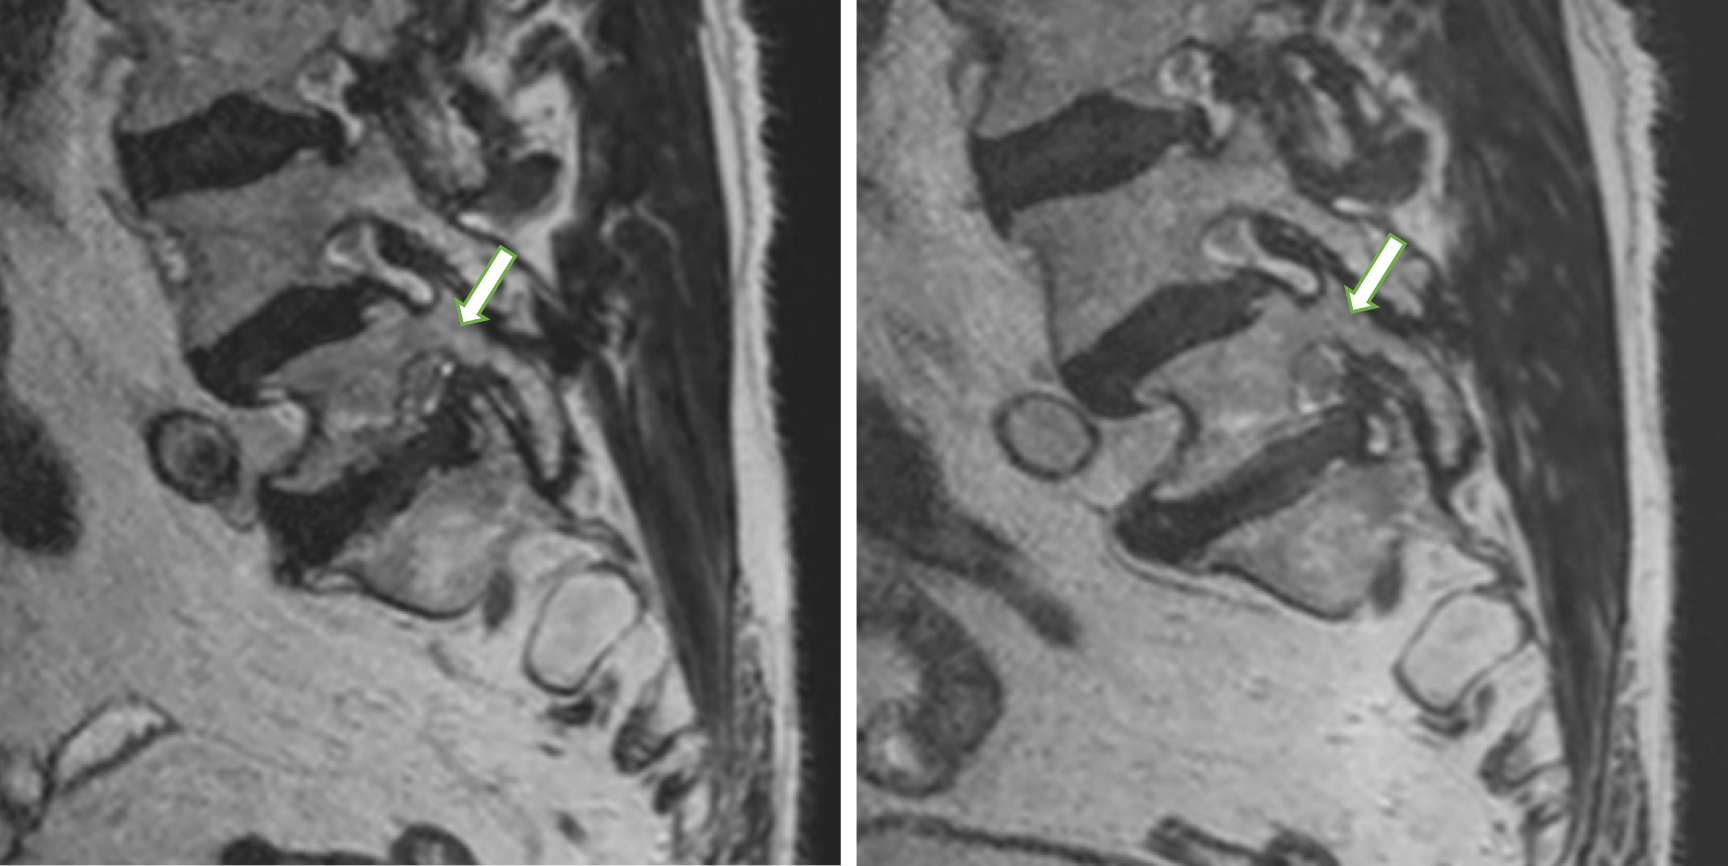
Figure 3 Sagittal magnetic resonance imaging.
Morphologic changes in a foraminal zone at L5-S1 (arrow) with nerve root collapse and perineural fat obliteration were seen with and without axial loading.
- Citation: Lorenc T, Gołębiowski M, Michalski W, Glinkowski W. High-resolution, three-dimensional magnetic resonance imaging axial load dynamic study improves diagnostics of the lumbar spine in clinical practice. World J Orthop 2022; 13(1): 87-101
- URL: https://www.wjgnet.com/2218-5836/full/v13/i1/87.htm
- DOI: https://dx.doi.org/10.5312/wjo.v13.i1.87


