Copyright
©The Author(s) 2020.
World J Orthop. Oct 18, 2020; 11(10): 431-441
Published online Oct 18, 2020. doi: 10.5312/wjo.v11.i10.431
Published online Oct 18, 2020. doi: 10.5312/wjo.v11.i10.431
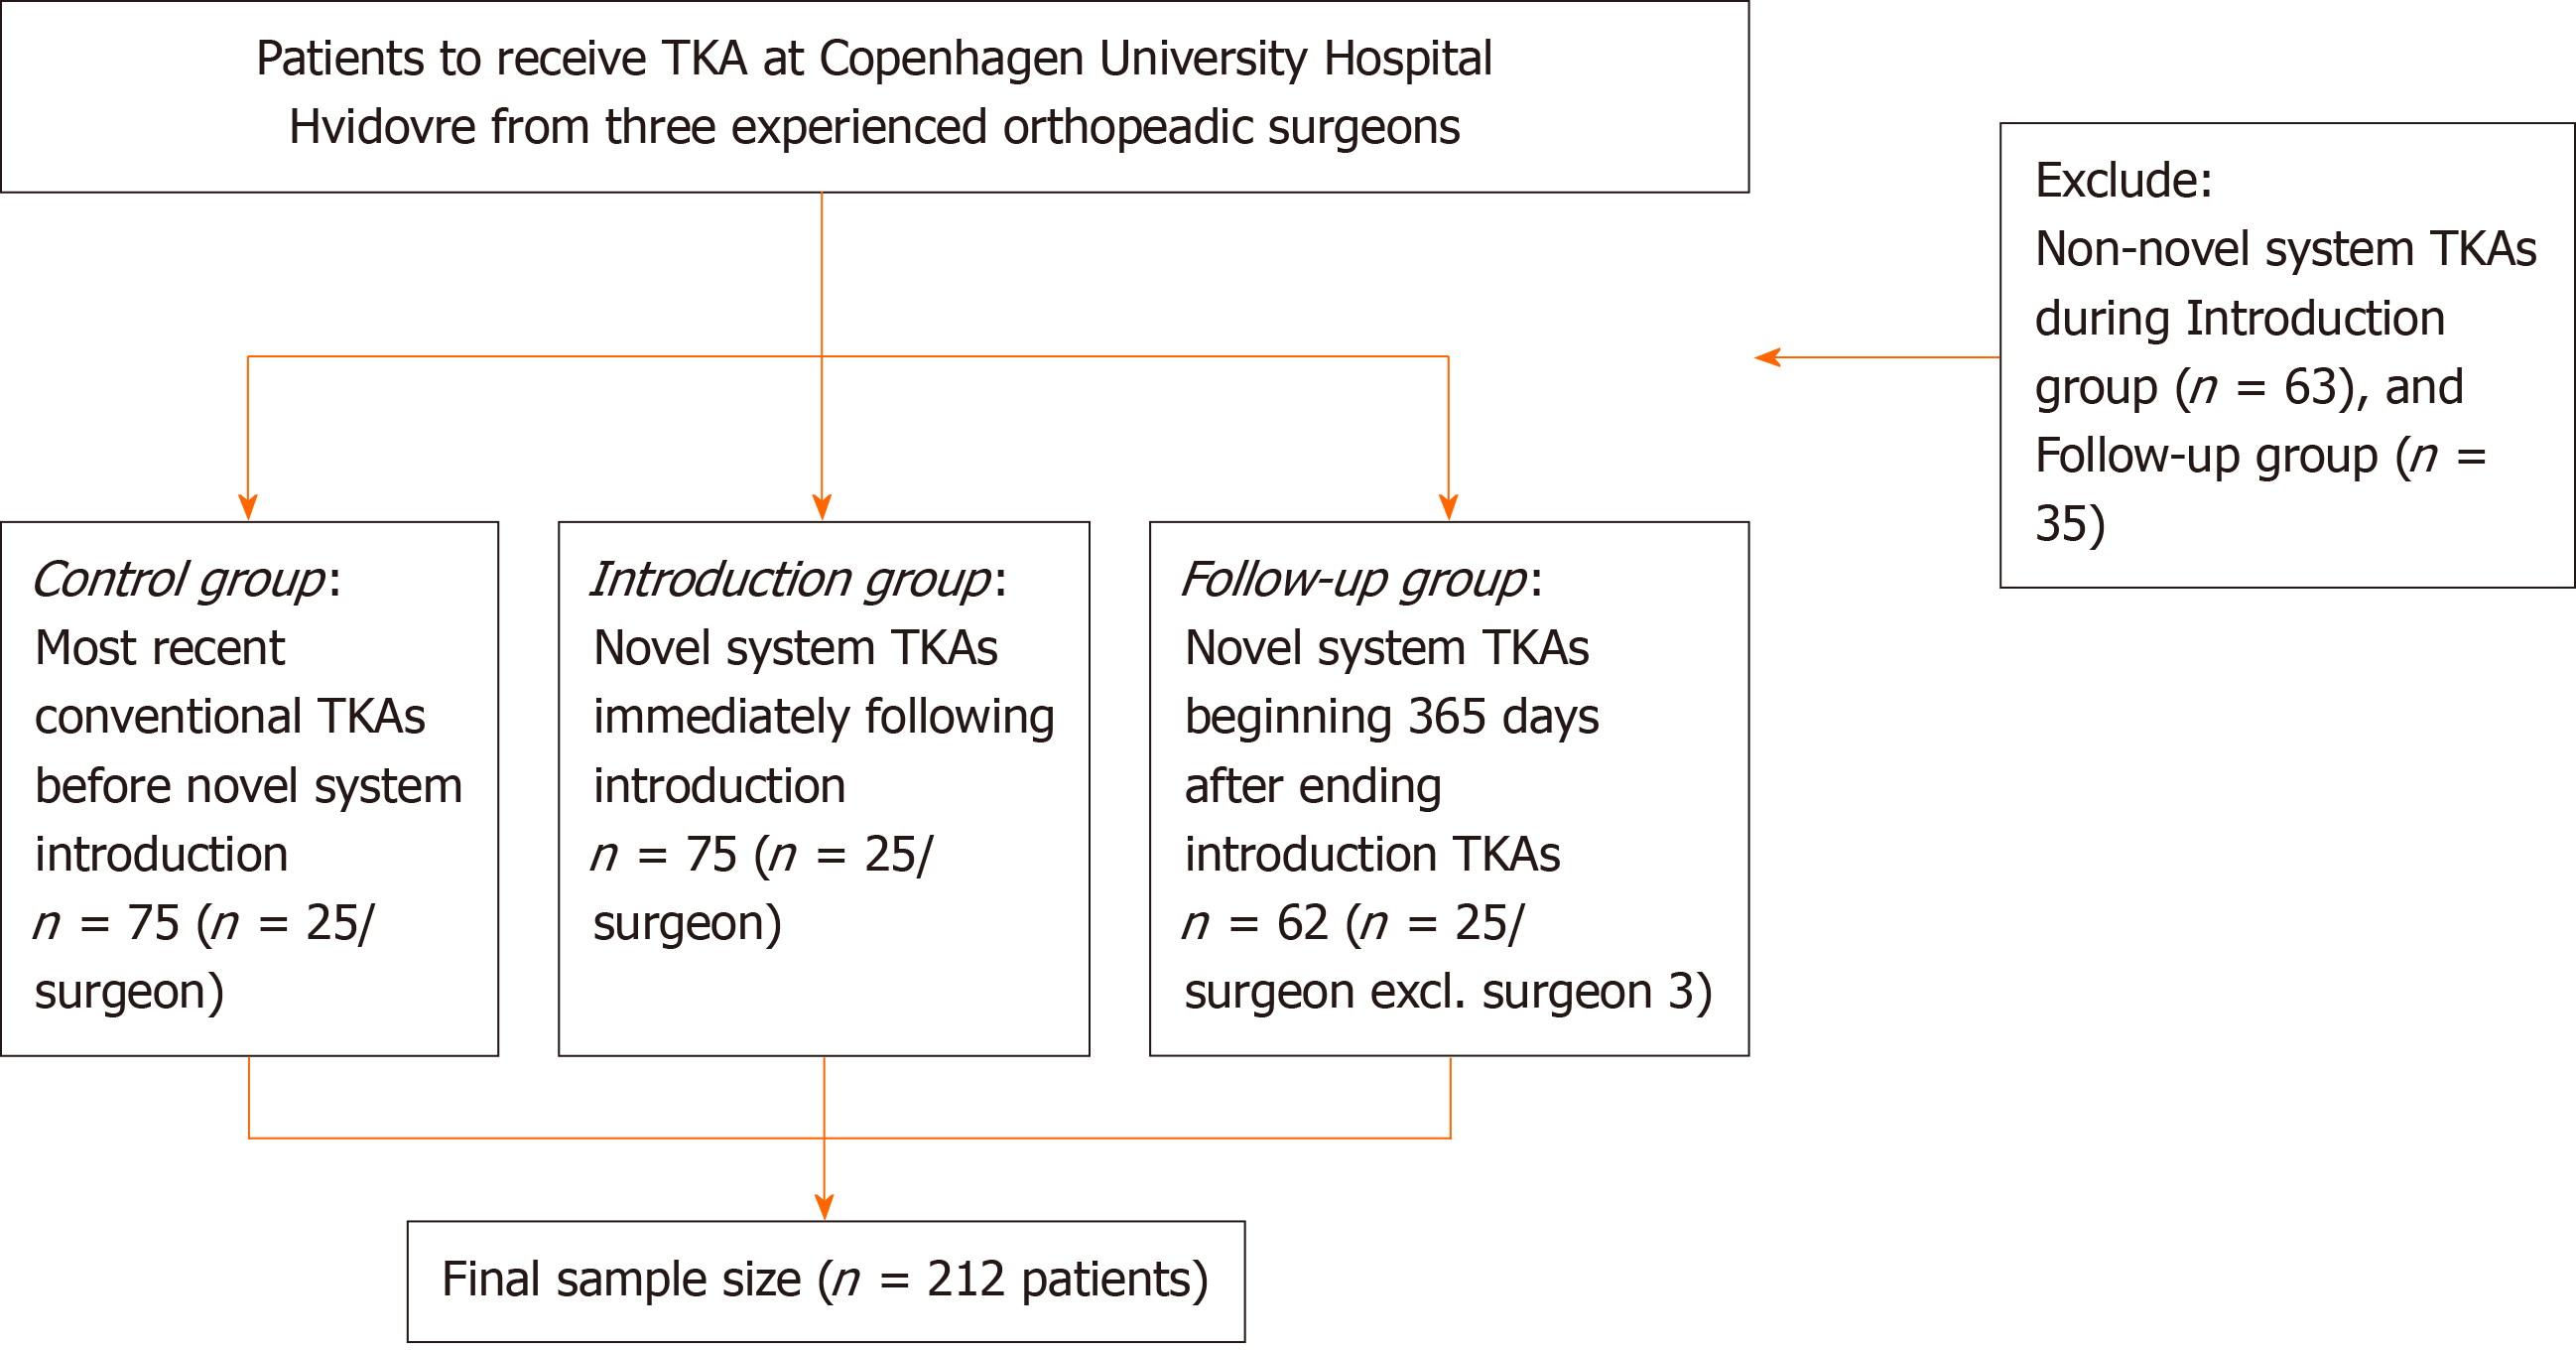
Figure 1 Flowchart representing the selection process.
TKA: Total knee arthroplasty.
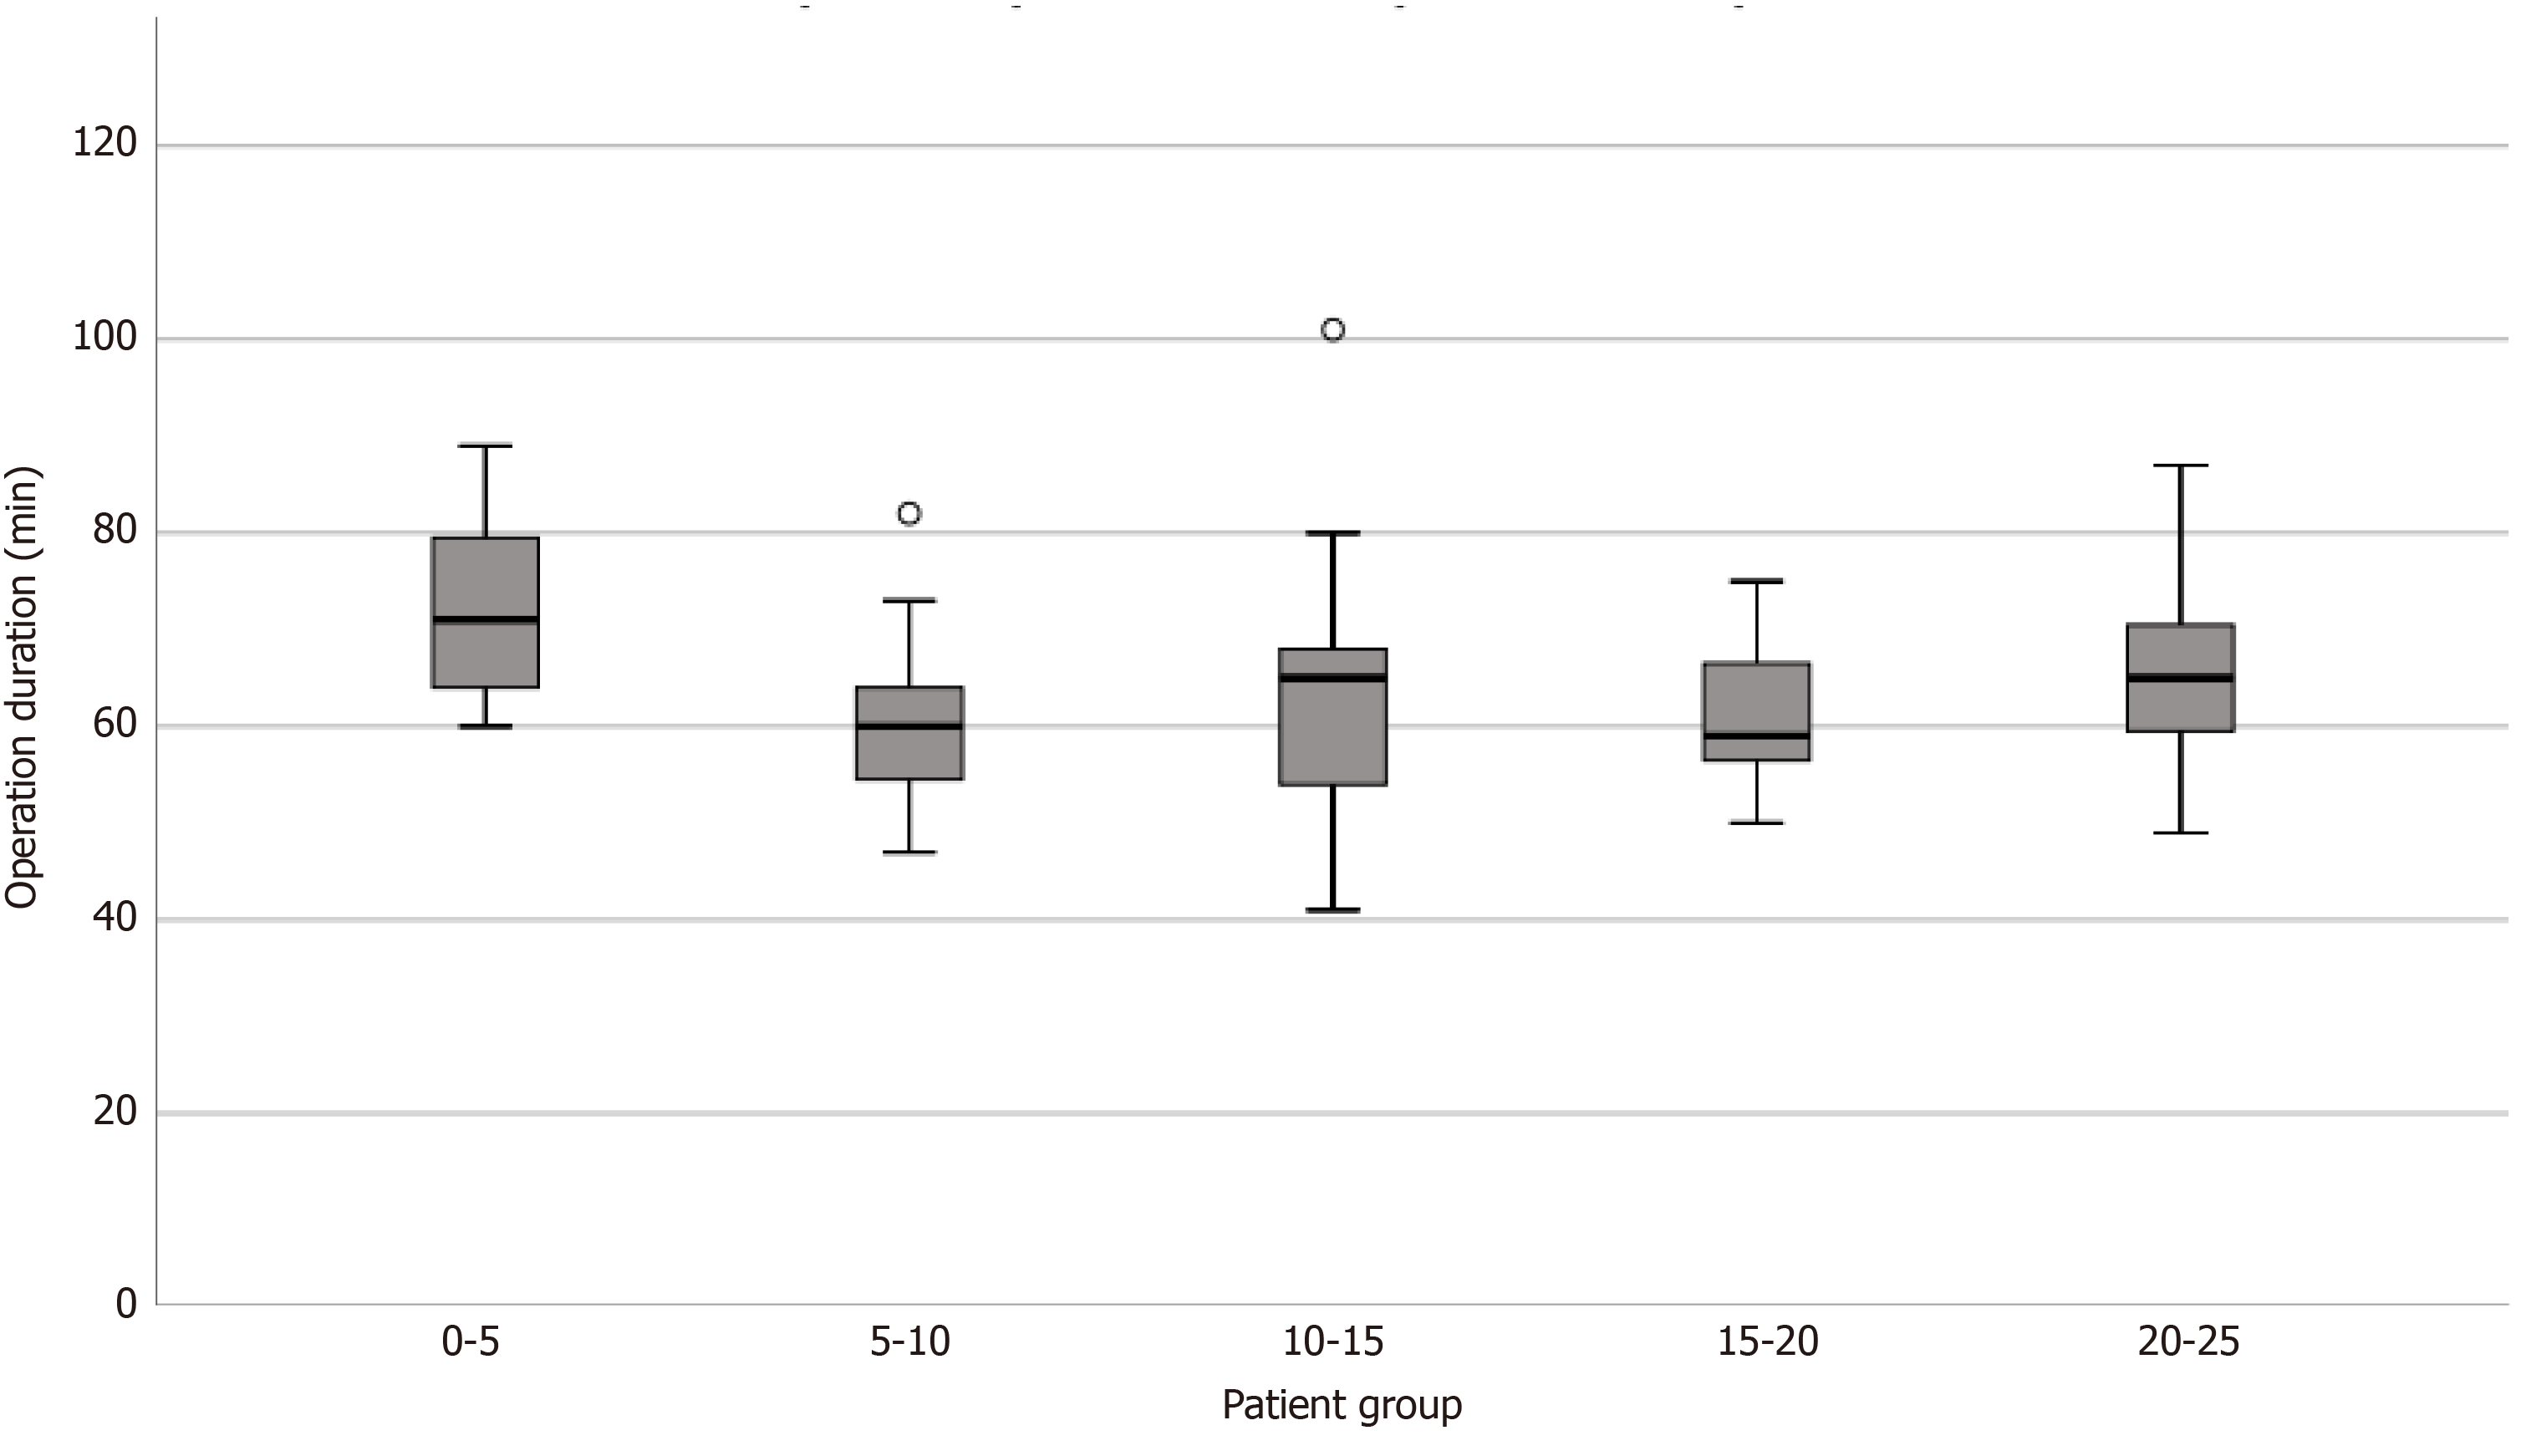
Figure 2 Initial learning curve effect on operation duration in the first 25 novel total knee arthroplasties.
The box represents the interquartile (IQ) range. Median indicated by line across the box; The whiskers are no greater than 1.5 times the IQ range; Outliers are cases with values between 1.5 and 3 times the IQ range depicted by circles.
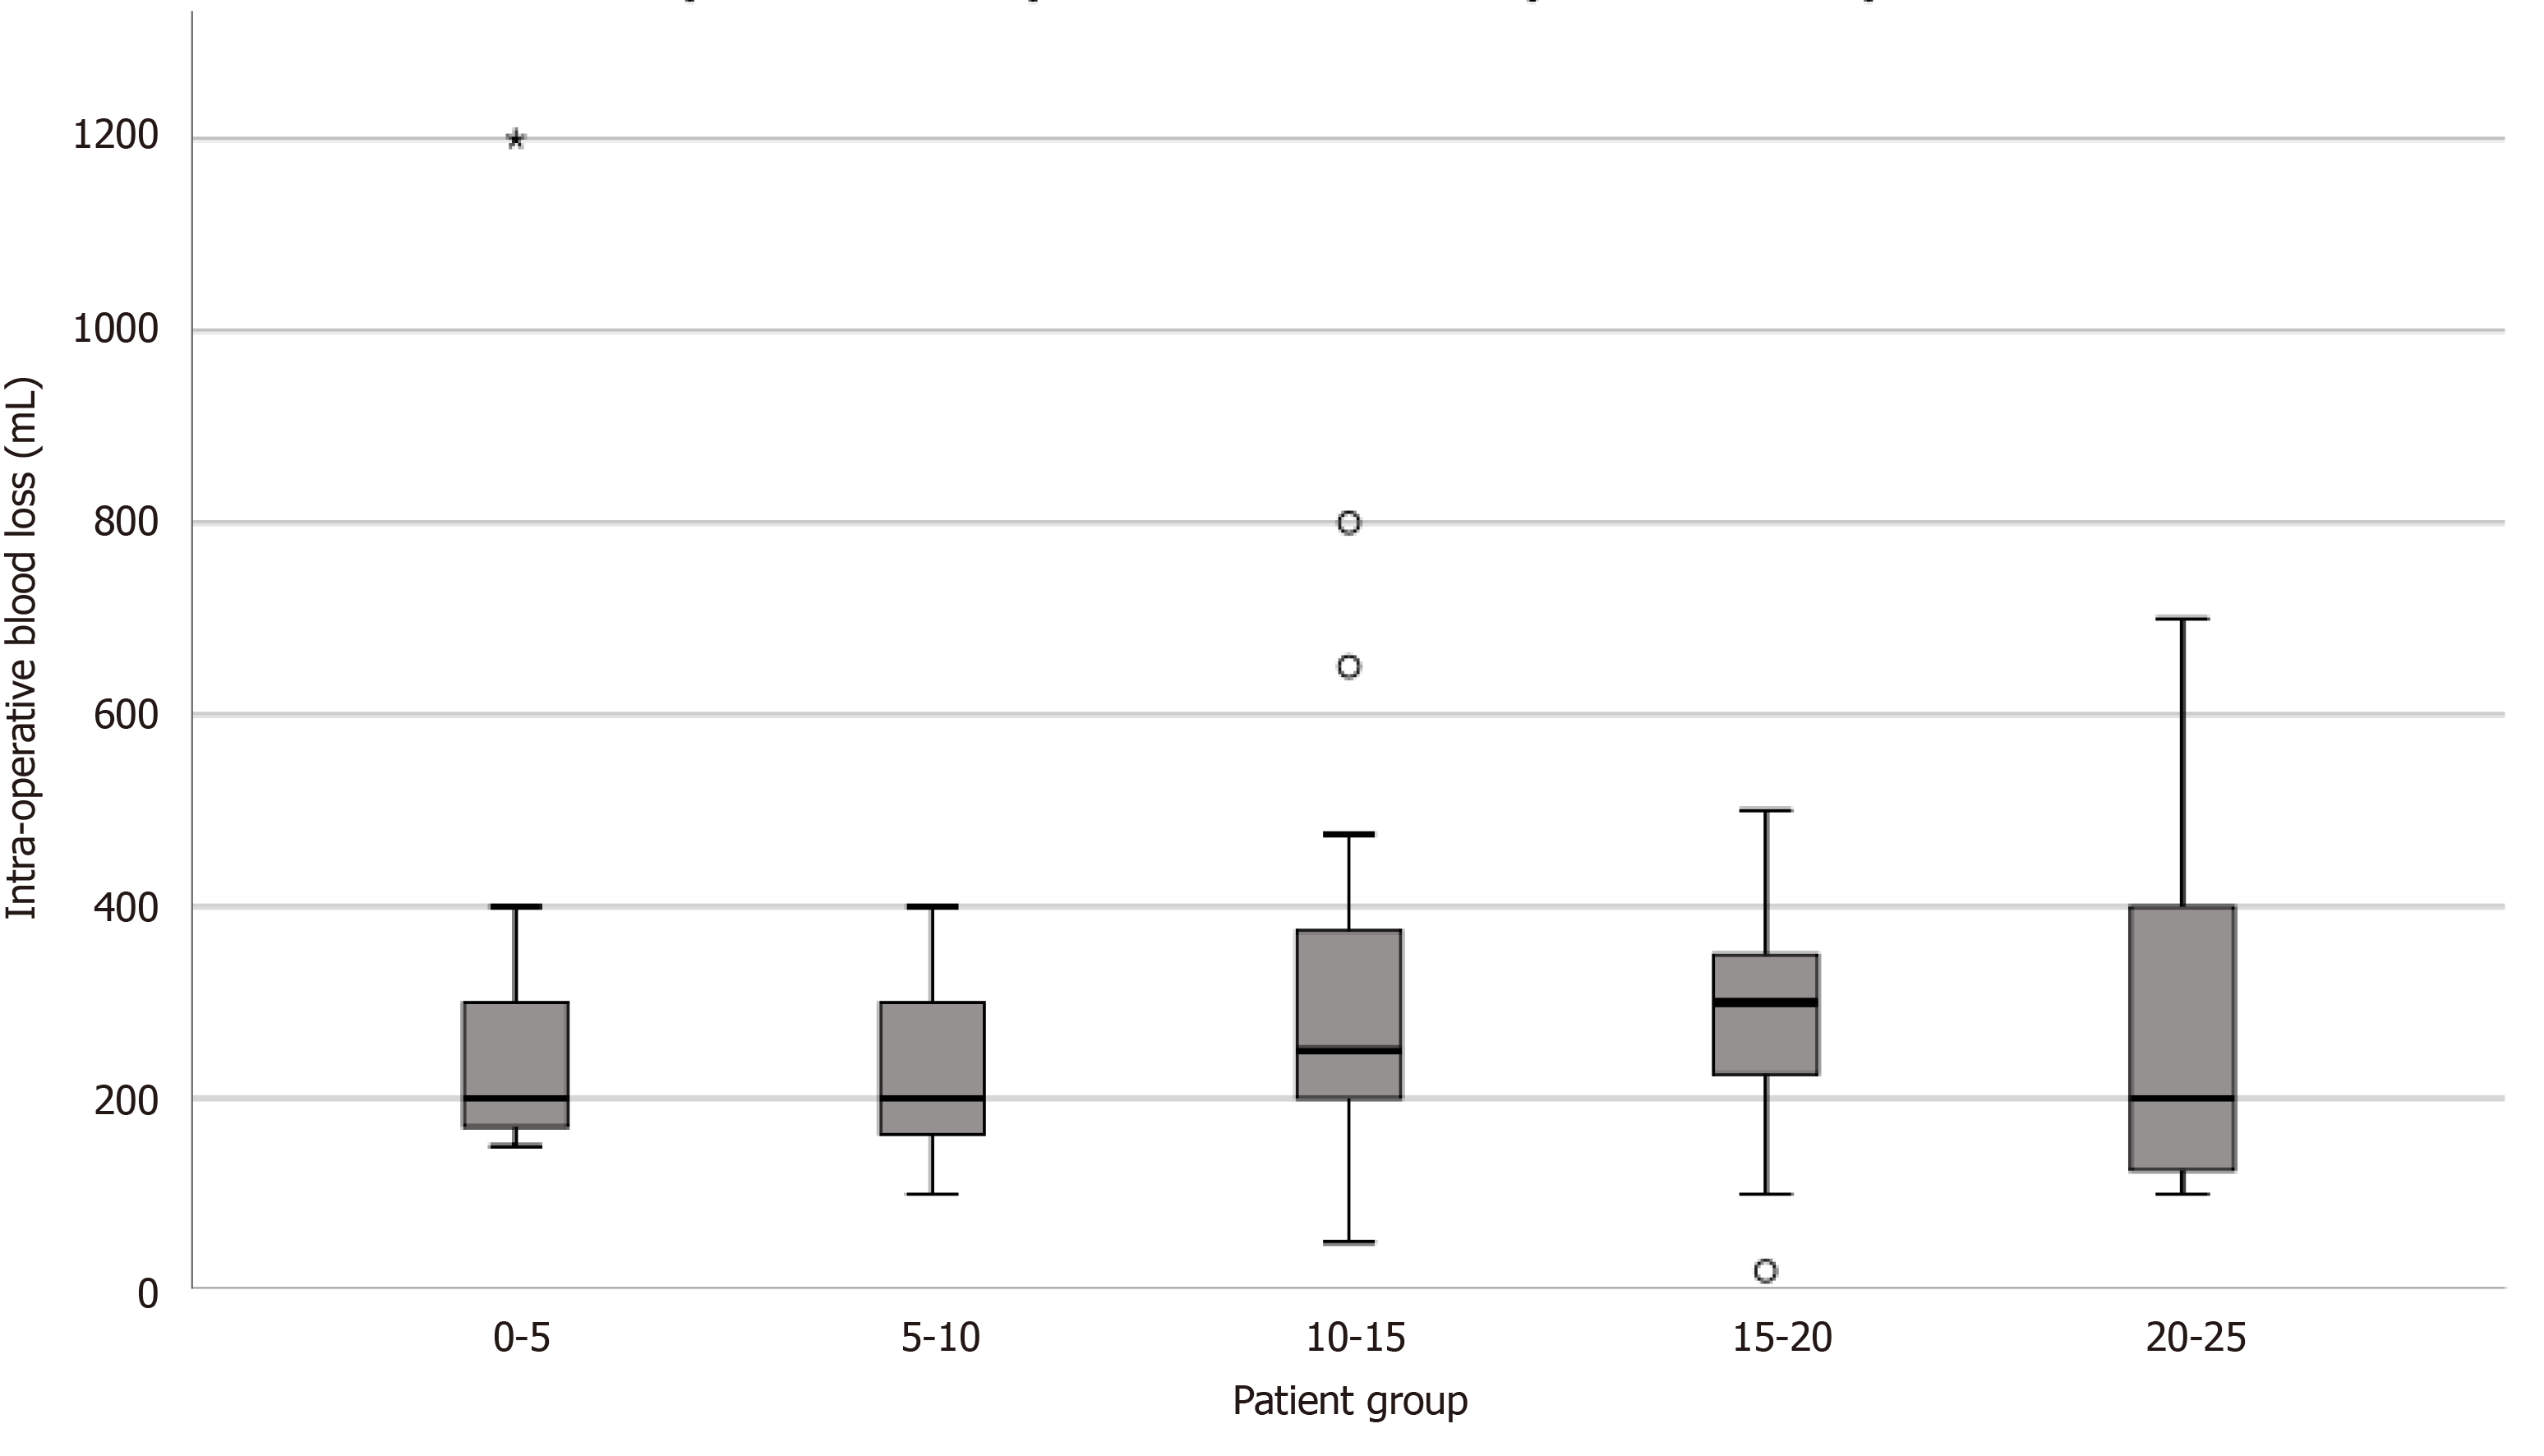
Figure 3 Initial learning curve effect on intra-operative blood loss management in the first 25 novel total knee arthroplasties.
The box represents the interquartile (IQ) range. Median indicated by line across the box. The whiskers are no greater than 1.5 times the IQ range; Outliers are cases with values between 1.5 and 3 times the IQ range depicted by circles; Extreme outliers are cases with values more than 3 times the IQ range depicted by asterisks.
- Citation: Omari A, Troelsen A, Husted H, Nielsen CS, Gromov K. Early clinical outcome and learning curve following unilateral primary total knee arthroplasty after introduction of a novel total knee arthroplasty system. World J Orthop 2020; 11(10): 431-441
- URL: https://www.wjgnet.com/2218-5836/full/v11/i10/431.htm
- DOI: https://dx.doi.org/10.5312/wjo.v11.i10.431


