Copyright
©The Author(s) 2020.
World J Orthop. Jan 18, 2020; 11(1): 18-26
Published online Jan 18, 2020. doi: 10.5312/wjo.v11.i1.18
Published online Jan 18, 2020. doi: 10.5312/wjo.v11.i1.18
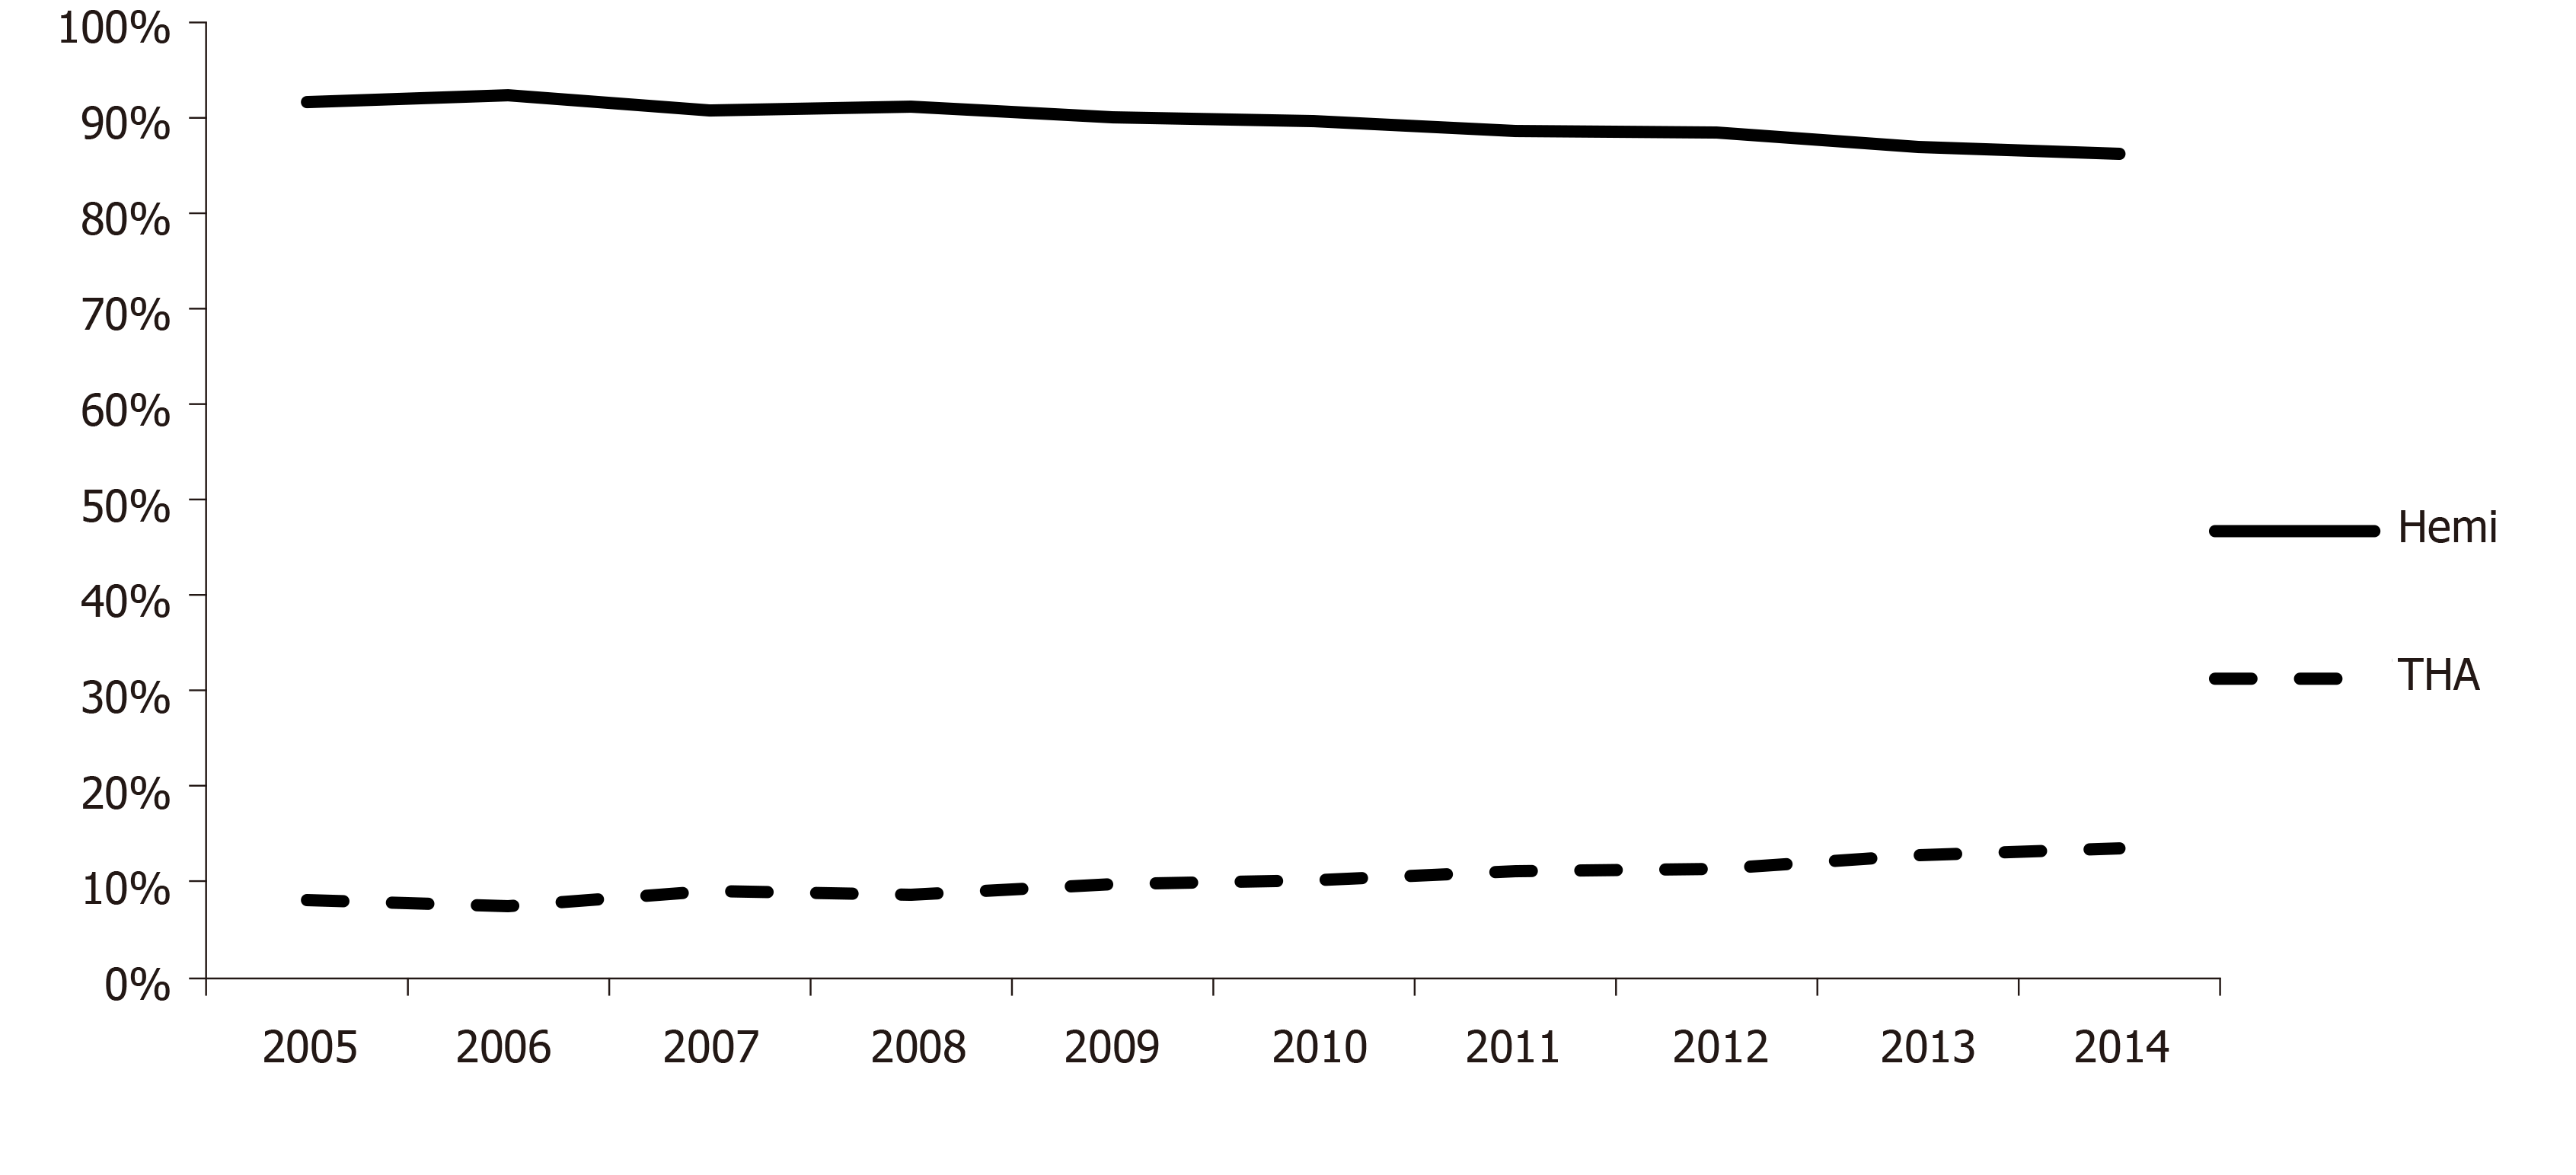
Figure 1 Percentage of hemiarthroplasty and total hip arthroplasty performed for femoral neck fractures between 2005 and 2014.
Hemi: Hemiarthroplasty; THA: Total hip arthroplasty.
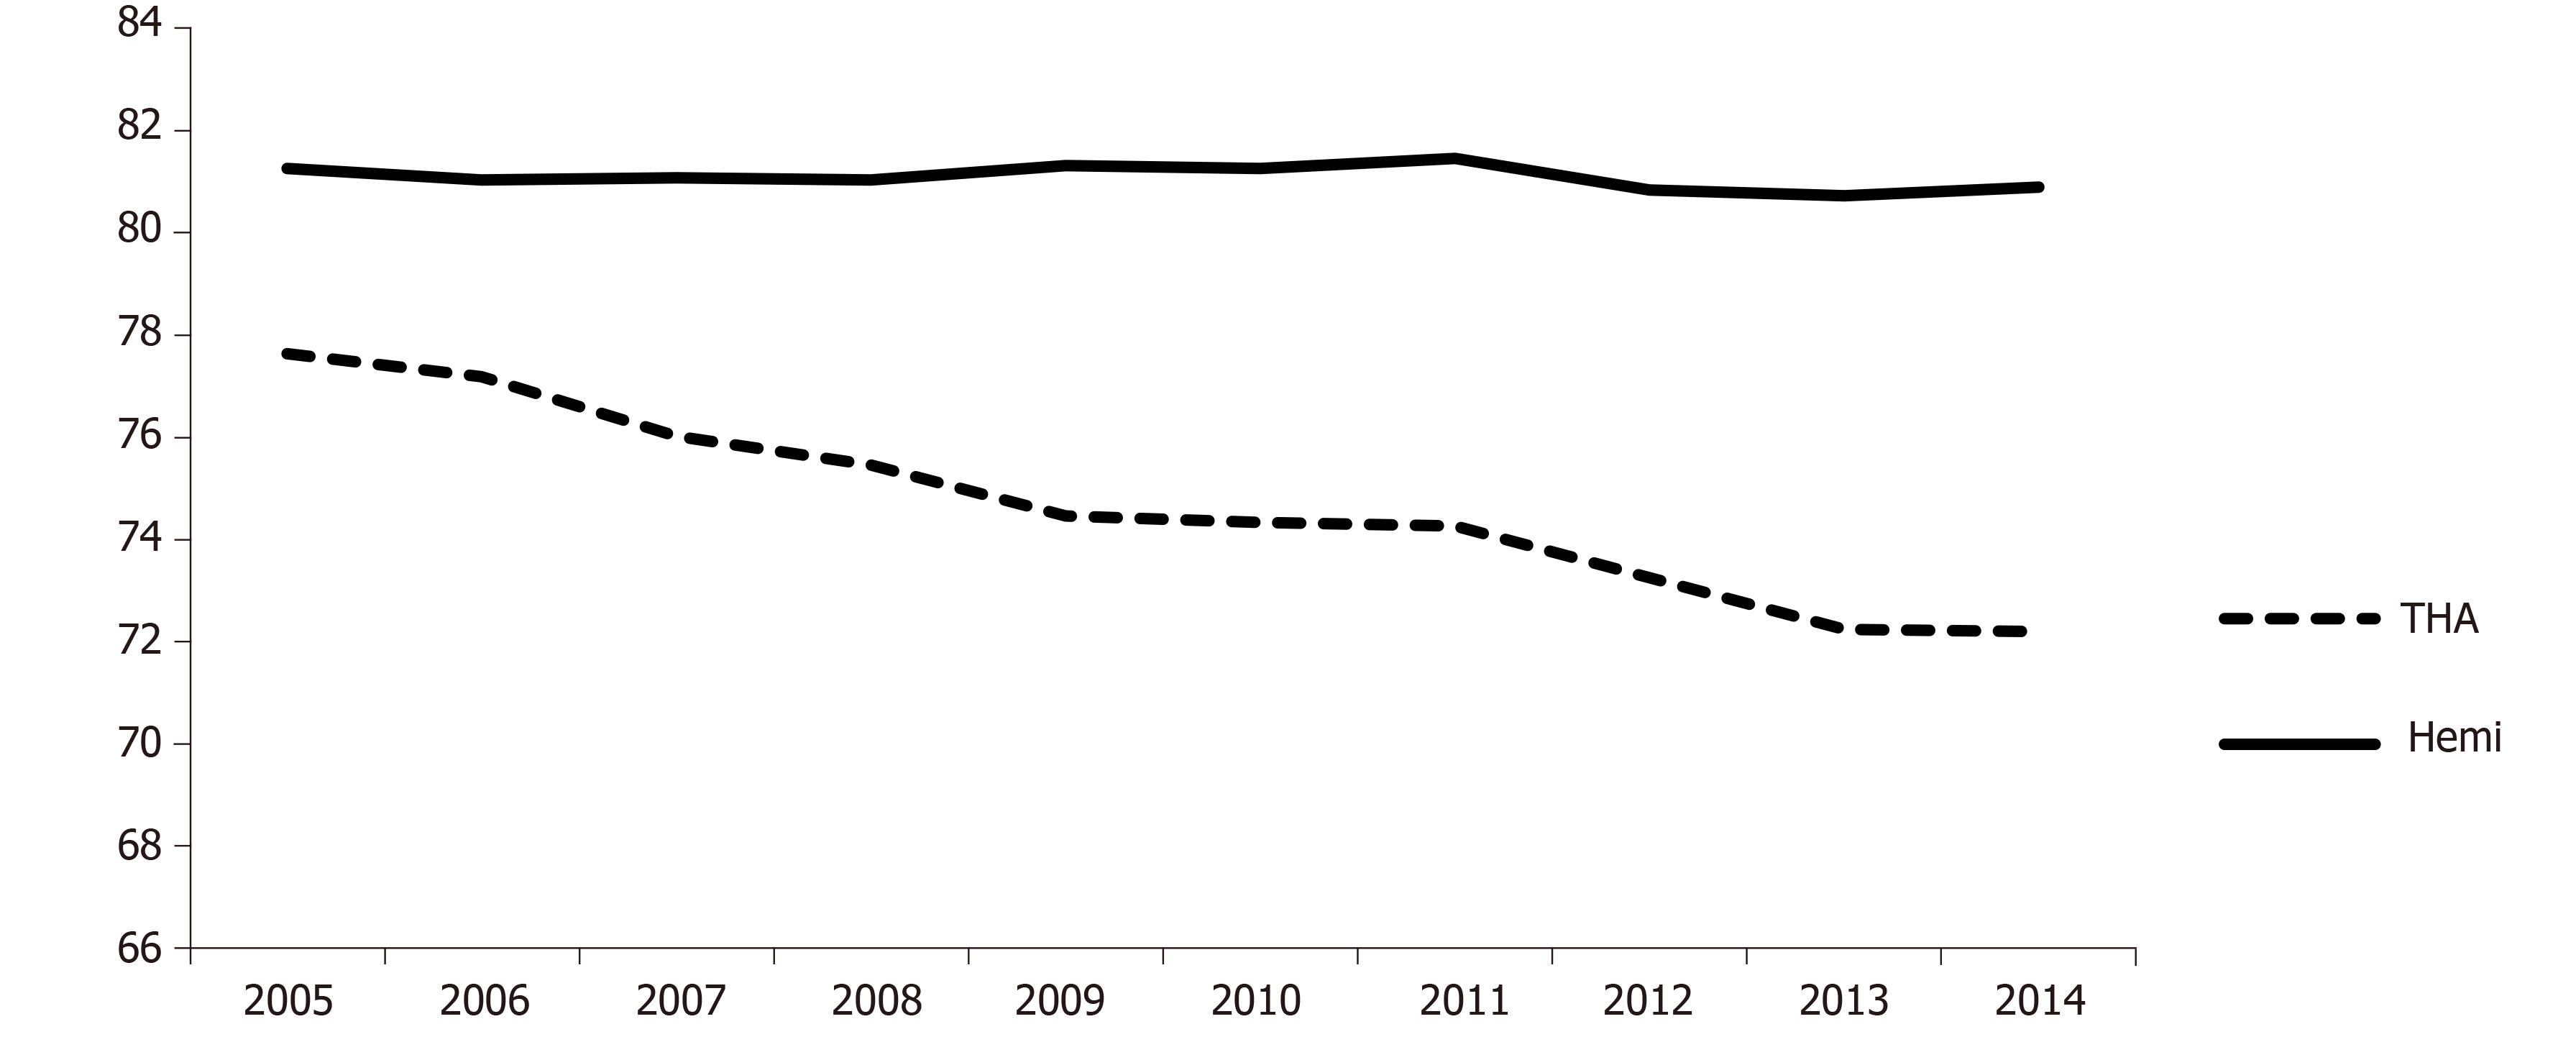
Figure 2 Age in years of hemiarthroplasty and total hip arthroplasty patients between 2005 and 2014.
Hemiarthroplasty patients were on average older (81.1 years vs 74.5 years, P < 0.001). Hemi: Hemiarthroplasty; THA: Total hip arthroplasty.
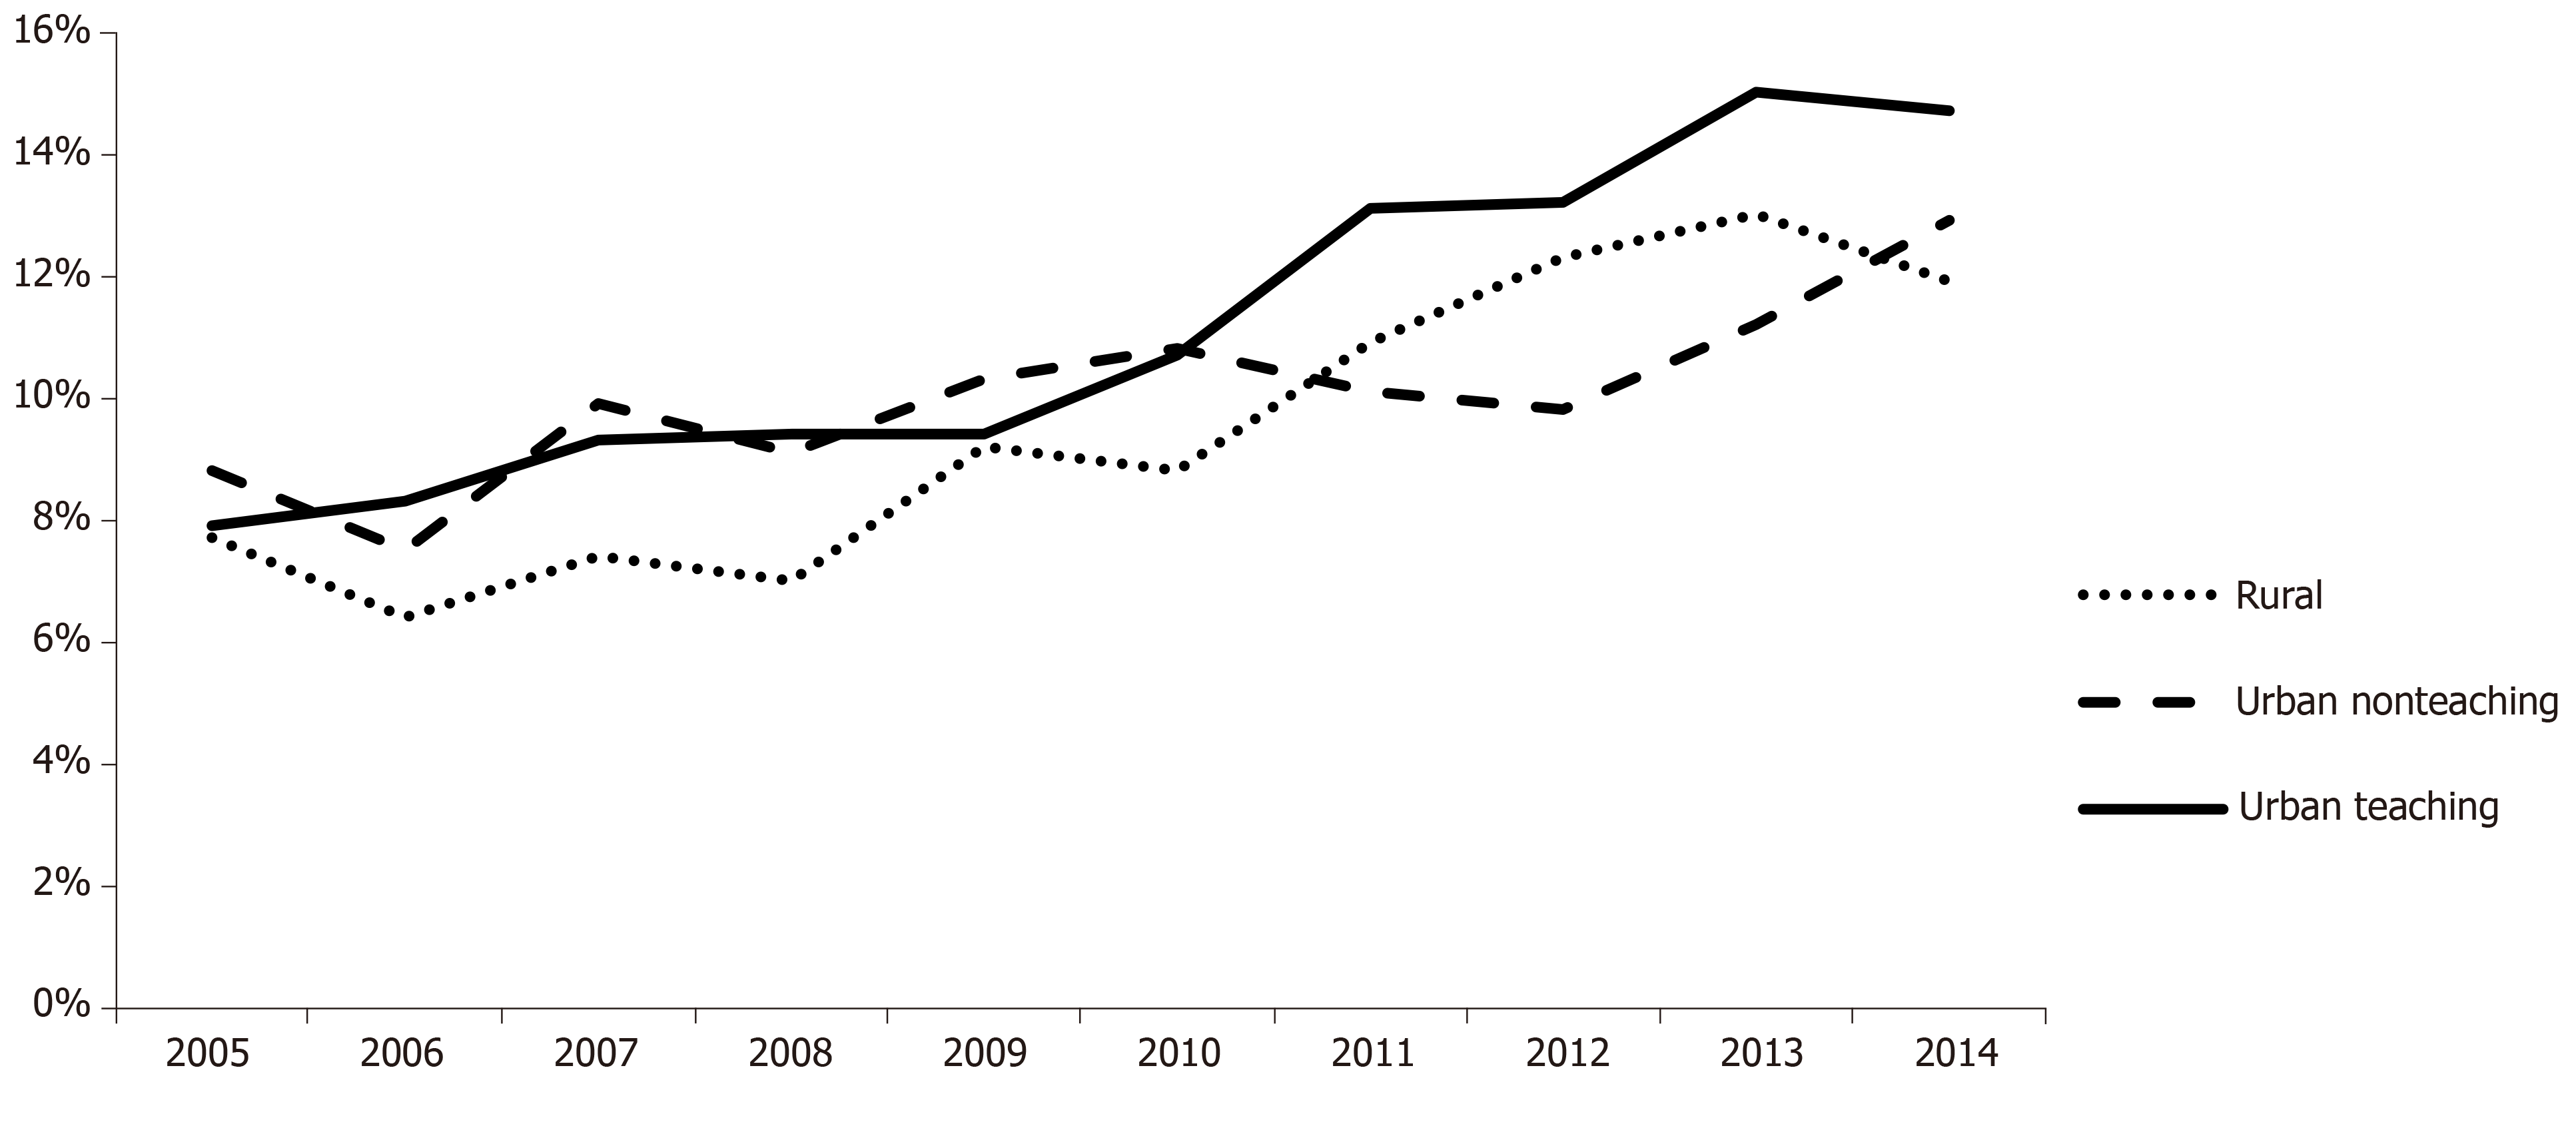
Figure 3 Percentage of total hip arthroplasty procedures performed for femoral neck fractures by hospital type (urban teaching hospitals, urban non-teaching, rural) between 2005 and 2014.
Total hip arthroplasty has increased most in urban teaching hospitals (7.9% to 14.7%).
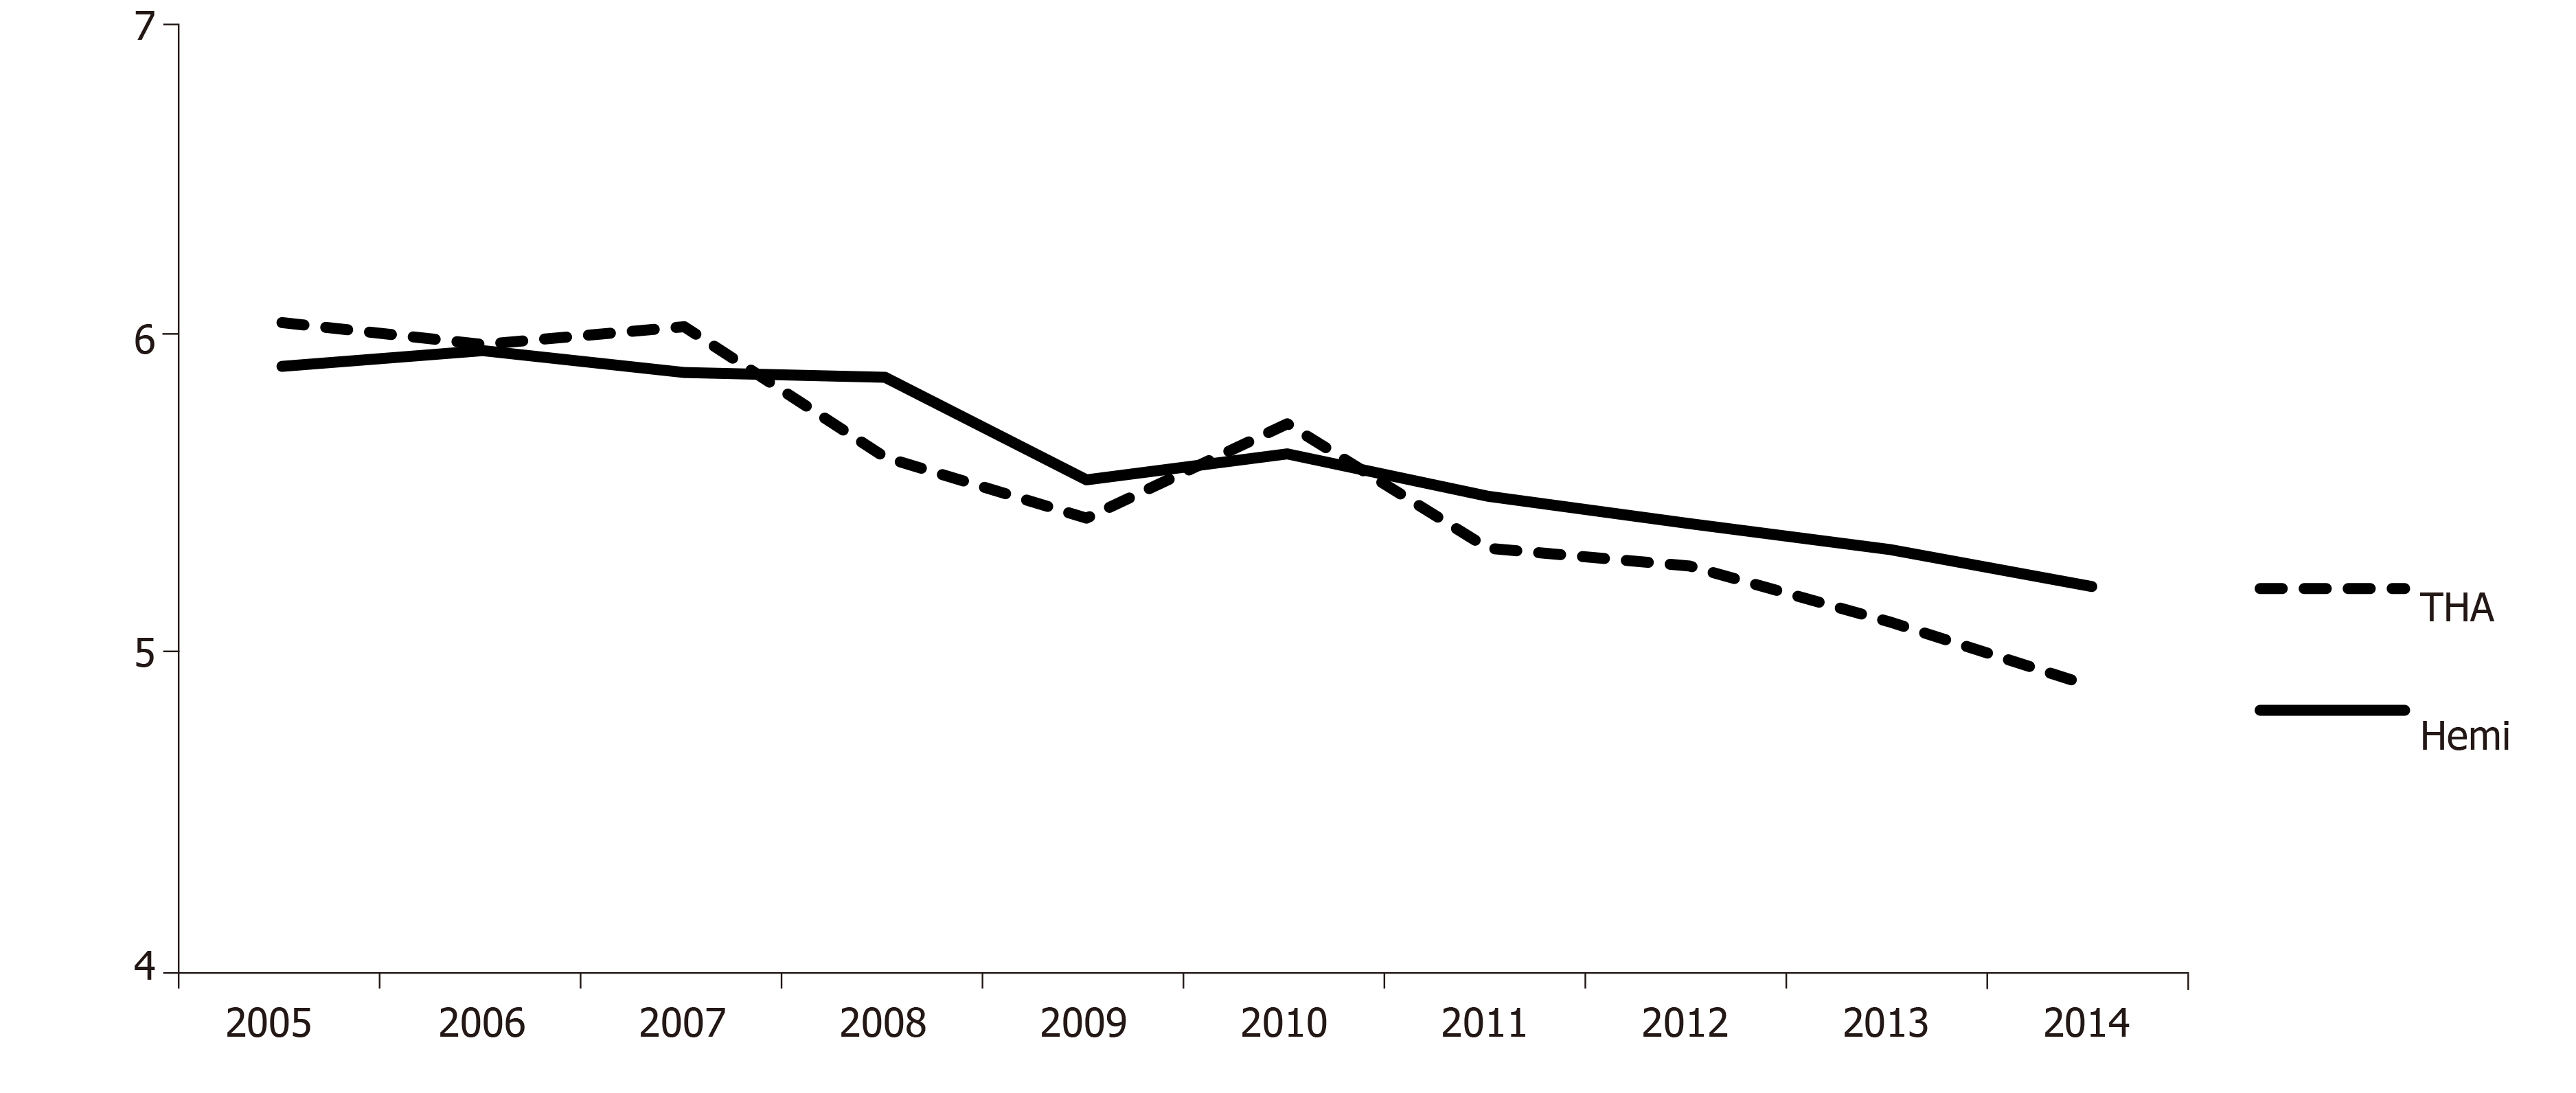
Figure 4 Length of stay in days of hemiarthroplasty and total hip arthroplasty patients between 2005 and 2014.
While the mean length of stay decreased over time for both groups, the rate of decline was significantly greater for the Total hip arthroplasty cases. Hemi: Hemiarthroplasty; THA: Total hip arthroplasty.
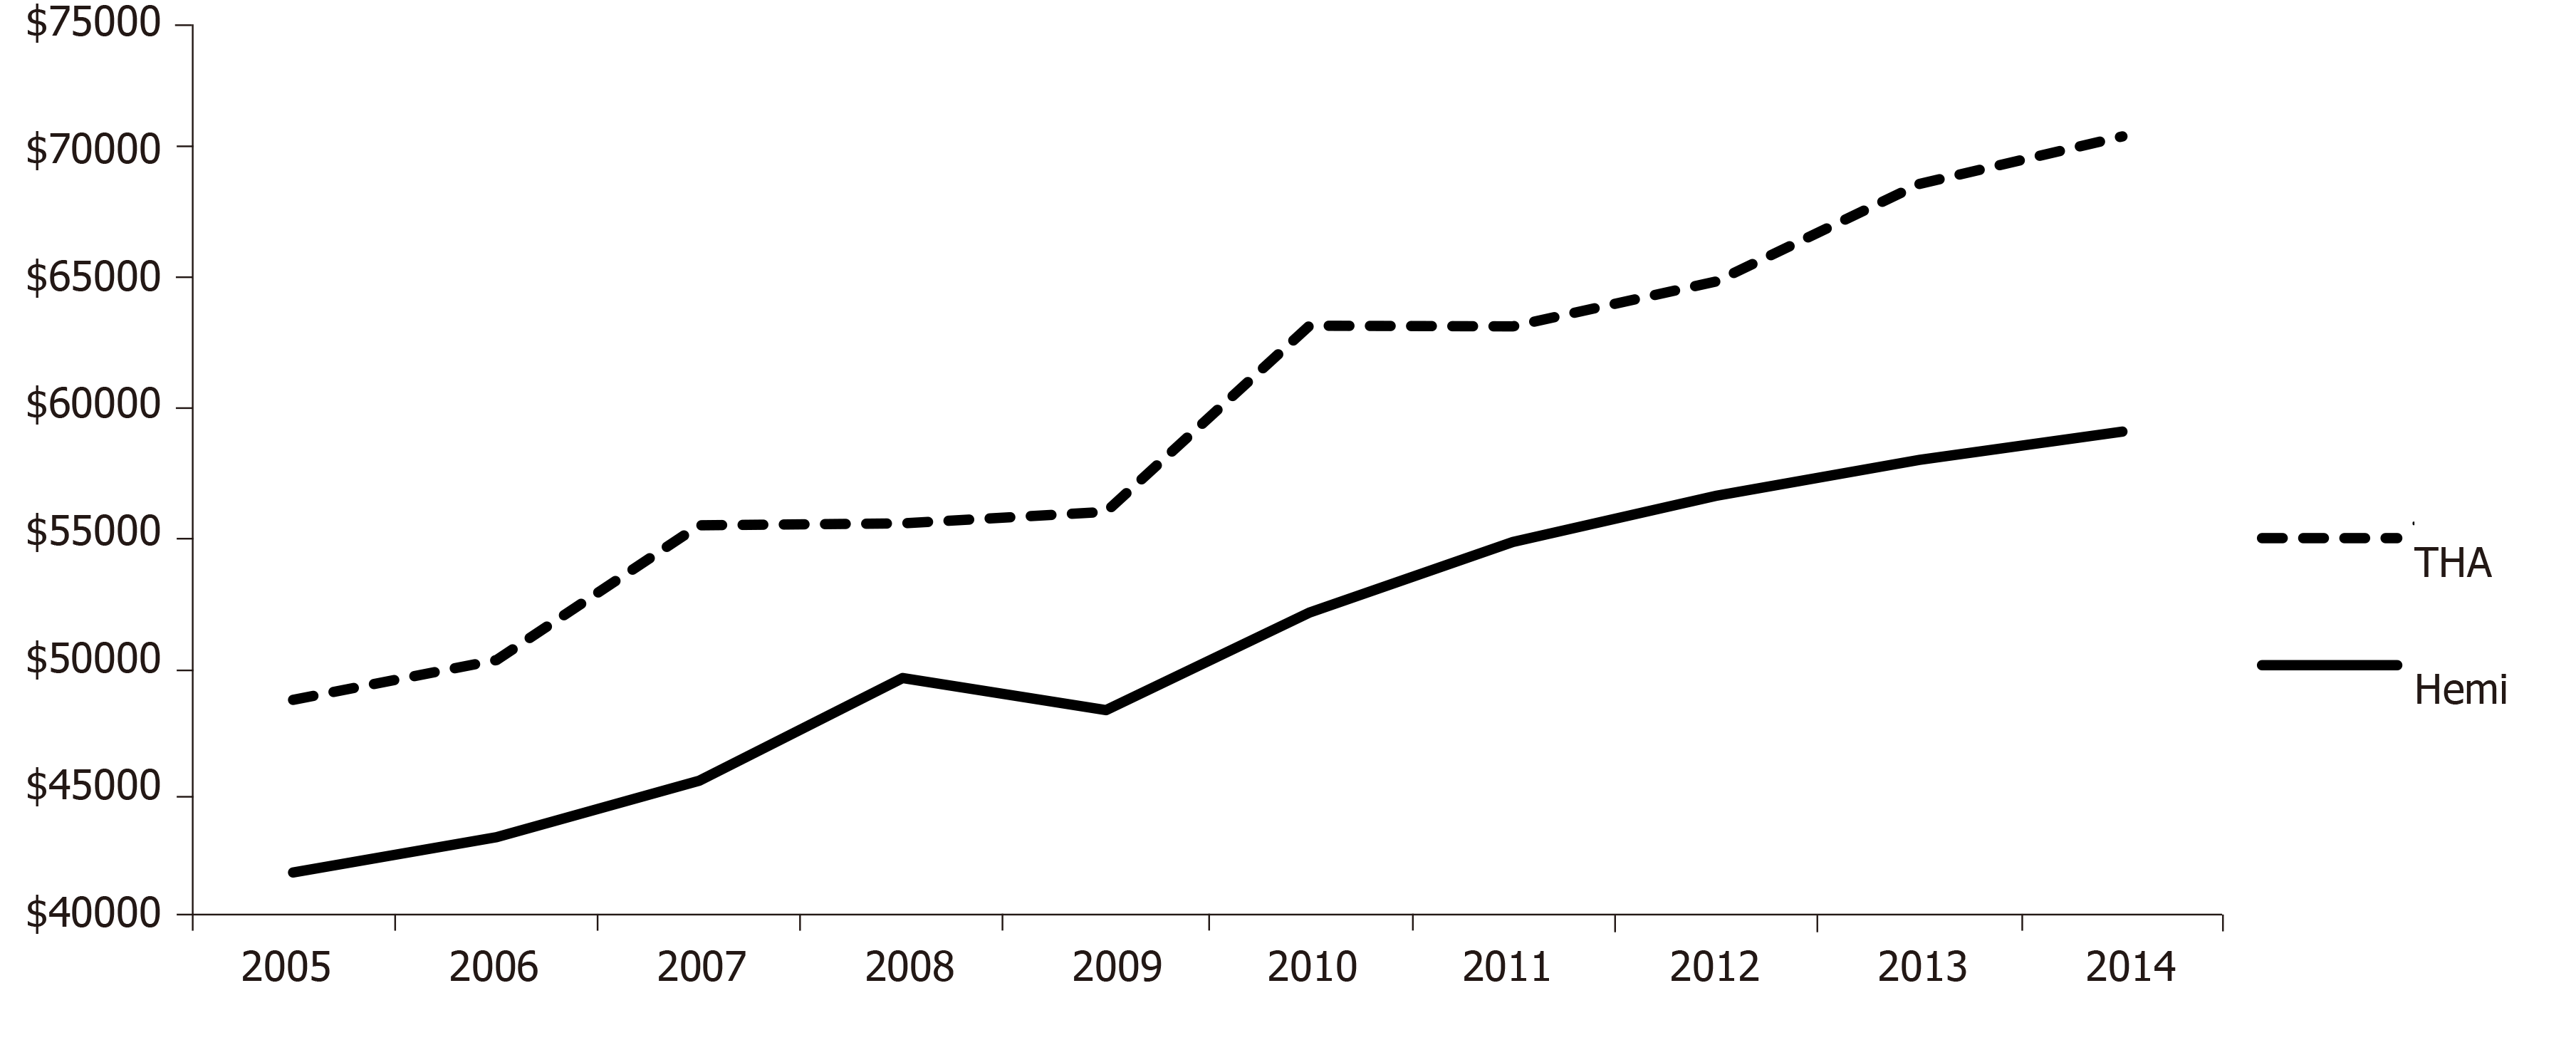
Figure 5 Mean charges (adjusted to 2014 United States dollars) for hemiarthroplasty and total hip arthroplasty patients between 2005 and 2014.
The mean charges were less for HA ($49866 vs $59826, P < 0.0001), however they increased steadily for both groups. Hemi: Hemiarthroplasty; THA: Total hip arthroplasty.
- Citation: Boniello AJ, Lieber AM, Denehy K, Cavanaugh P, Kerbel YE, Star A. National trends in total hip arthroplasty for traumatic hip fractures: An analysis of a nationwide all-payer database. World J Orthop 2020; 11(1): 18-26
- URL: https://www.wjgnet.com/2218-5836/full/v11/i1/18.htm
- DOI: https://dx.doi.org/10.5312/wjo.v11.i1.18


