Copyright
©The Author(s) 2019.
World J Orthop. Nov 18, 2019; 10(11): 378-386
Published online Nov 18, 2019. doi: 10.5312/wjo.v10.i11.378
Published online Nov 18, 2019. doi: 10.5312/wjo.v10.i11.378
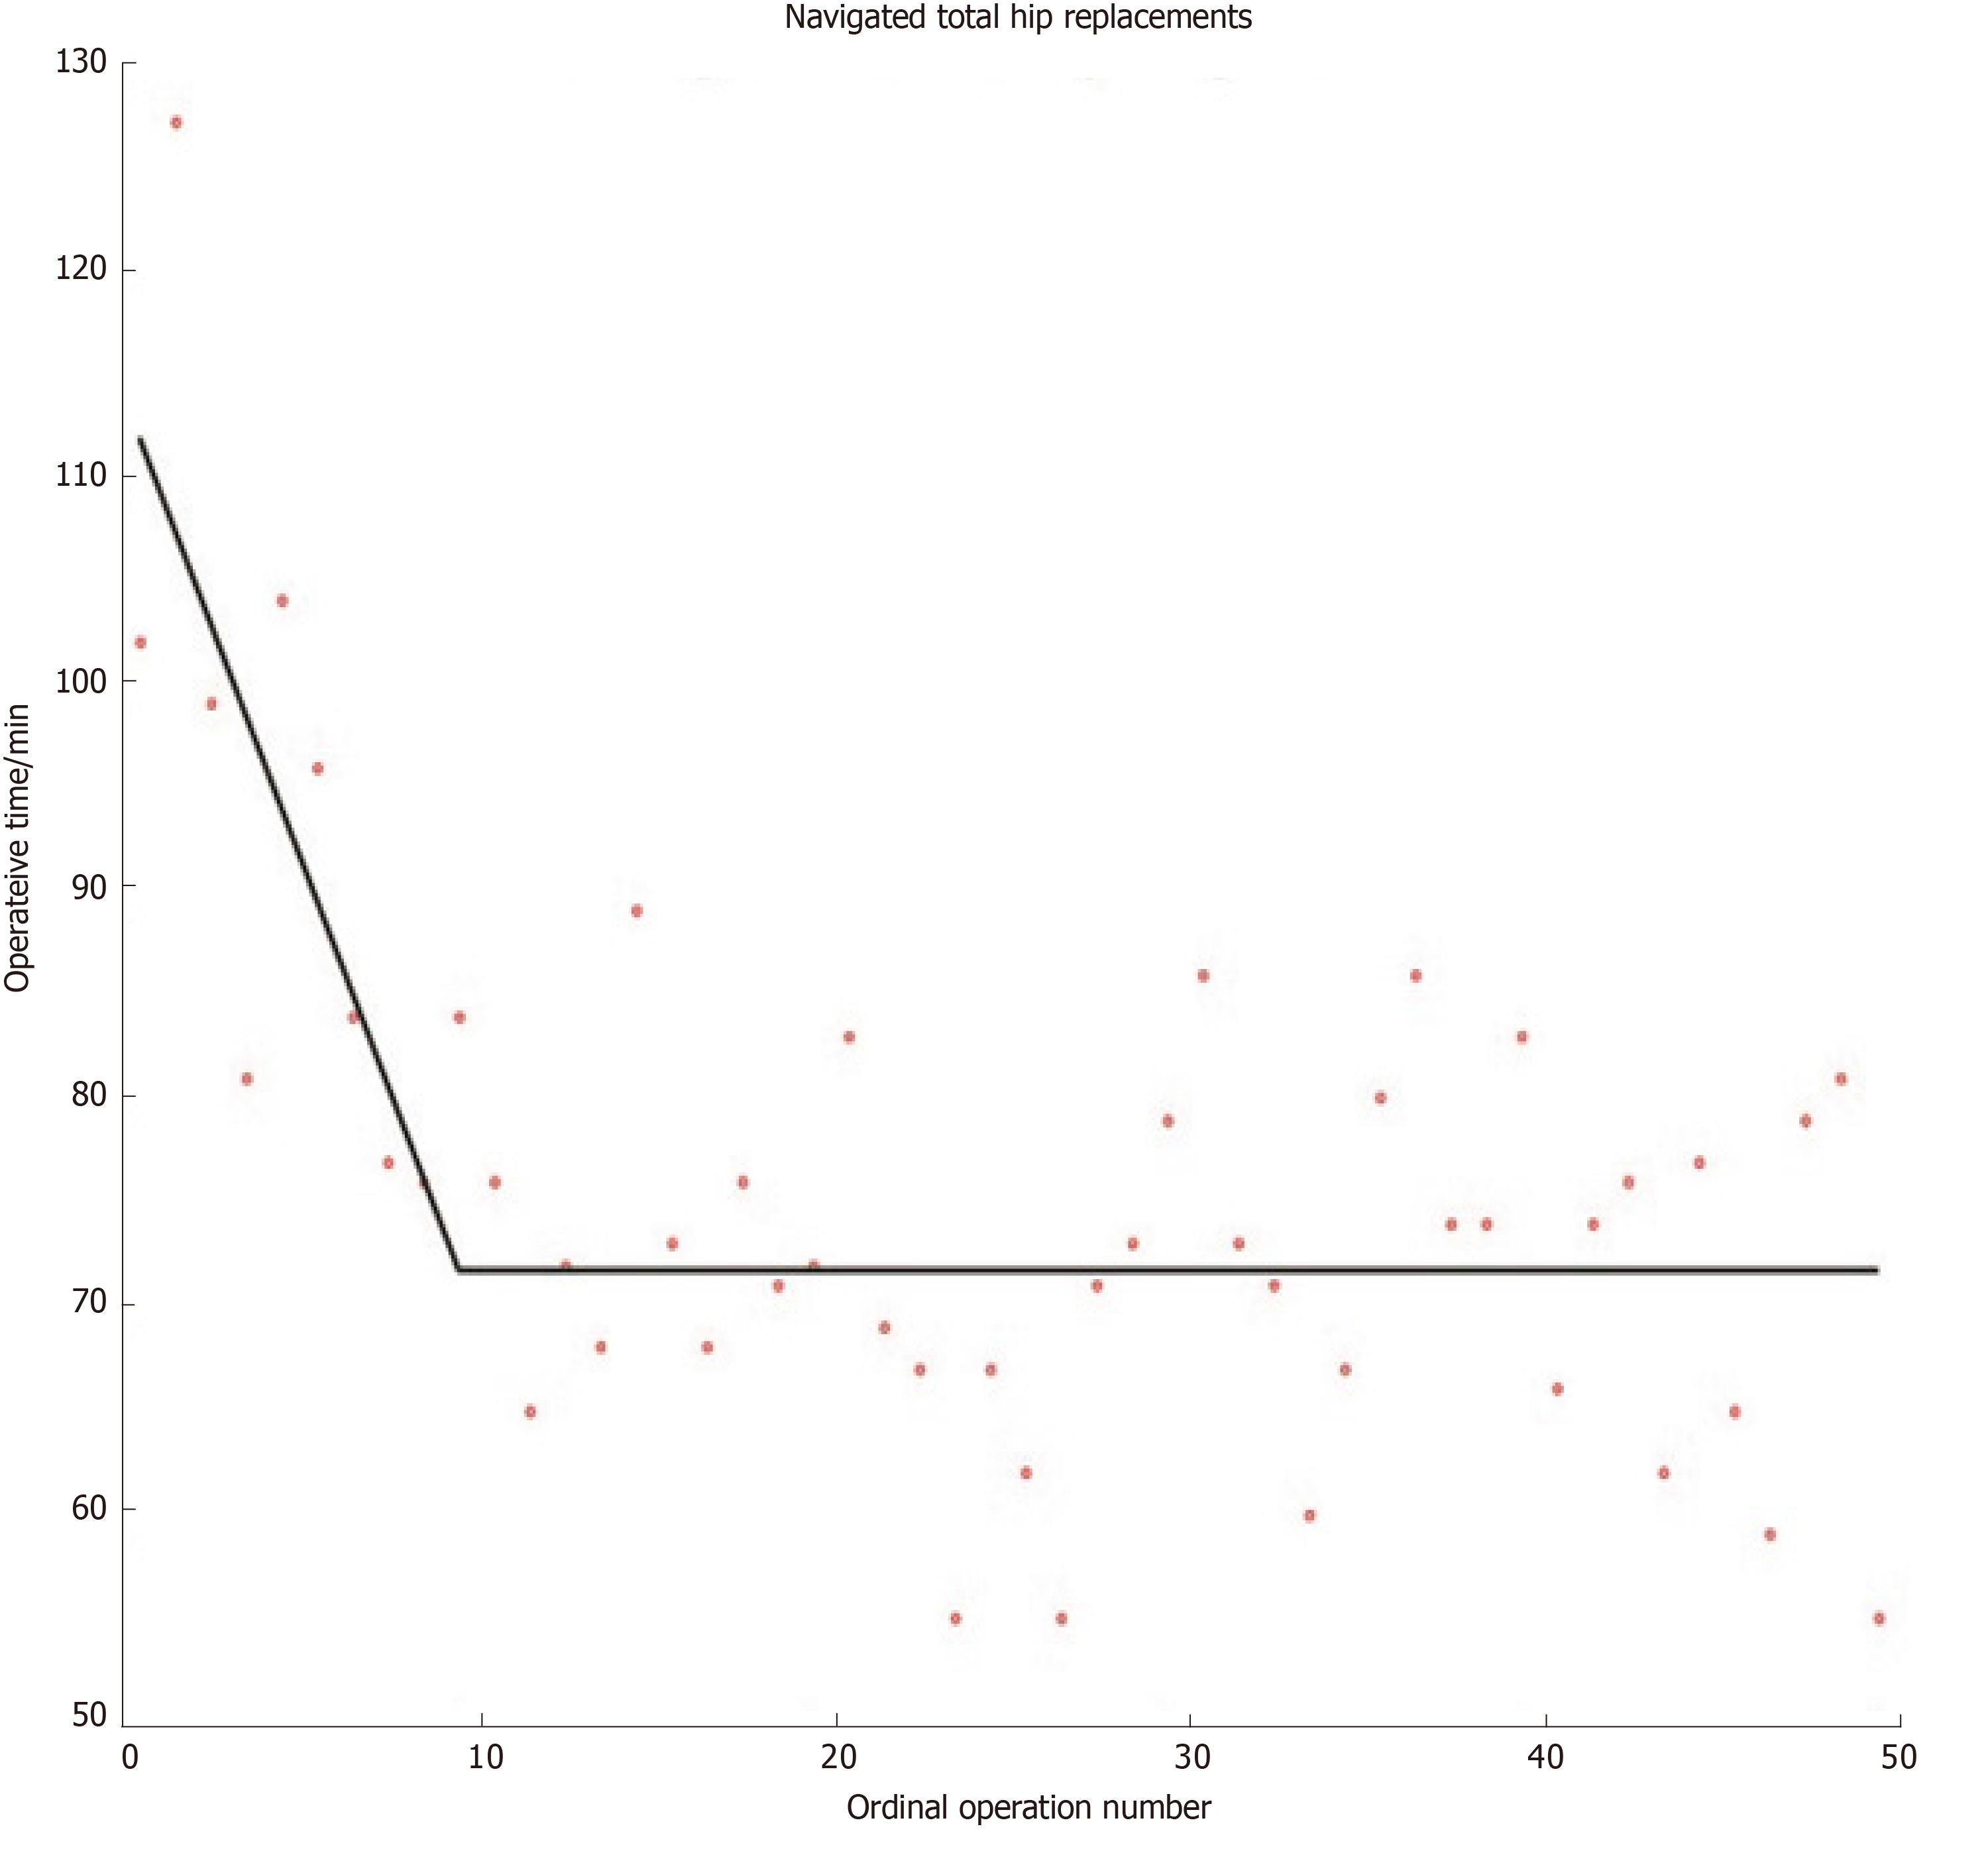
Figure 1 Learning curve for navigated total hip replacements.
Segmented linear regression technique was employed to model learning[17]. Line-plateau model fits the data best, with a plateau being attained at 12 operations.
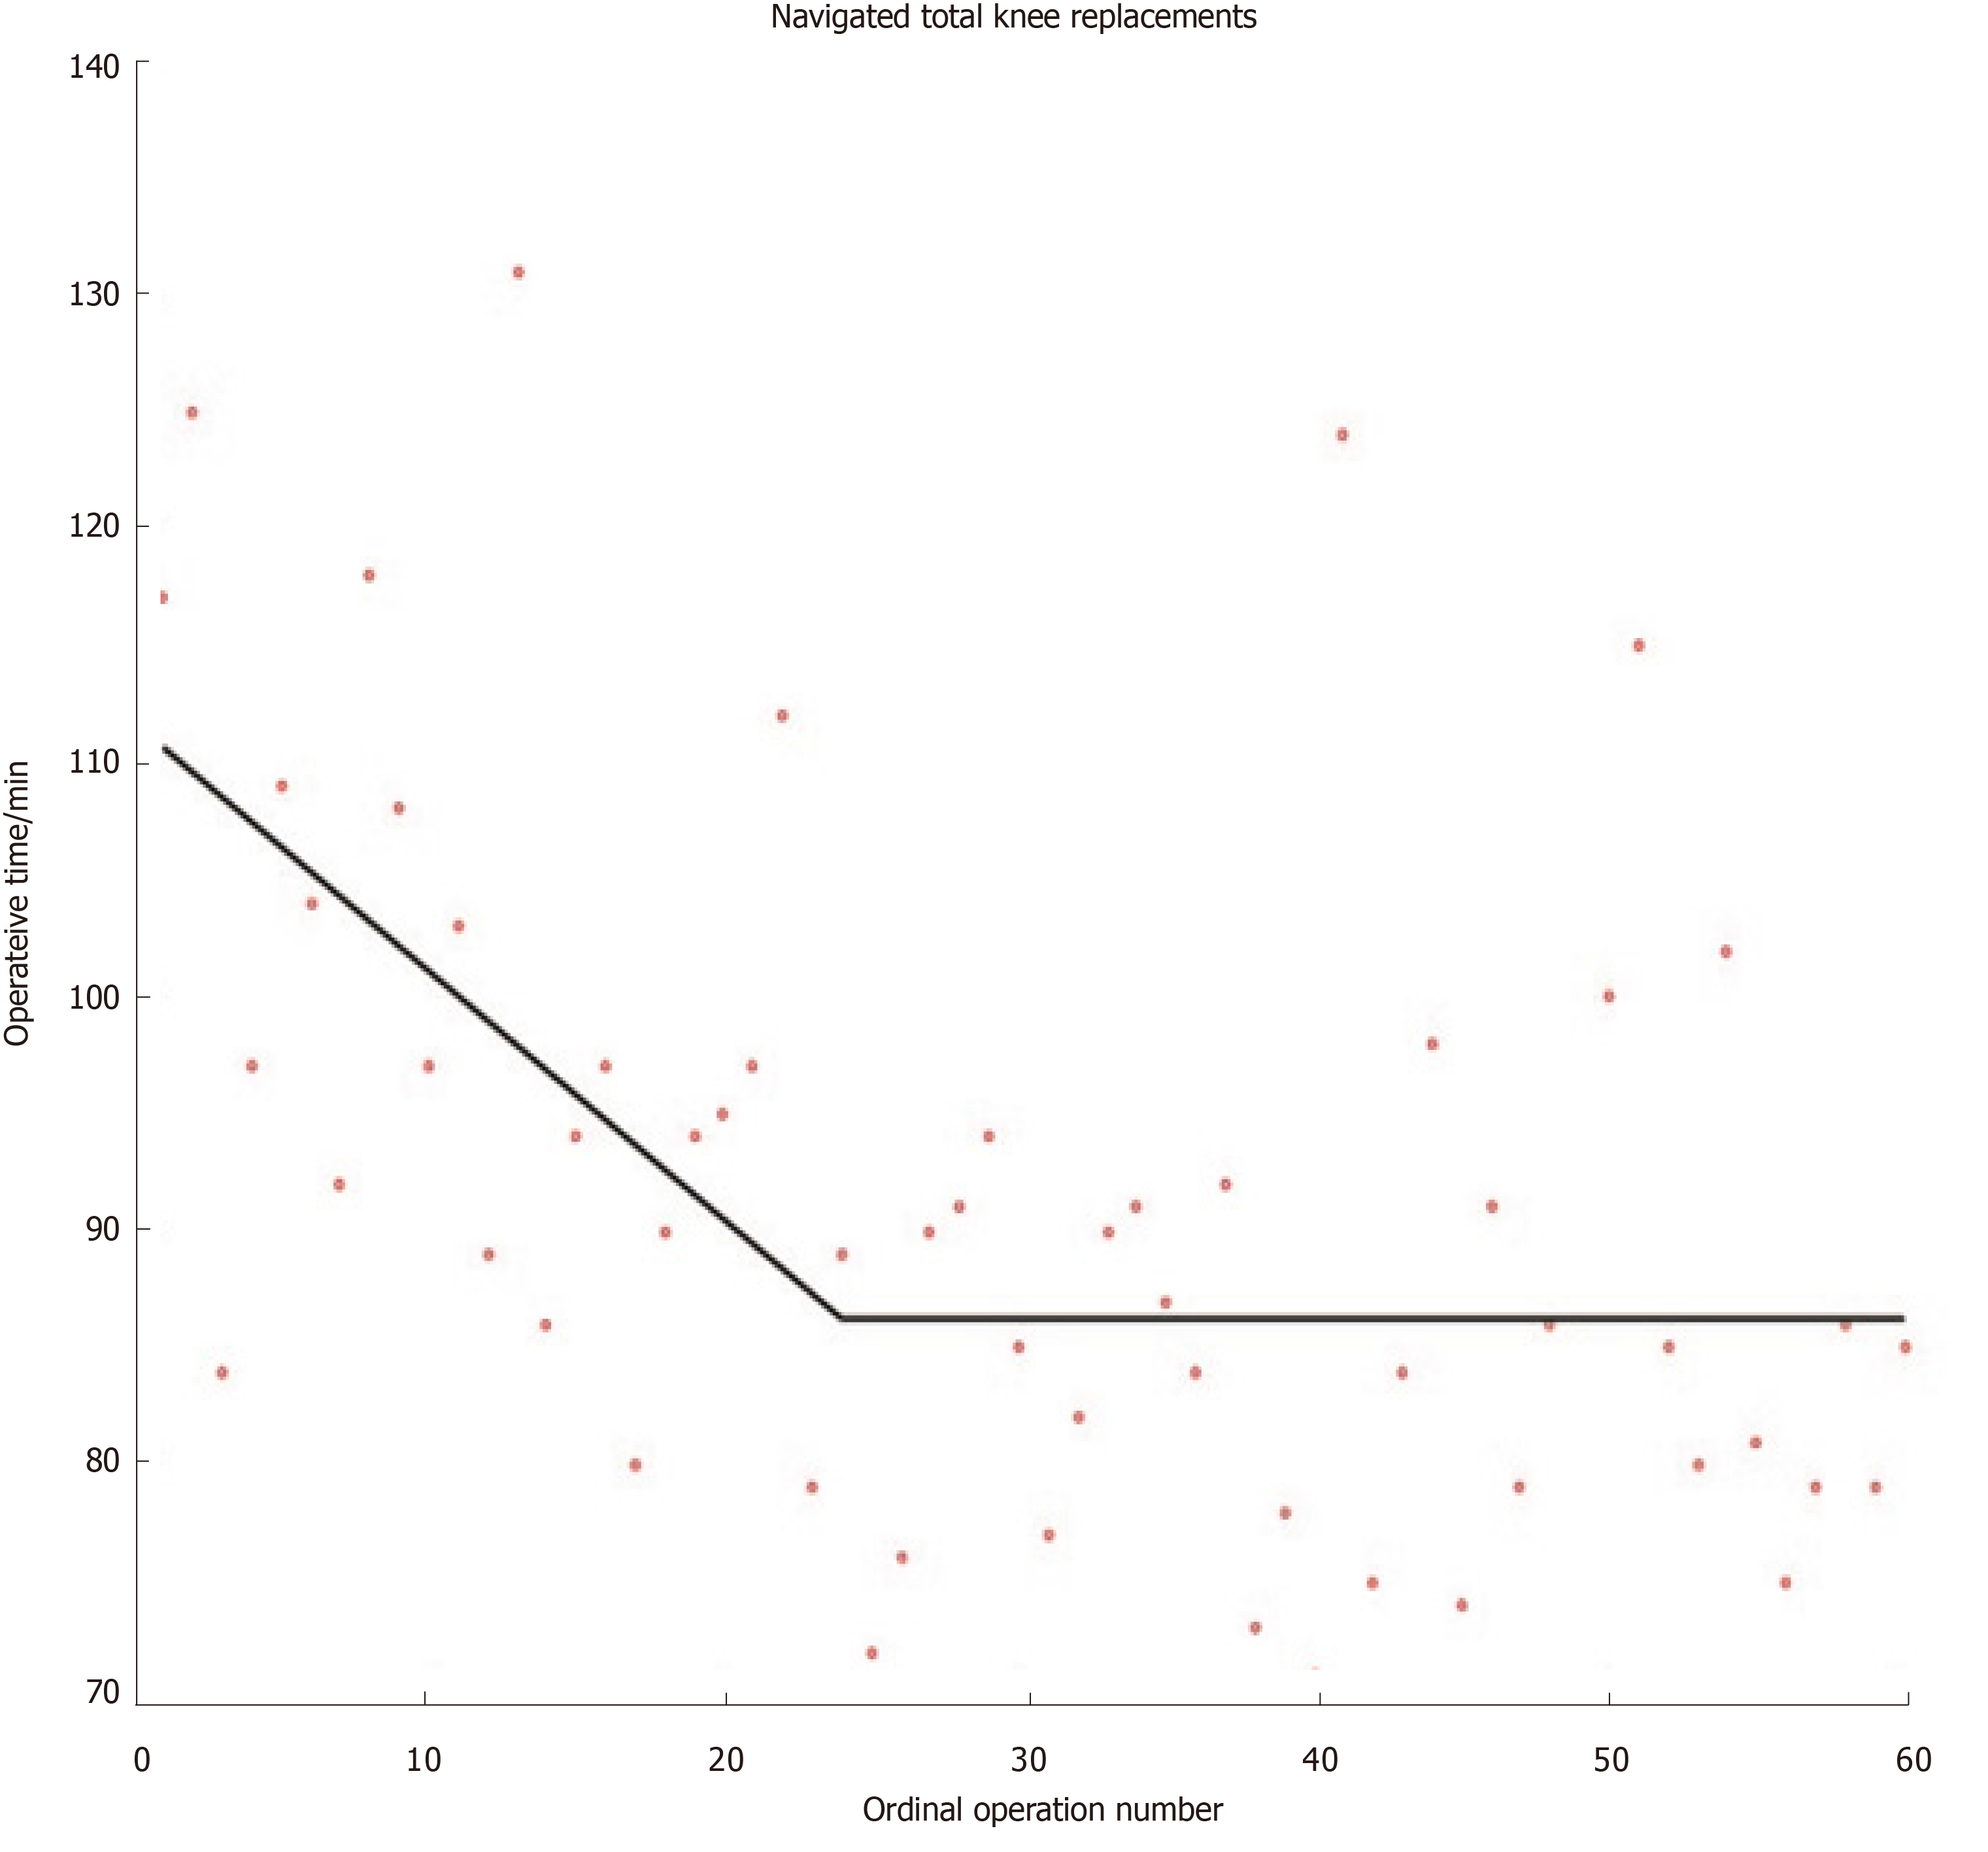
Figure 2 Learning curve for navigated total knee replacements.
Segmented linear regression technique was employed to model learning[17]. Line-plateau model fits the data best, with plateau being attained at 26 operations.
Figure 3 Time to surgery for neck of femur fractures.
The vertical dashed line marks the onset of a dedicated hip fracture unit. The line-plateau is the best-fitting linear model for the entire period: the line has equation y = −0.0414t + 40.1868; plateau at y = 24.7033 reached after 375 d. The initial drop may be related to the introduction of the Best Practice Tariff. The hip fracture unit did not significantly affect time to surgery[53].
- Citation: Valsamis EM, Sukeik M. Evaluating learning and change in orthopaedics: What is the evidence-base? World J Orthop 2019; 10(11): 378-386
- URL: https://www.wjgnet.com/2218-5836/full/v10/i11/378.htm
- DOI: https://dx.doi.org/10.5312/wjo.v10.i11.378


