Published online Dec 10, 2014. doi: 10.5306/wjco.v5.i5.1055
Revised: May 30, 2014
Accepted: June 14, 2014
Published online: December 10, 2014
Processing time: 400 Days and 20.9 Hours
AIM: To achieve symmetric boundaries for left and right breasts boundaries in thermal images by registration.
METHODS: The proposed method for registration consists of two steps. In the first step, shape context, an approach as presented by Belongie and Malik was applied for registration of two breast boundaries. The shape context is an approach to measure shape similarity. Two sets of finite sample points from shape contours of two breasts are then presented. Consequently, the correspondences between the two shapes are found. By finding correspondences, the sample point which has the most similar shape context is obtained.
RESULTS: In this study, a line up transformation which maps one shape onto the other has been estimated in order to complete shape. The used of a thin plate spline permitted good estimation of a plane transformation which has capability to map unselective points from one shape onto the other. The obtained aligning transformation of boundaries points has been applied successfully to map the two breasts interior points. Some of advantages for using shape context method in this work are as follows: (1) no special land marks or key points are needed; (2) it is tolerant to all common shape deformation; and (3) although it is uncomplicated and straightforward to use, it gives remarkably powerful descriptor for point sets significantly upgrading point set registration. Results are very promising. The proposed algorithm was implemented for 32 cases. Boundary registration is done perfectly for 28 cases.
CONCLUSION: We used shape contexts method that is simple and easy to implement to achieve symmetric boundaries for left and right breasts boundaries in thermal images.
Core tip: Breast thermography has shown to be as a non-invasive safe method to detect breast abnormalities. Comparison between two breast temperature distributions is helpful to identify irregularities. Since in many cases real thermal breast images do not have symmetric boundaries, a registration is needed. A registration shape context approach is applied in this work.
- Citation: Etehadtavakol M, Ng EYK, Gheissari N. Using shape contexts method for registration of contra lateral breasts in thermal images. World J Clin Oncol 2014; 5(5): 1055-1059
- URL: https://www.wjgnet.com/2218-4333/full/v5/i5/1055.htm
- DOI: https://dx.doi.org/10.5306/wjco.v5.i5.1055
Breast abnormalities are major concerns in health issues for women today. Identification of potentially malignant cells has a great significance for physician. Breast thermal imaging for early detection has an arguable history. With developing high sensitive infrared cameras besides great knowledge of advanced image processing and advanced computer algorithms have renewed attention to breast infrared imaging. The level of blood perfusion can affect the surface temperature that results infrared radiation emitted from skin breasts[1]. By utilizing a sensitive infrared camera, the skin temperature changes can be captured. Since cancerous cells are hotter than normal cells, they are appeared as hot spots in thermal images[2]. Usually healthy subjects are symmetric[3]. Consequently, asymmetrical temperature patterns between two contra lateral breasts could be a sign of abnormality[4-12]. In practice, most of the real IR breast images do not have symmetric boundaries. Hence, in order to compare the thermal distribution of two contra lateral breasts, a registration for two breasts is needed. In this work, first the shape context method is applied for registration of two contra lateral breasts boundaries. Then the obtained transformation function of boundaries points is utilized to transfer breasts interior points. The paper is organized as follows: The shape context method and the thin plate spline (TPS) are introduced in section 1. Section 2 explains dataset and describes the proposed algorithm steps. The experimental results are presented in section 3. Section 4 concludes the findings.
The shape context is an algorithm was proposed by Vardasca et al in 2002[13]. It is an approach to describe shapes in measuring shape alikeness and improving of point similarities. In this way, there are two objects, known and unknown. Assuming the shape of the known object is captured by points set p = {p1,| pn} and the unknown object by q = {q1,| qn}. The expansion of relative places is vigorous, dense, and thoroughly differential descriptor. Hence, the coarse histogram of relative coordinates of n - 1 points are being left, for point pi, is described as the shape context of pi which is expressed in Eq. (1)
hi(k) = #{q ≠ pi : (q - pi)∈bin(k)} (1)
First, the correspondences between two shapes are found. A set of finite representative points from shape boundaries illustrates shapes. They are not required to be special points such as curvature extrema or landmarks, etc. The more samples are used, the better approximations to the underlying shape are obtained. Using the shape context, we outline the coarse expanding of the remaining of the shape regarding to a specified point on the shape by utilizing the shape context. By discovering similarities between two shapes, for each representative point on one shape, the representative point on the other shape that has the most sameness shape context will be ascertained. The calculation of a mapping function that transfers one shape onto the other is extended by given correspondences at representative points. Euclidean, affine, and regularized thin plate splines can be used for transformation. Aligning shapes can be considered as a measure of shape similarity. We are able to obtain the differences between two shapes by calculating a sum of fitting errors between similar points, in conjunction with an expression obtaining the magnitude of the mapping function.
Considering pi a point on the known shape and qj a point on the unknown shape. Supposing C(pi,qj) is the cost of matching pi with qj. We represent shape contexts as histogram which is X2 test statistics
C(pi, qj) = 1/2∑kk = 1 {[hi(k)-hj(k)]2/[hi(k)+hj(k)]} (2)
where hi(k) and hj(k) show the k bin normalized histogram at pi and qj respectively. It denotes the set of costs cij between all pairs of points pi on the known shape and qj on the unknown shape. It is desired to minimize the total cost of matching expressed by Eq. (3)
H(n) = ∑ c(pi, qπ(i)) (3)
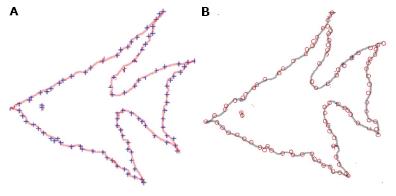
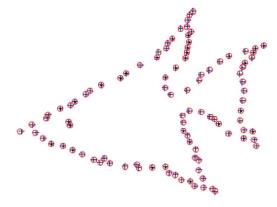
where is a permutation. By using Hungarian technique it can be solved in O(N3) time. Examples of known object as well as unknown object with their point sets are shown in Figure 1A, Figure 1B respectively. Besides, the correspondences between the two shapes are depicted in Figure 2. Moreover, Figure 3 shows the alignment of two shapes after applying alignment transformation. By evaluating a finite set of similarities between points on two shapes, we obtain a plane transformation. In this work, TPS was used. In the following, a brief description of TPS is provided.
Bookstein[14] realized the model changes in biological forms where TPS is the mostly powerful candidate. When working with shape contexts TRS is greatly preferable. It is applied to map randomly points from one shape to another. TPS is 2D generalization of the cubic spline. Supposing that position (xi,yi) are not collinear and are all different. The Bending energy is minimized by the TPS interpolant f(x,y) and has the form If.
If = ∫∫(∂2f/∂χ2)2 + 2(∂2f/∂χ∂y)2 + (∂2f/∂y2)2 dxdy
f (x, y) = a1 + axx + ayy + ∑ni = 1 wiU (||(xi, yi)-(x, y)||) (4)
where U(r) is defined as Eq. (5)
U(r) = r2logr2 (5)
In this work, thermal images, available from Thermal imaging lab in the San Francisco Bay Area[15], Ann Arbor thermography center[16], American College of Clinical Thermology[17], Sun State thermal imaging center in Australia[18] , and Thermography of Iowa[19] were studied[20].
From the Department of Diagnostic Radiology, Singapore General Hospital, some data were also collected[21]. For imaging the room temperature was selected in the range of 20 °C-22 °C (within ± 0.1 °C) in addition with humidity at 60% ± 5%. To stabilize and reduce basal metabolic rate, patients were required to rest at least 15 min. Since the vascularization is at basal level with least engorgement of blood vessels during the period of the 5th to 12th and 21th day after the onset of menstrual cycle, the patients were recommended to have examinations within these periods. The algorithm follows the following steps: (1) Randomly choosing a set of points of left breast boundaries as well as a set of points of right breast boundaries; (2) Evaluating similarities between points on two breasts boundaries; and (3) Utilizing the similarities to obtain mapping function. The obtained mapping function is applied to map the interior points. In digital images, pixels are limited to set on a sampling grid, to occupy an integer lattice. Usually the output grid is not correlated with the integer lattice. However, the place of grid points may be any continuous values that are obtained by utilizing the mapping function. Consequently, an interpolation is required to fit a continuous surface through the data. Hence, non-integer places of output grid are attainable by sampling the continuous surface. The output image quality is very depended on the accuracy of interpolation; and (4) Determining the R,G,B amounts of the output grid by applying cubic spline properly.
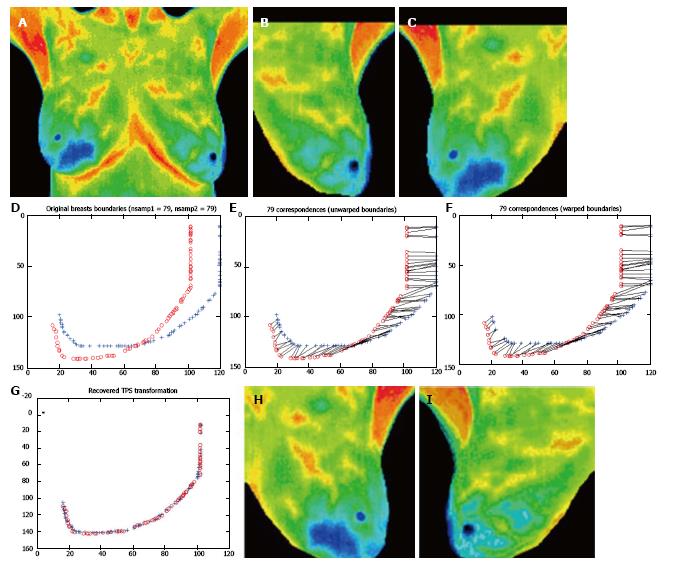
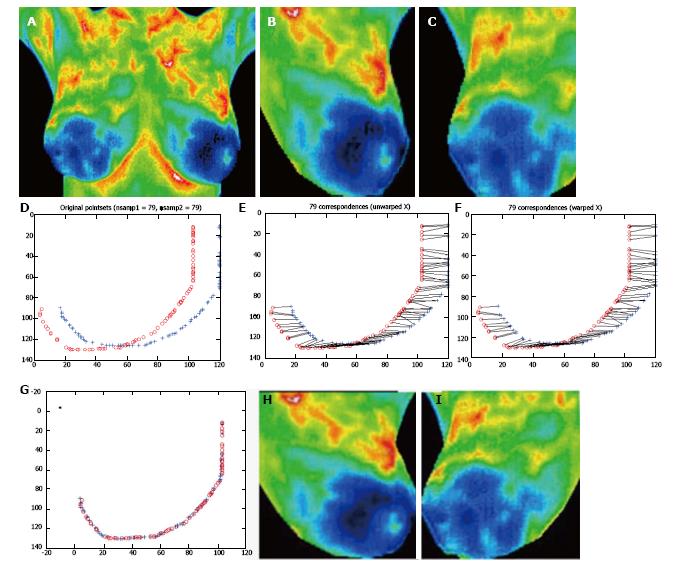
The algorithm was implemented in 32 cases. It works perfectly for 28 cases. Implementations of the algorithm for two cases are shown in Figure 4 and Figure 5. Left breasts are shown in Figure 4A and Figure 5A as well as right breasts in Figure 4B and Figure 5B. Points set of boundaries of right breasts and points set of boundaries of left breasts are depicted in Figure 4D and Figure 5D. Unwarped boundaries are shown in Figure 4E and Figure 5E and warped boundaries in Figure 4F and Figure 5F respectively. The boundaries of two breasts after employing the mapping function are presented in Figure 4G and Figure 5G. Moreover interpolated left and right breasts giving the mapping of the interior points are shown in Figure 4H and Figure 5H.
In conclusion, we have proposed an approach to achieve symmetric boundaries for left and right breasts boundaries in thermal images. The algorithm is based on using shape contexts method. Then, to map the interior points of two breasts, the calculated mapping function of boundaries points is used. Some of advantages for using shape context method in this work are as follows: (1) no special land marks or key points are needed; (2) it is tolerant to all common shape deformation; and (3) although it is uncomplicated and straightforward to use, it gives remarkably powerful descriptor for point sets significantly upgrading point set registration. Results are very promising. The algorithm was implemented for 32 cases. It works perfectly for 28 cases.
In future work, we can use the two obtained symmetric breasts in thermal images to compare their thermal profiles by comparing some extracted features from contra lateral breasts in order to identify thermal dissimilarities.
Breast health is one of major concerns of women’s health today. Moreover safe modality can play an important role to identify breast irregularities. Breast thermography has shown that is a non-invasive, safe method to detect breast abnormalities.
In practice, most of the real thermal breast images do not have symmetric boundaries. Hence, in order to compare thermal distribution of two breasts by comparing extracted features, a registration is needed.
Since symmetry usually indicates healthy subjects, asymmetrical temperature distribution between left breast and right breast could be a strong sign of abnormality. In practice, most of the real thermal breast images do not have symmetric boundaries. Therefore, in order to compare thermal distribution of two breasts by comparing extracted features, a registration is needed. In this work, a registration method based on shape context algorithm is introduced.
The study results suggest a registration method based on shape context algorithm for comparison between contra lateral breast temperature distributions.
Shape context: an approach to measure shape similarity. First, two sets of finite sample points from shape contours of two breasts are introduced. Second, the correspondences between the two shapes are found. Third, by finding correspondences, the sample point which has the most similar shape context is obtained. Forth, an aligning transformation that maps one shape onto the other in order to complete shape is estimated.
This article shows promising outcomes and it very technical and tough for common physicians.
P- Reviewer: Hernanz F S- Editor: Song XX L- Editor: A E- Editor: Lu YJ
| 1. | Ng EYK, Acharya RU. Remote-sensing infrared thermography. IEEE Eng Med Biol Mag. 2009;28:76-83. [PubMed] |
| 2. | Singh Y. Tumor angiogenesis: clinical implications. Nepal J Neurosci. 2004;1:61-63. |
| 3. | Uematsu S. Symmetry of skin temperature comparing one side of the body to the other. Int J Thermology. 1985;1:4-7. |
| 4. | Qi H, Kuruganti PT, Snyder WE. Detecting breast cancer from thermal infrared images by Asymmetry Analysis, Biomedical Engineering Handbook. CRC Press. 2006;27:1-14. |
| 5. | Diakides NA, Bronzino JD. Medical infrared imaging. Taylor & Francis Group: CRC Press Inc 2008; . |
| 6. | Tan TZ, Quek C, Ng GS, Ng EYK. A novel cognitive interpretation of breast cancer thermography with complementary learning fuzzy neural memory structure. Expert Syst App. 2007;33:652-666. |
| 7. | Frize M, Herry CH, Roberge R. Processing of thermal images to detect breast cancer: comparison with previous work, In proceedings of the second joint 24th annual conference and the annual fall meeting of the biomedical engineering society. IEEE EMBS/BMES Conference. 2002;2:1159-1160. |
| 8. | Jakubowska T, Wiecek B, Wysocki M, Drews Peszynski C. Thermal signatures for breast cancer screening comparative study, EMBS, 2003. Proceedings of the 25th Annual International Conference of the IEEE. 2003;2:1117-1120. |
| 9. | Schaefer G, Zavisek M, Nakashima T. Thermography based breast cancer analysis using statistical features and fuzzy classification. Pattern Recogn. 2009;42:1133-1137. [DOI] [Full Text] |
| 10. | Vinitha Sree S, Rajendra Acharya U, Ng EYK, Tan W. Breast Imaging Systems: A Review and Comparative Studies. J Mech Med Biol. 2010;10:5-34. [RCA] [DOI] [Full Text] [Cited by in Crossref: 15] [Cited by in RCA: 15] [Article Influence: 1.2] [Reference Citation Analysis (0)] |
| 11. | Ng EYK. A Review of Thermography as Promising Non-invasive Detection Modality for Breast Tumour. Int J Therm Sci. 2009;48:849-855. [DOI] [Full Text] |
| 12. | Belongie S, Malik J, Puzicha J. Shape Matching and object Recognition Using Shape Contexts. Ieee T Pattern Anal. 2002;24. |
| 13. | Vardasca R, Ring EFJ, Plassmann P, Jones CD. Thermal symmetry of the upper and lower extremities in healthy subjects. Thermo Int. 2012;22:53-60. |
| 14. | Bookstien FL. Morphometric Tools for Landmark Data. Cambridge: Geometry and Biology, Cambridge Univ Press 1991; . |
| 15. | Available from: http://www.breastthermography.com/case_studies.htm. |
| 16. | Available from: http://aathermography.com. |
| 17. | Available from: http://www.thermologyonline.org/Breast/breast_thermography_what.htm. |
| 18. | Available from: http://www.stimaging.com.au/page2.html. |
| 19. | Available from: http://www.thermographyofiowa.com/casestudies.htm. |
| 20. | Etehad Tavakol M, Ng EYK, Lucas C, Sadri S, Gheissari N. Estimating the mutual information between bilateral breast in thermograms using nonparametric windows. J Med Syst. 2011;35:959-967. [RCA] [PubMed] [DOI] [Full Text] [Cited by in Crossref: 24] [Cited by in RCA: 24] [Article Influence: 1.6] [Reference Citation Analysis (0)] |
| 21. | Ng EYK, Chen Y, Ung LN, Fok SK, Wan ISY. Thermography as an indicator of breast blood perfusion. In: Proceedings of the 10th International Conference on Biomedical Engineering. Singapore, December, 6-9 2000; 275-276. |


