Published online Apr 10, 2011. doi: 10.5306/wjco.v2.i4.179
Revised: November 15, 2010
Accepted: November 22, 2010
Published online: April 10, 2011
Laser scanning confocal endomicroscope (LSCEM) has emerged as an imaging modality which provides non-invasive, in vivo imaging of biological tissue on a microscopic scale. Scientific visualizations for LSCEM datasets captured by current imaging systems require these datasets to be fully acquired and brought to a separate rendering machine. To extend the features and capabilities of this modality, we propose a system which is capable of performing realtime visualization of LSCEM datasets. Using field-programmable gate arrays, our system performs three tasks in parallel: (1) automated control of dataset acquisition; (2) imaging-rendering system synchronization; and (3) realtime volume rendering of dynamic datasets. Through fusion of LSCEM imaging and volume rendering processes, acquired datasets can be visualized in realtime to provide an immediate perception of the image quality and biological conditions of the subject, further assisting in realtime cancer diagnosis. Subsequently, the imaging procedure can be improved for more accurate diagnosis and reduce the need for repeating the process due to unsatisfactory datasets.
- Citation: Chiew WM, Lin F, Qian K, Seah HS. Online volume rendering of incrementally accumulated LSCEM images for superficial oral cancer detection. World J Clin Oncol 2011; 2(4): 179-186
- URL: https://www.wjgnet.com/2218-4333/full/v2/i4/179.htm
- DOI: https://dx.doi.org/10.5306/wjco.v2.i4.179
A variety of medical imaging modalities such as computed tomography (CT) scanning[1], ultrasound imaging[2] and magnetic resonance imaging (MRI)[3] are used to capture digital images of biological tissue and structures. The laser scanning confocal endomicroscope (LSCEM)[4] is an emerging modality used to perform non-invasive, in vivo scanning at a microscopic scale beneath the tissue surface. This technique is also useful to capture volumetric datasets by capturing slices at progressive depth levels. The LSCEM which is an extended variation of the laser scanning confocal microscope (LSCM)[5,6], has a miniature probe to perform in vivo imaging on live tissue in hard to reach areas.
Typically, LSCM is able to penetrate and section a specimen up to 50 µm or more[7], which enables image acquisition at different depths, subsequently permitting volumetric dataset capturing. The image quality is much improved compared to other widefield microscopy techniques[6] due to the isolation from background fluorescence signals. Furthermore, this modality enables live in vivo imaging[8], minimizing patient’s agony of biopsy and avoiding flaws arising due to physical tissue cutting and specimen staining.
However, the procedural tasks for undergoing LSCEM imaging involve consumption of valuable time and resources. Firstly, current LSCEM imaging systems require manual control fully operated by the user. Secondly, the presence of typical imaging flaws such as poor dataset quality, which can only be realized after imaging ceases, will require the procedure to be re-performed. Apart from that, the lack of a realtime volume visualization system limits the flexibility for changes on-the-spot during imaging.
Performing diagnoses for diseases and medical abnormalities is a complex operation which requires trained expertise to provide an accurate outcome. However, having experienced diagnosticians alone is not enough, as the help of additional imaging and computing systems are also crucial. There has been discussion about the need for interactive visualization of LSCM datasets[9]. Consequently, it is meaningful to explore various ideas and methods proposed to view 3D datasets as 2D images. Scientific visualization of medical datasets has always been important to aid practitioners relate changes across acquired data images and perceive them visually for more precise analyses. These relations and changes are normally difficult or impossible to realize under traditional methods of reading separate data. It is also clinically useful if the captured slices can be perceived from arbitrary viewing angles or highlight desired features. These functions introduce user interaction and further promote the effectiveness of visualization.
In view of that, we present an online visualization system which performs volume rendering on-the-fly while LSCEM imaging is being carried out. In our aim to improve the imaging procedure, this system should perform the required tasks without alterations to its pre-existing features and performances.
The LSCEM is a useful tool used to visualize microscopic tissue structures to a high level of detail. Since the advent of LSCEM for medical-based applications, many procedures have used this modality to obtain volume datasets[4,10-11]. Further improvements on the obtained datasets involved work including image processing methods. Some of the works include deconvolution methods[12-14] to mitigate image degradation[15], and volume reconstruction[16] for the misalignment problem. Recently LSCM has also been combined with reconfigurable computing to provide realtime imaging for instant diagnosis and tissue assessment[17].
Initial attempts to visualize LSCM datasets using volume rendering is presented by Sakas et al[18]. The authors discussed methods to render LSCM datasets, including surface reconstruction[19], maximum intensity projection (MIP)[20], and using illumination models. A specially developed visualization system known as proteus[21] is used to visualize time dependent LSCM data, focusing on the analysis of chromatin condensation and decondensation during mitosis. From the conducted experiments the authors concluded that there was no all around visualization technique at the time of publishing, and that various techniques should be offered, each with its own strengths and weaknesses.
Fast visualization of LSCM datasets using the ray casting algorithm has shown the capability to provide interactive examination of datasets, improving the understanding of LSCM imaging. Further enhancement using pre-processing for intensity compensation and image deconvolution to enhance the dataset is also useful.
Volume rendering is the study of displaying 3D objects onto a 2D screen. A generalized rendering equation[22] is initially used to model physical properties of light transport. This equation describes the way objects are viewed in reality, enabling computing systems to simulate these phenomena. Subsequently, this equation is used as a theoretical basis for varying model derivations[23]. One of the most commonly used methods for rendering objects is the ray tracing algorithm. The algorithm can be used to model different objects, including polynomial surfaces[24], fractal surfaces and shapes[25], as well as volumetric densities[26].
Initially, CT scanned datasets are visualized using multiplanar reconstruction[27], which provides cross sectional representations using arbitrary configurations. The VolVis framework[28-29] is used to visualize MRI and confocal cell imaging datasets. This system is further extended to include global illumination and shadow casting[30]. A multidimensional transfer function[31] is used to render the human head and brain datasets into meaningful imaging, enabling the human user to intuitively identify different tissue material and boundaries. An open source toolkit known as the medical imaging interaction toolkit (MITK)[32], promotes interactivity and image analysis specifically for visualization of medical datasets. This system is subsequently included in the development of a software platform for medical image processing and analysis[33], with the aim of incorporating medical image processing algorithms into a complete framework.
The involved imaging device in our project is the Optiscan FIVE1 Endomicroscope (Optiscan Imaging Ltd., Victoria, Australia). This device is capable of scanning an area of 475 μm × 475 μm with up to 1024 × 1024 resolution. The scanning time for each slice with the highest resolution is approximately 1.4 s. Operating the LSCEM device requires at least one person. Functional interfaces include: (1) directing the probe to the desired imaging area; (2) controlling image scanning using a footswitch control panel; and (3) managing the dataset through the imaging software on a PC.
The conventional imaging procedure on the device is commenced by applying fluorescent material to the tissue. After absorption, the tissue will emit light signals when laser light is applied. Capture trigger and imaging depth are fully operated manually by the user. To capture a full volumetric dataset, the operator has to repetitively increment depths and capture slices individually. This results in a prolonged imaging session, where tissue or probe movements may be introduced to compromise the dataset accuracy. Also, such controls are tedious and repetitive, so an automated system is desired.
We built our prototype system on a field-programmable gate array (FPGA) chip. The Celoxica RC340 FPGA Development board is the main platform we use to program the FPGA. FPGAs are future oriented building bricks that allow logic circuits to be implemented in any fashion. System-on-Chip designs can thus be built on a single device using FPGAs. FPGAs are also well-known for the reconfigurable feature, which allows different designs to be implemented on the same chip. This promotes lower design costs and ease of prototyping. In our system, we integrate automated imaging control, realtime rendering and task allocation into a single device, which makes FPGAs suitable as they do not adhere to any fixed computational or programming models.
The FPGA is responsible for running three core tasks in parallel. Firstly, to efficiently couple the imaging and rendering systems reliably, task allocation and synchronization is maintained by the FPGA. Secondly, the FPGA acts as an automated controller to replace the existing footswitch for dataset acquisition. Finally, the entire volume rendering system is built on the FPGA due to support for full algorithm flexibility.
The image-ordered ray casting algorithm is used for rendering. This algorithm casts rays from each pixel on the screen towards the dataset and is an iteration process which visits each pixel on the viewing screen. Along each ray, points of a constant distance are sampled. Finally sampling points on each ray are combined in a compositing module and the output is used as the display pixel. Various compositing methods are present, commonly MIP, averaging, nearest-point and alpha compositing.
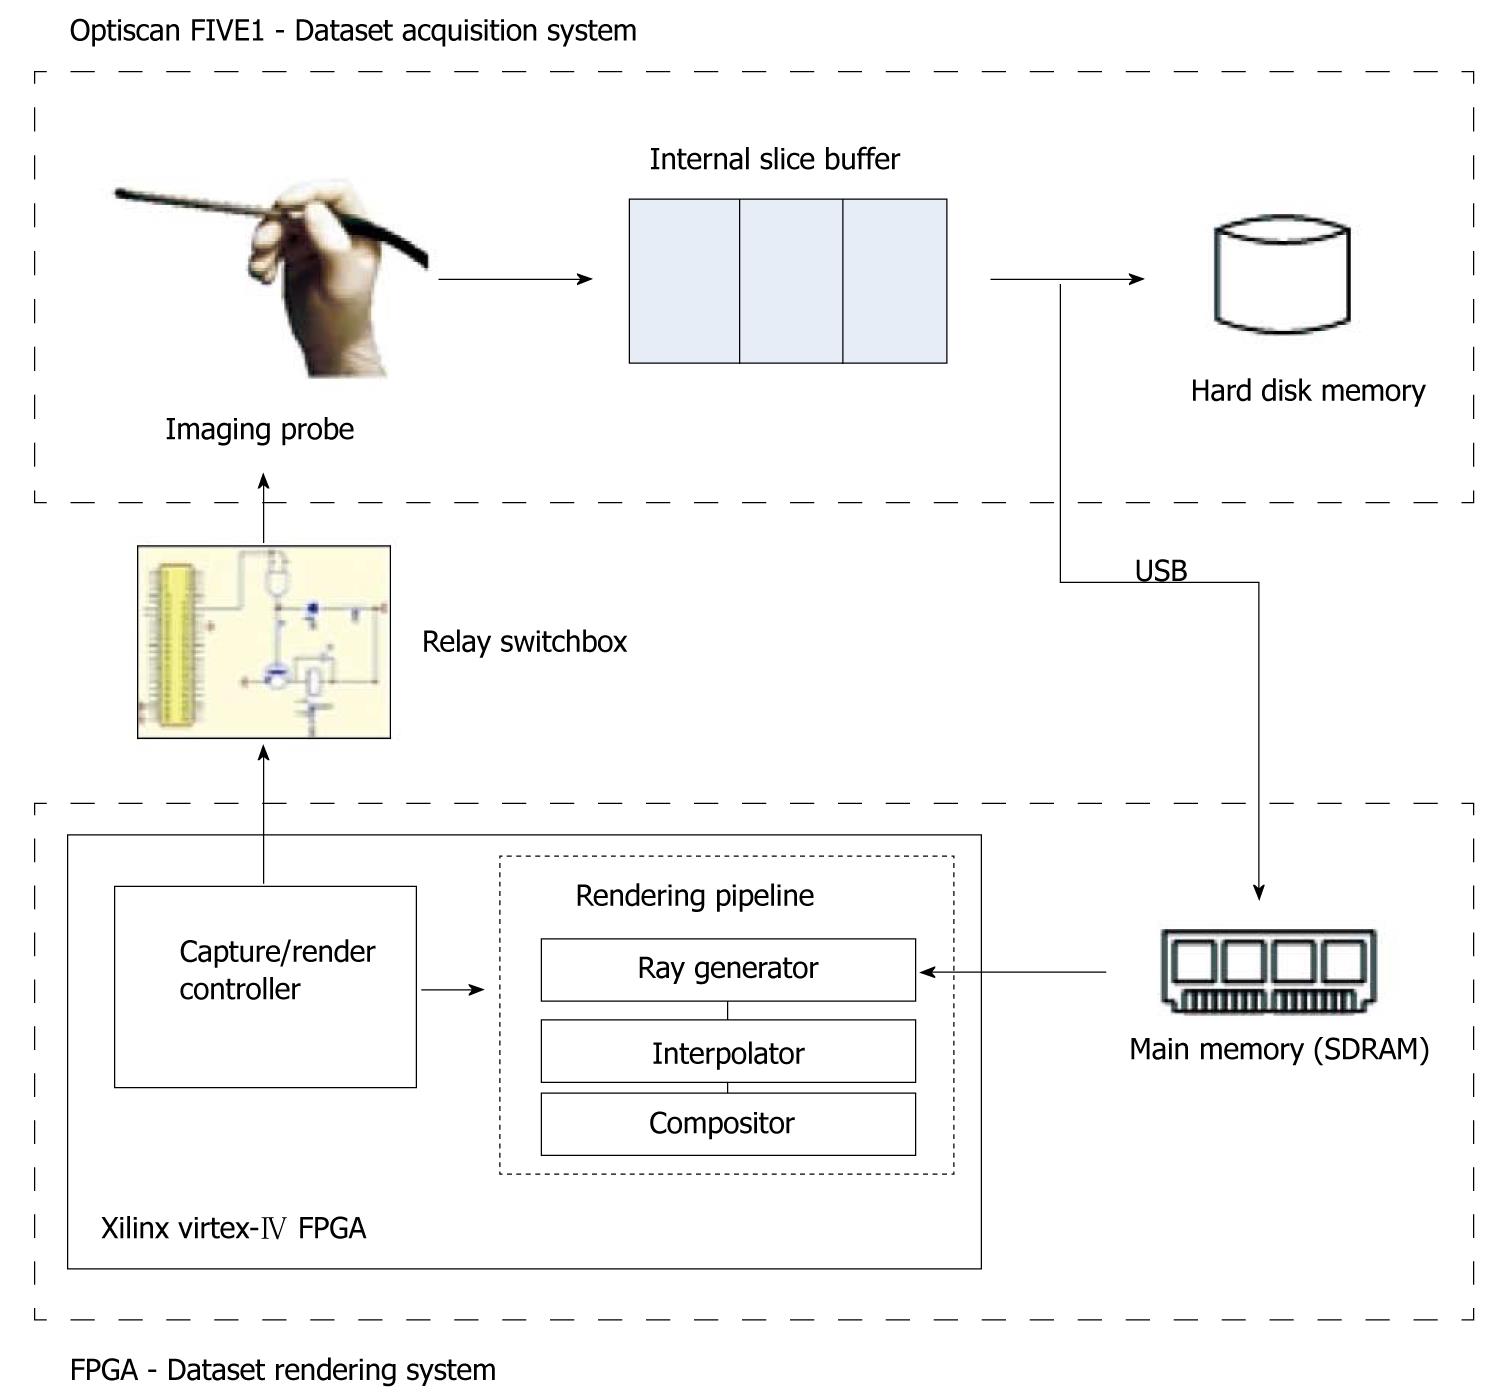
We designed the imaging-rendering system as shown in Figure 1. We developed the novel volume renderer using reconfigurable hardware for experimentation flexibility and cheaper cost for replicating prototypes. Through a handheld probe the Optiscan FIVE1 imaging device captures endomicroscopic images at incremental steps within the tissue depth to build up volumetric data. This is achieved by detecting the light signals emitted from the fluorescent chemical applied to the biological tissue. These signals, when captured by confining to a single focal plane, form an image slice. Consecutive slices captured across increasing depth will thus form a volume dataset.
Default operations involve using the provided footswitch for depth control, calibration and triggering the capture process. The supplied configuration requires the user to increment capture depths slice-by-slice and send instructions to manually progress to the next slice and trigger a capture. This poses disadvantages which include prolonged capture time and complications that arise, due to change of state and condition of the tissue. Requiring the user to hold the probe while performing stepping controls on the footswitch will introduce distortion due to movements, which is significant at a microscopic scale.
Apart from that, to perform continuous online rendering, scanning along the z-depth direction must be continuous and progress incrementally deeper into the tissue. In response, we developed an alternative hardware to substitute the footswitch[34]. The main task of the relay switchbox hardware is to replace the manual controls of the footswitch by sending automated signals at constant intervals to increment the z-depth value every time a slice capture is complete. The user is no longer required to manually increment plane depths and initiate capture with this substitute.
For this design, the FPGA is required to fulfill the following requirements: (1) capability to perform all the rendering computations; (2) provide realtime control signals over the imaging device; and (3) support automated scanning and capturing controls.
In the LSCEM device, the captured data are buffered in an internal memory while the scanning point moves across the subject in a raster scanning fashion. We forward an entire slice after each completed capture via the USB to our rendering device, ensuring that the rendered result is continuously updated as soon as the slice is acquired. Once the first slice is received, rendering is initiated. An electronic controller manages the rendering and imaging tasks, so the operations of the imaging device do not affect the renderer and vice versa. Rendering is performed in conjunction with acquisition, where after each capture the relay switchbox instructs the probe to progress to the next slice automatically.
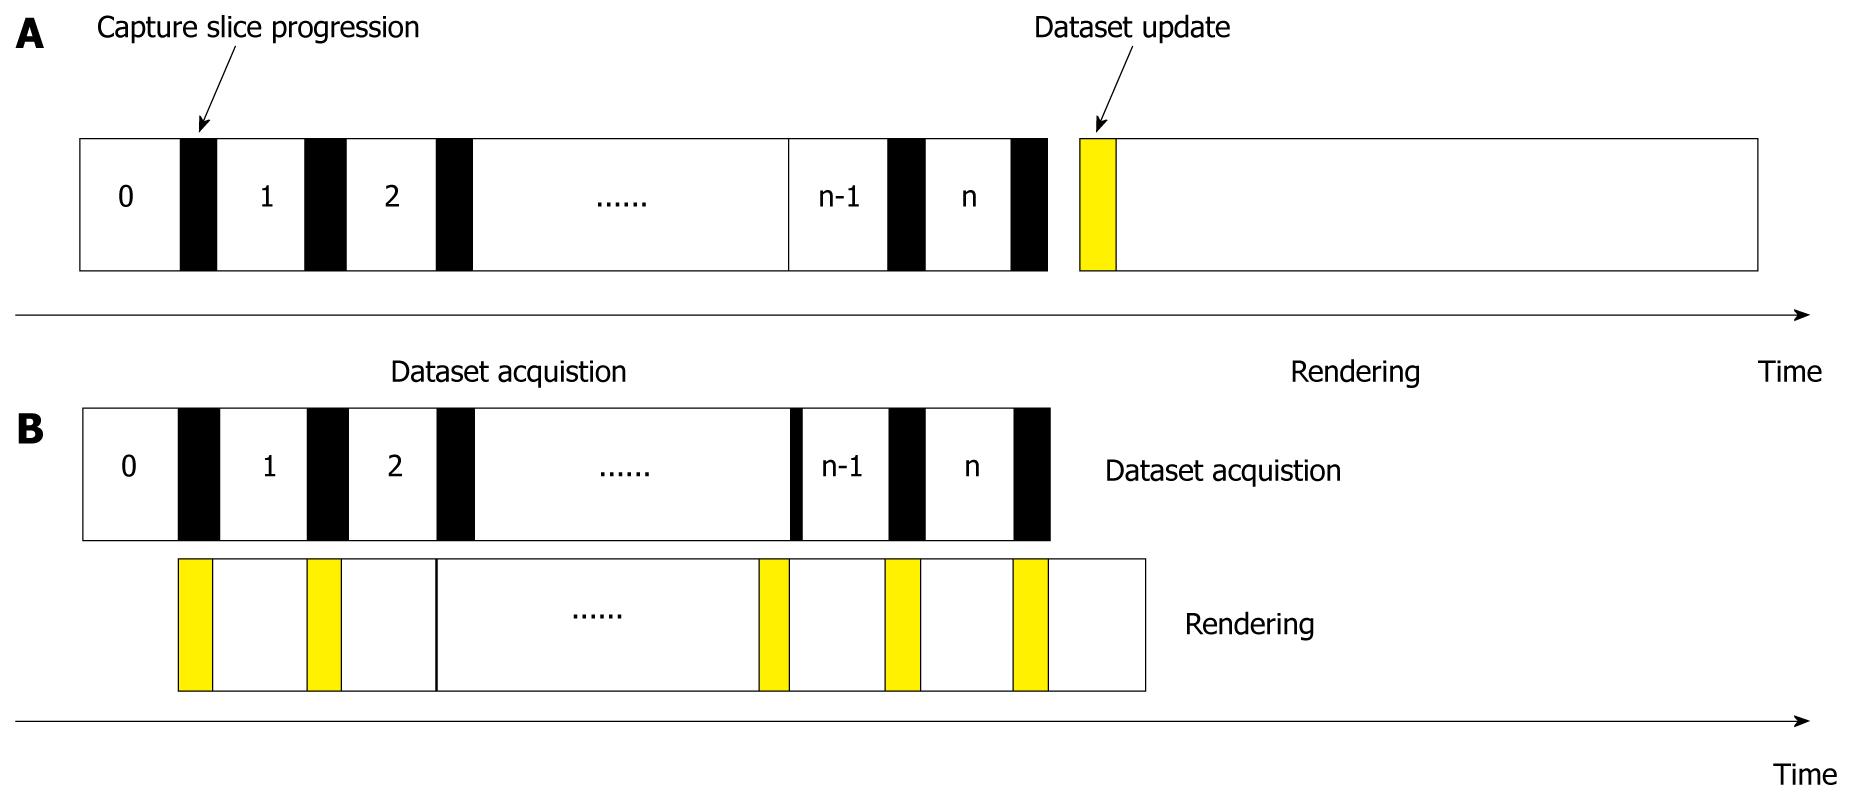
The imaging-rendering arrangement is illustrated in Figure 2. Conventional practices require the full dataset to be completed and imaging to be ceased before rendering in an alternative engine. We allocate these two processes to be performed concurrently, so that immediate results can be shown as soon as a slice is captured. The rendering and imaging operations are performed in parallel, and the imaging always captures an additional slice to be rendered for the next cycle.
The process is initiated with a slice capture by the imaging system, while the renderer is on standby as the dataset is empty. After a complete slice is captured, it is forwarded and stored in the SDRAM of the FPGA system. Rendering proceeds by retrieving required voxels for computation from the SDRAM. The SDRAM as a shared resource between imaging and rendering must be allocated to be mutually exclusive to avoid access conflicts.
The operations repeat until the final slice as determined by the user, when capturing is ceased. Rendering can still be performed on the existing dataset until it is terminated by the user.
To accommodate for the realtime requirements of the system, we have also employed several custom designed optimizations on the FPGA rendering system.
This optimization eliminates repetitive matrix transformation computations for sampling coordinates. In this case, matrix multiplications are reduced to simple arithmetic addition and subtraction operations. The ray parameters are represented by a coordinate for the ray origin and a vector for the ray direction.
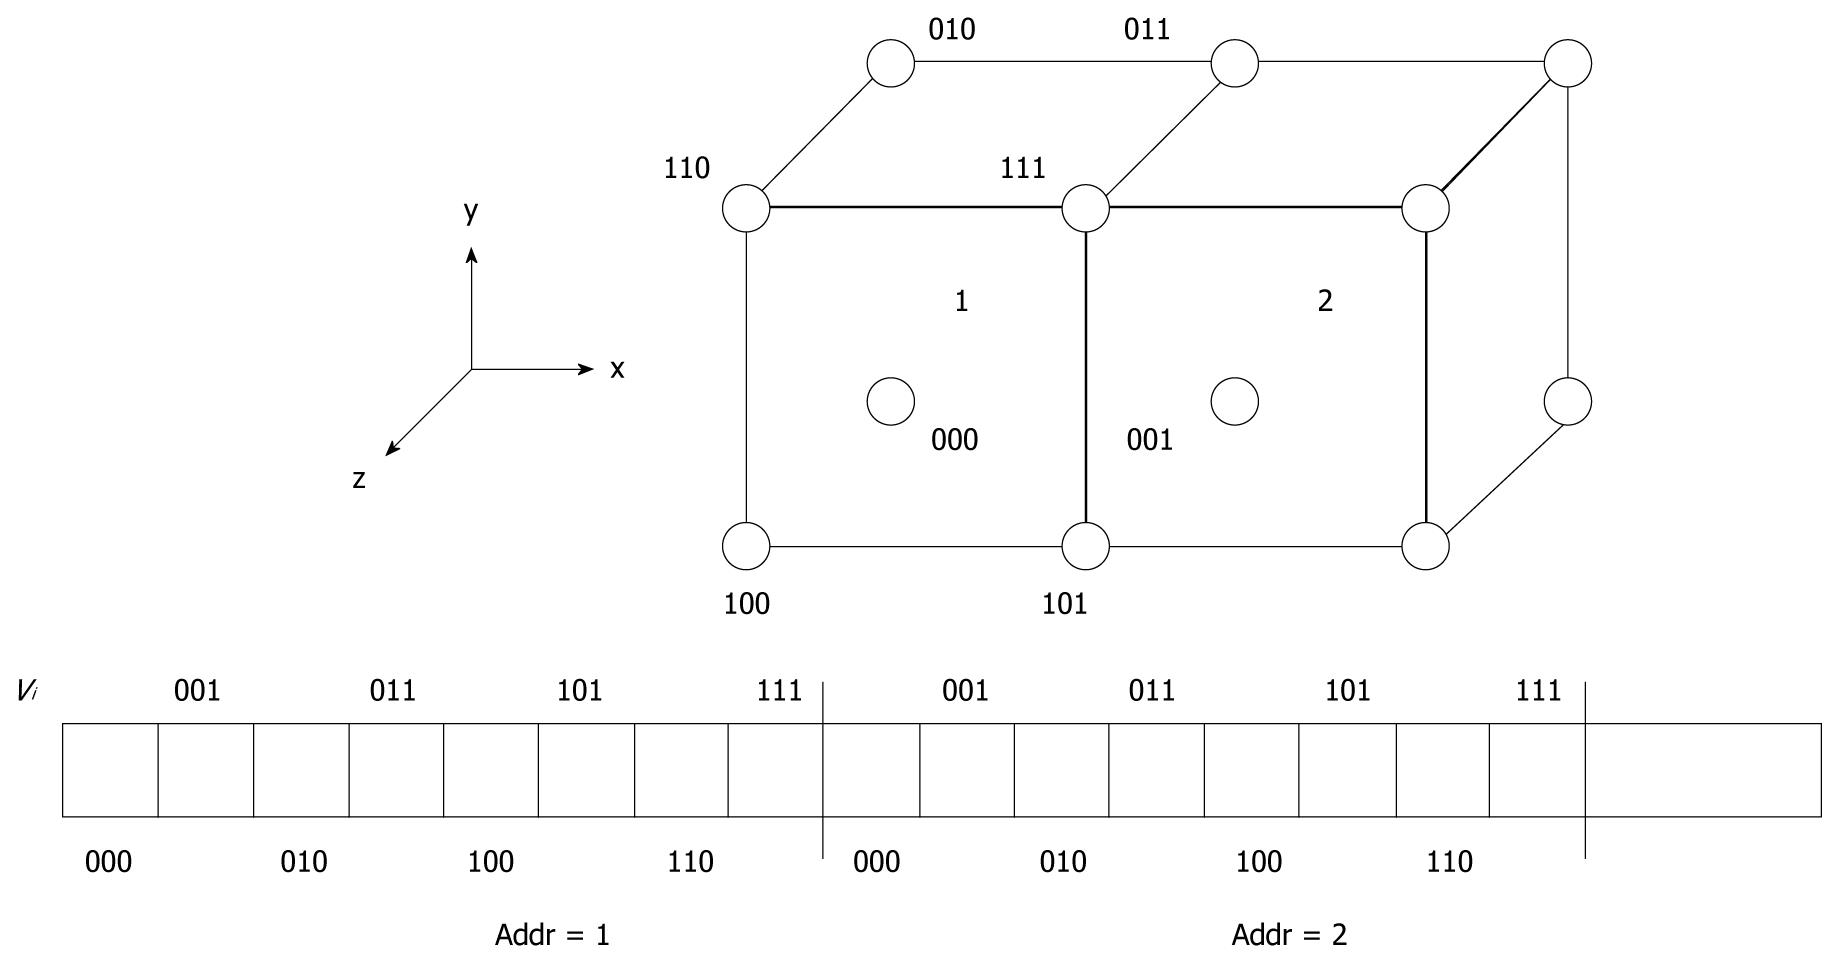
We store the dataset voxels according to a customized arrangement in the SDRAM as shown in Figure 3. This is due to trilinear interpolation for sampling voxels, which requires eight memory accesses to the SDRAM. Storing dataset voxels in a cubic fashion enables fast retrieval of these points for computations in a single cycle due to the 64-bit data bus. Using this technique, sampling points require less memory access for more efficient operations.
We introduce the accumulated rendering mode in this system. Rather than revisiting the whole dataset when a new slice is updated, the previous rendering output is directly combined with the new slice instead. Through this computation, load is limited to only two slices, regardless of the size of the dataset. Modifications to the existing compositing methods will be required, and we would anticipate further refinement and utilize it to our advantage. We perform compositing for accumulative rendering using the following formula.
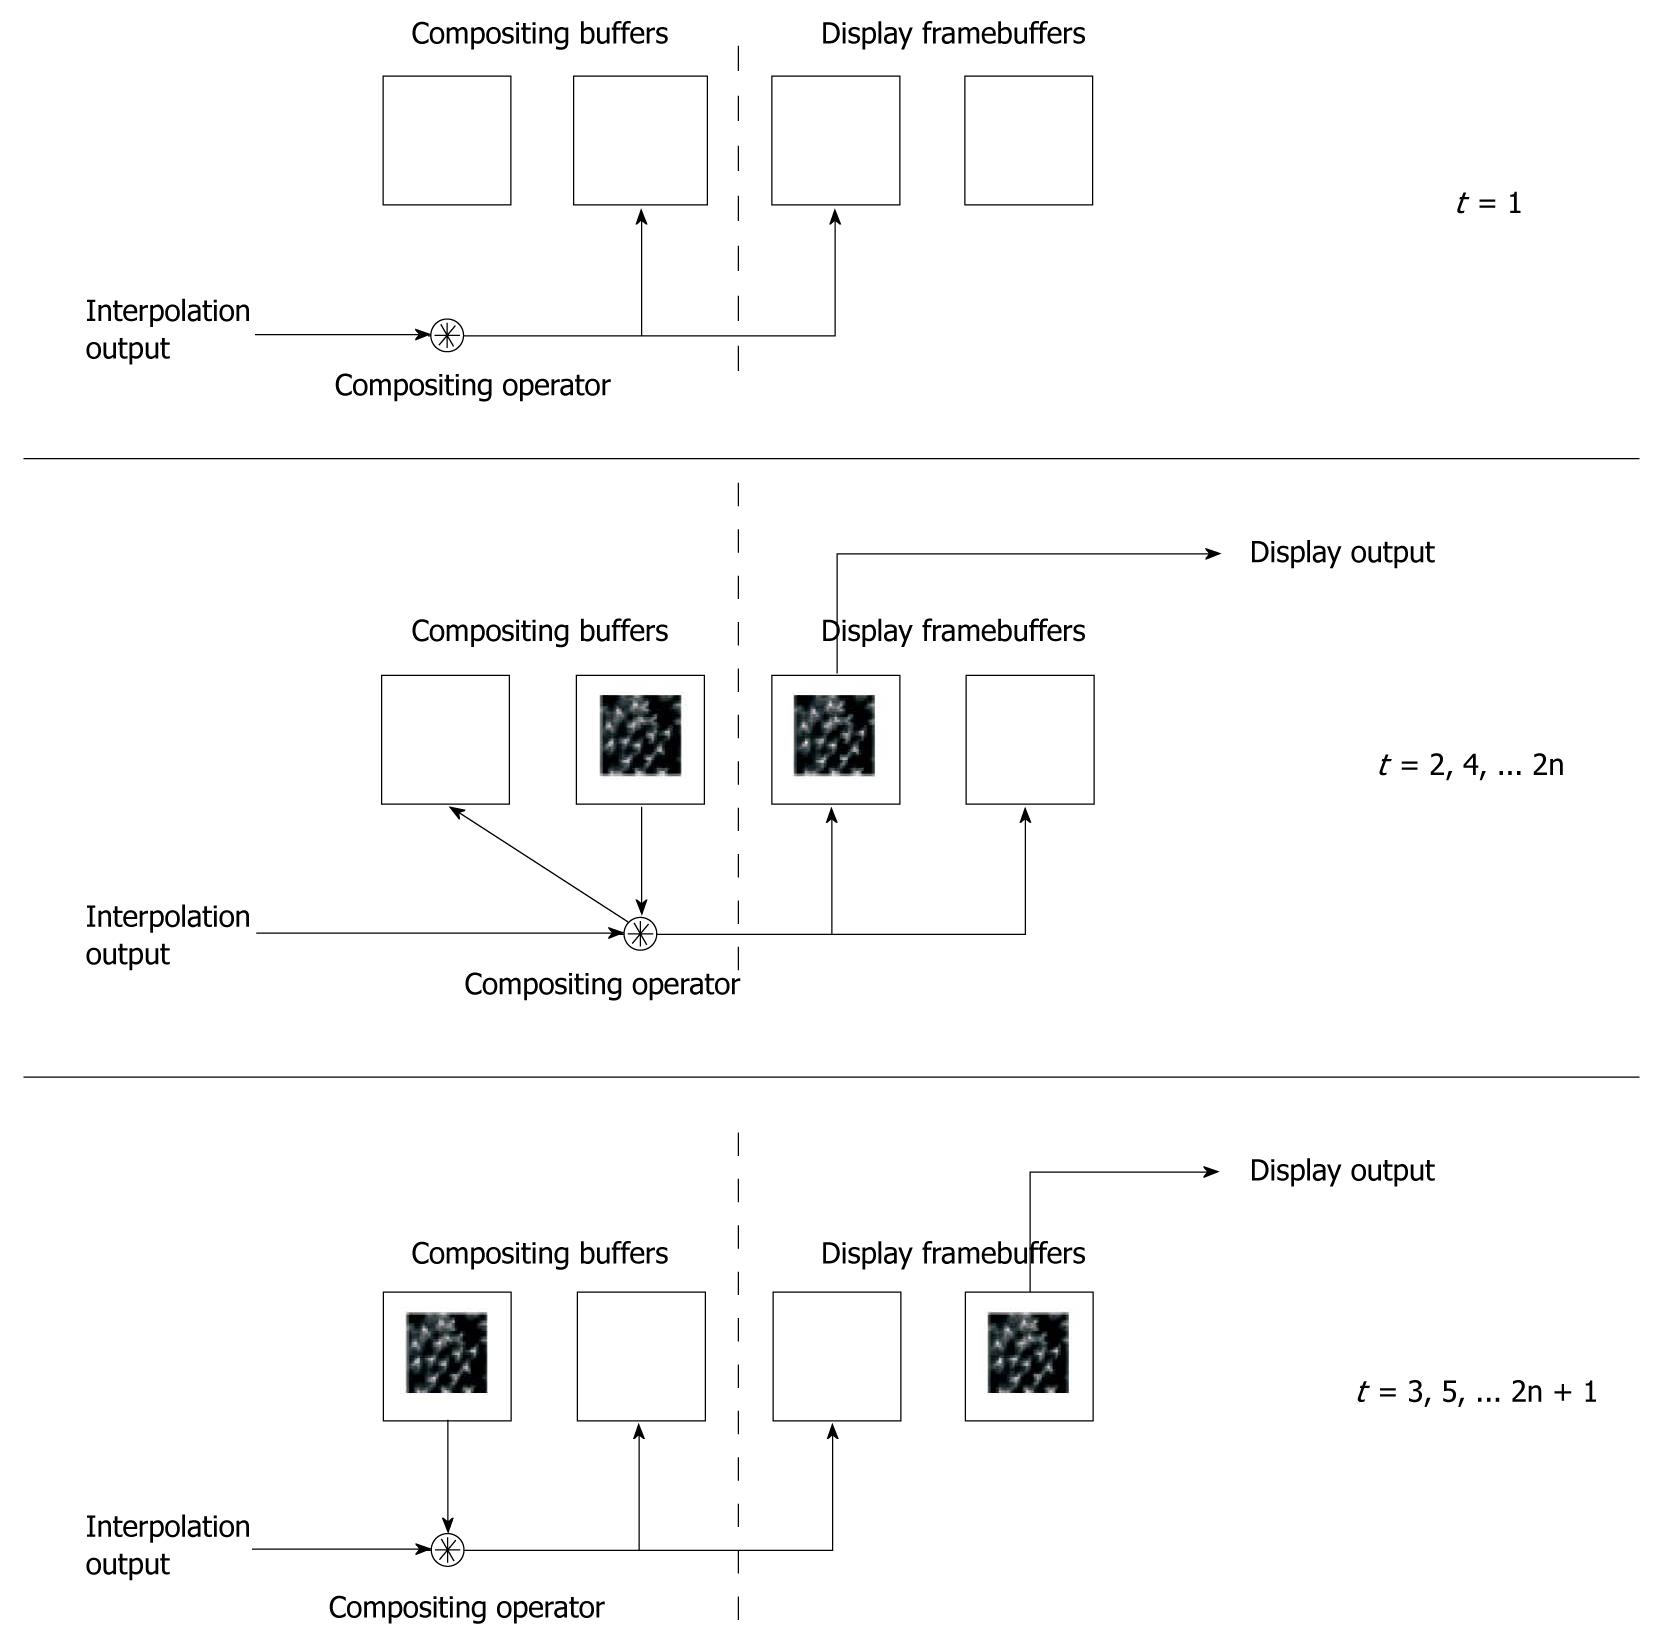
To accommodate the accumulative rendering mode, we use four framebuffers to store intermediate slices. This novel design is illustrated in Figure 4. We use four SRAM blocks as the framebuffers, two of which facilitate compositing and the remaining two as display buffers. This is used to overcome the problem of simultaneous read/write accesses, prohibited by the use of a single data bus.
During operation, the first slice only involves memory writing, where one SRAM from each framebuffer is accessed to store the acquired slice. In all other stages, the SRAM blocks interchange between memory reading and memory writing to ensure continuous flow, providing simultaneous reading and writing of rendering results. This is significant in the case of parallel pipelined coding, where memory read and write operations are continuous at each cycle, while the operations are only repeated once for each pixel. In single data placement systems, the read and write operation has to be time-multiplexed, resulting in longer time required for processing.
The introduction of these optimization techniques speeds up the rendering computation, but at the expense of several limitations. In online mode, a constant viewing configuration is employed. Viewing angles and distances cannot be adjusted in this mode, as pre-computation of ray parameters assumes that the rays are always fixed in such a manner. This limitation is further reinforced with the method of combined slices, as a view change will require the whole dataset to be re-traversed instead of only visiting the existing rendering and the new slice.
Rendering is also performed only for parallel projections, which assume that all casted rays have the same direction. Further extensions can be done to include perspective projection ray casting through modification of the system and additional memory requirements to store different ray parameters for each pixel.
Also, cubic memory scheme organizes memory cubes continuously instead of interleaved. This introduces duplications of the voxels in memory, thus increasing the memory requirements to approximately eight times dataset size. However, the capacities supported by modern hardware and our system of 256 Mbytes on-board memory can easily satisfy these requirements.
Accumulative rendering mode is currently supported only for orthographic projection rendering. The viewing direction is always assumed to be perpendicular to the slices for accumulative rendering. Further refinement of this design can enable views from arbitrary directions. As this technique only renders two slices, cubic memory is not employed for rendering under this mode, but is used for rendering under arbitrary view configurations.
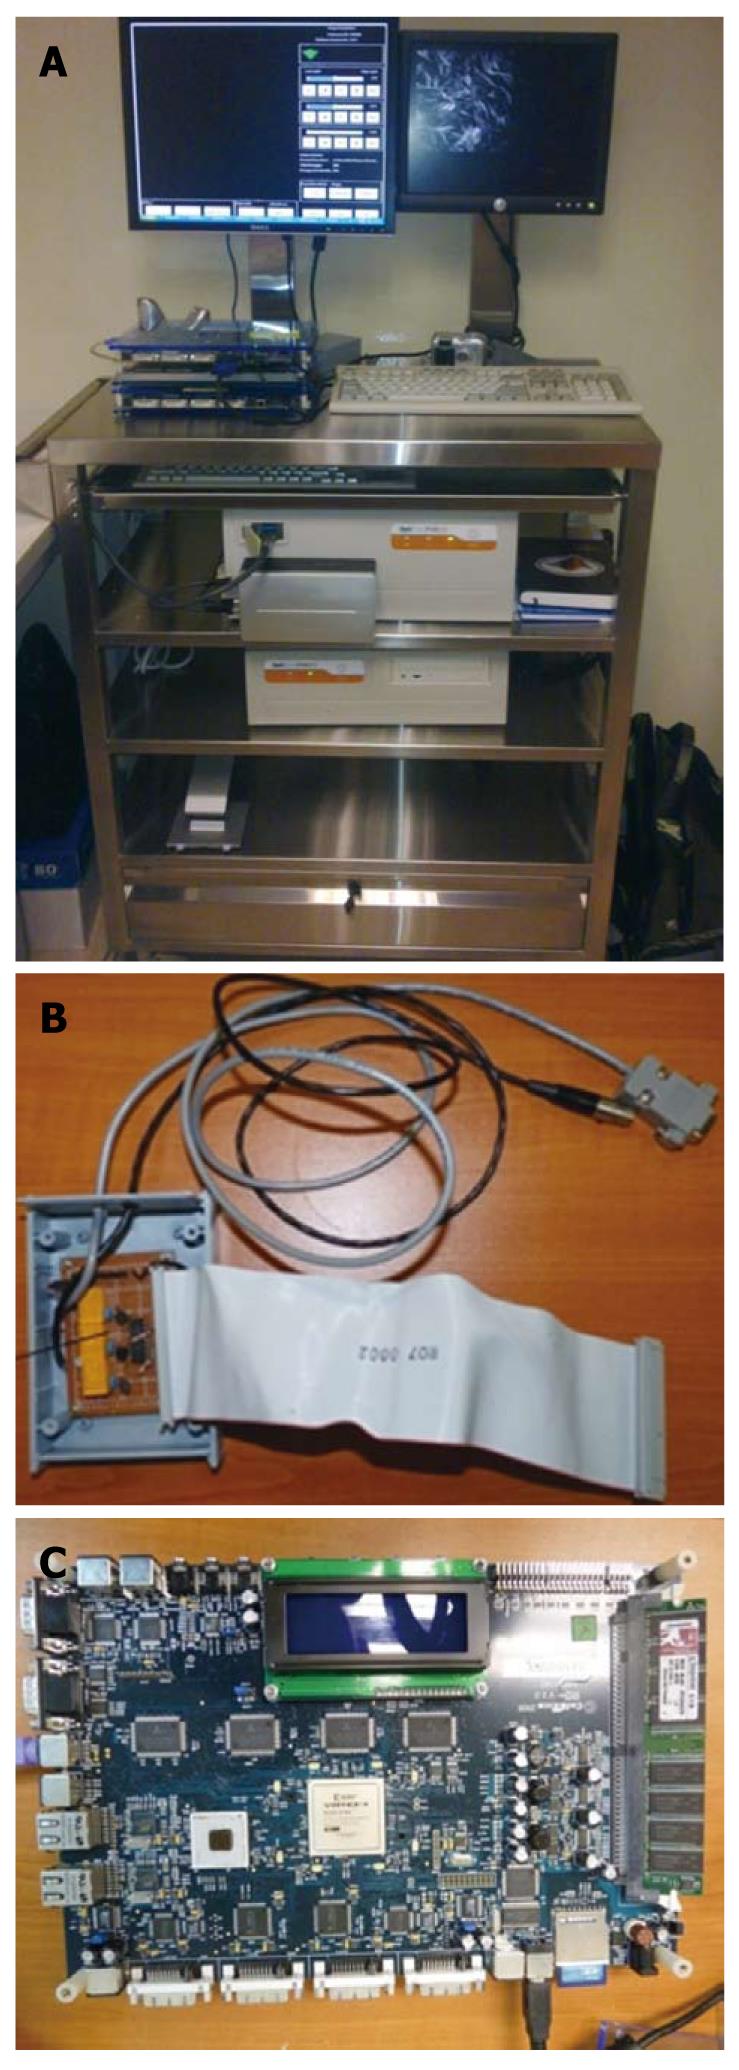
The prototype system has been built and deployed with our article-titleorators at the National Cancer Center of Singapore (NCCS) for clinical experiments. A photo of the system is shown in Figure 5. This system includes the Optiscan FIVE1 LSCEM imaging device, the Celoxica RC340 FPGA Development board, the relay switchbox hardware, and user interactivity tools.
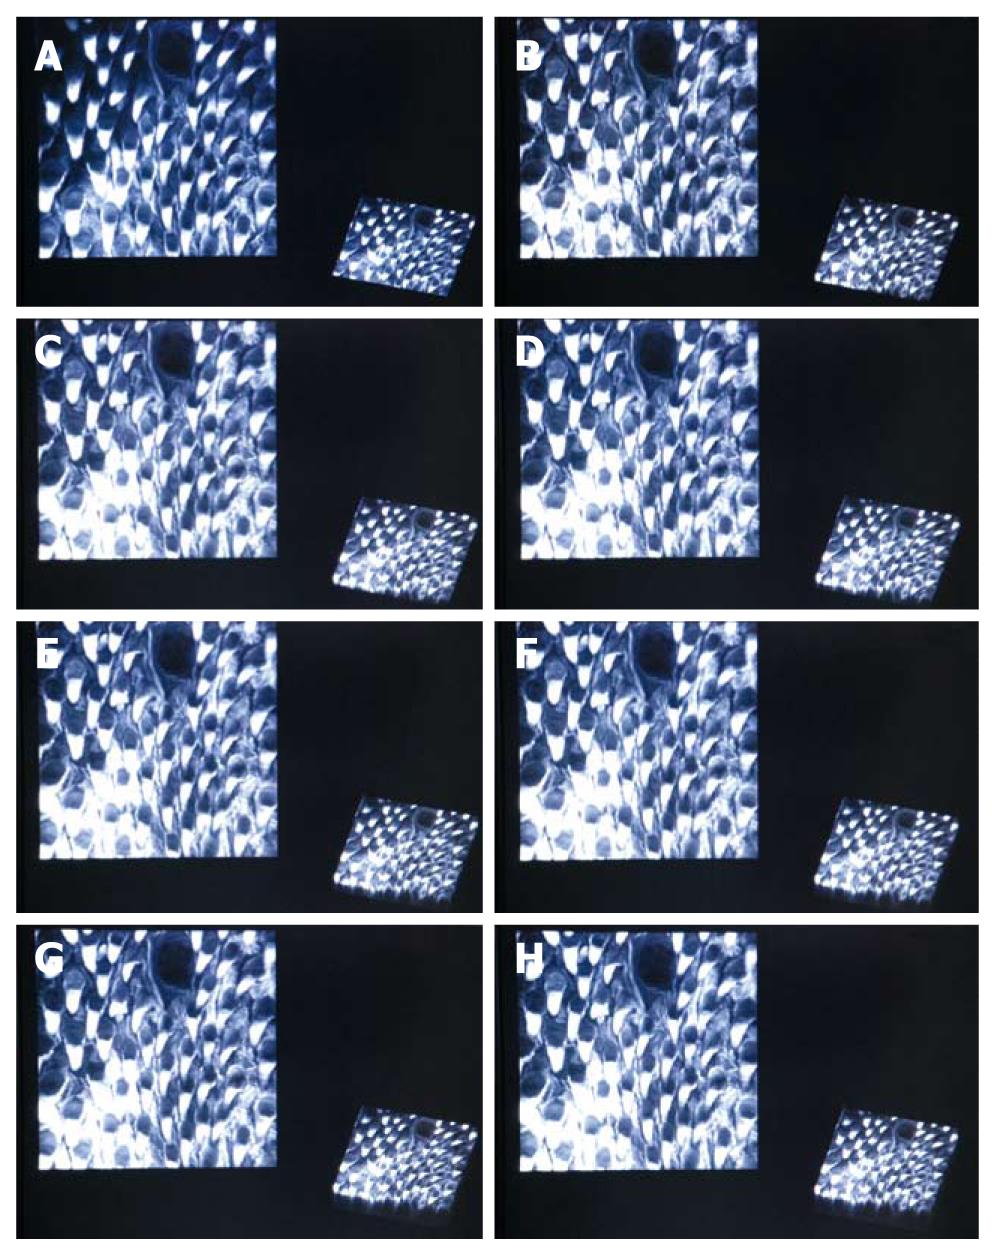
We show the realtime online rendering results for a mouse tongue dataset in Figure 6. The rendering results are live results obtained during the imaging experiment. For rendering performance, the rendering system has to at least be able to perform faster than the rate slices are acquired in order to be meaningful. This rate is approximately 1.4 s per slice. The maximum number of slices is dependent on the significance of signal degradation as the focal plane advances deeper into the tissue. For our case, the maximal is around 40 slices.
The rendering results in Figure 6 show two different views. The orthographic projection renders the dataset by setting the viewing plane parallel to the acquired slices, under accumulative rendering mode. This shows perceived results viewed through consecutive depths. At the bottom right corner is a parallel projection with a specific viewing configuration, which shows an overview of the current dataset. Observations can be made through these different views across increasing thicknesses to the dataset.
The rendering will provide immediate perception of the acquired datasets at high quality. This is aimed towards improving the imaging procedure and further enhancing the features and capabilities of LSCEM imaging. With this current platform, further extensions can be included, such as image processing techniques to provide automated diagnosis of cancer stages[17].
The entire imaging procedure is now simplified, and can be fully operated by a single user. The user can adjust the probe either by a handheld device or through a fixed stand. Capture controls are fully automated, where the user is only required to initiate and terminate imaging controls. This enhances the imaging time as well as requiring less attention from the user to operate different controls at the same time.
We have presented our preliminary system to perform online rendering side-by-side with LSCEM imaging. By having an immediate knowledge of the dataset quality as well as the biological tissue conditions, alterations can be made on the spot. This will introduce the opportunity to change imaging conditions or medical decisions according to the online rendering results. This work is also motivated by the need to realize the quality of the captured datasets in realtime to reduce excessive time required for offline rendering.
The LSCEM procedure is also simplified and only one user is required to fully operate the system. Using electronic automation to substitute the footswitch as manual controls, the user is not required to repetitively control the imaging sequences to capture a full volumetric dataset. This reduces the time and attention required to perform LSCEM imaging.
We have also shown the FPGA as a viable solution for designing a system which can run the required tasks in parallel. Providing automated controls to substitute the prevailing manual capture, we make use of our custom built hardware to interface with the imaging system. Also the FPGA is able to provide synchronized controls between imaging and rendering, which is crucial in ensuring a stable operation. The full flexibility offered by FPGAs is important, considering future developments for embedded rendering systems to co-exist with imaging devices.
We would extend this work further by incorporating more sophisticated rendering procedures such as perspective projection rendering and interactive view changes in realtime.
Peer reviewer: Brendan Curran Stack, JR, MD, FACS, FACE, Chief, McGill Family Division of Clinical Research, Department of Otolaryngology-HNS, University of Arkansas for Medical Sciences, 4301 West Markham, Slot 543, Little Rock, AR 72205, United States
S- Editor Cheng JX L- Editor O'Neill M E- Editor Ma WH
| 1. | Kak AC, Slaney M. Principles of computerized tomographic imaging. IEEE Press, 1988. . |
| 2. | Fenster A, Downey BD. 3-D Ultrasound Imaging : A Review. New York, NY, ETATS-UNIS: Institute of Electrical and Electronics Engineers 1996; . |
| 3. | Elster AD. Magnetic resonance imaging, a reference guide and atlas, 1986. . |
| 4. | Thong PS, Olivo M, Kho KW, Zheng W, Mancer K, Harris M, Soo KC. Laser confocal endomicroscopy as a novel technique for fluorescence diagnostic imaging of the oral cavity. J Biomed Opt. 2007;12:014007. |
| 5. | Amos WB, White JG. How the confocal laser scanning microscope entered biological research. Biol Cell. New York, NY, ETATS-UNIS: Institute of Electrical and Electronics Engineers 2003; 335-342. |
| 6. | Laser Scanning Confocal Microscopy. Last visited on July, 2010. Available from: http://www.olympusconfocal.com/theory/LSCMIntro.pdf. |
| 7. | Sandison DR, Webb WW. Background rejection and signal-to-noise optimization in confocal and alternative fluorescence microscopes. Appl Opt. 1994;33:603-615. |
| 8. | Gratton E, Ven MJv. Laser Sources for Confocal Microscopy. Handbook of Biological Confocal Microscopy. New York: Plenum Press 1995; 69-98. |
| 9. | Tang M, Wang H-N. Interactive Visualization Technique for Confocal Microscopy Images. In: Complex Medical Engineering, 2007. CME 2007. IEEE/ICME International Conference on 2007 2007; 556-561. |
| 10. | Ronneberger O, Burkhardt H, Schultz E. General-purpose object recognition in 3D volume data sets using gray-scale invariants - classification of airborne pollen-grains recorded with a confocal laser scanning microscope. In: Pattern Recognition 2002; 290-295. |
| 11. | Poddar AH, Krol A, Beaumont J, PriceRL, Slamani MA, Fawcett J, Subramanian A, Coman IL, Lipson ED, Feiglin DH, Dept of Electr, Comput Sci, Syracuse Univ, NY. Ultrahigh resolution 3D model of murine heart from micro-CT and serial confocal laser scanning microscopy images. In: Nuclear Science Symposium Conference Record 2005; 2615-2617. |
| 12. | Pankajakshan P, Bo Z, Blanc-Feraud L, Kam Z, Olivo-Marin JC, Zerubia J. Blind deconvolution for diffraction-limited fluorescence microscopy. In: 5th IEEE International Symposium on Biomedical Imaging: From Nano to Macro 2008, 740-743. . |
| 13. | Dey N, Blanc-Feraud L, Zimmer C, Kam Z, Olivo-Marin JC, Zerubia J. A deconvolution method for confocal microscopy with total variation regularization. In: Biomedical Imaging: Nano to Macro 2004; 1223-1226. |
| 14. | Pankajakshan P, Zhang B, Blanc-Feraud L, Kam Z, Olivo-Marin JC, Zerubia J. Parametric blind deconvolution for confocal laser scanning microscopy. Conf Proc IEEE Eng Med Biol Soc. 2007;2007:6532-6535. |
| 15. | Lee HK, Uddin MS, Sankaran S, Hariharan S, Ahmed S. A field theoretical restoration method for images degraded by non-uniform light attenuation : an application for light microscopy. Opt Express. 2009;17:11294-11308. |
| 16. | Sang-Chul L, Bajcsy P. Three-Dimensional Volume Reconstruction Based on Trajectory Fusion from Confocal Laser Scanning Microscope Images. In: Computer Vision and Pattern Recognition 2006; IEEE Computer Society Conference on 2006, 2221-8222. |
| 17. | Cheong L, Lin F, Seah H. Embedded Computing for Fluorescence Confocal Endomicroscopy Imaging. Journal of Signal Processing Systems. 2009;55:217-228. |
| 18. | Sakas G, Vicker MG, Plath PJ. Case study: visualization of laser confocal microscopy datasets. Visualization â96 Proceedings, 1996: 375-379. . |
| 19. | Levoy M. Display of surfaces from volume data. Computer Graphics and Applications, IEEE 1988, 8: 29-37. . |
| 20. | Sakas G, Grimm M, Savopoulos A. Optimized Maximum Intensity Projection (MIP), 1995. . |
| 21. | De Leeuw WC, Van Liere R, Verschure PJ, Visser AE, Manders EMM, Van Drielf R. Visualization of time dependent confocal microscopy data. Visualization. 2000;Proceedings 2000, 473-476, 593. |
| 22. | Kajiya JT. The rendering equation. SIGGRAPH Comput Graph. 1986;20:143-150. |
| 23. | Nelson M. Optical Models for Direct Volume Rendering. IEEE Transactions on Visualization and Computer Graphics 1995, 1: 99-108. . |
| 24. | Kajiya JT. Ray tracing parametric patches. Boston, Massachusetts, United States: ACM 1982; 245-254. |
| 25. | Kajiya JT. New techniques for ray tracing procedurally defined objects. SIGGRAPH Comput Graph. 1983;91-102. |
| 26. | Kajiya JT, Herzen BPV. Ray Tracing Volume Densities. ACM SIGGRAPH Computer Graphics. 1984;165-174. |
| 27. | Fishman EK, Magid D, Robertson DD, Brooker AF, Weiss P, Siegelman SS. Metallic hip implants: CT with multiplanar reconstruction. Radiology. 1986;160:675-681. |
| 28. | Avila RS, Sobierajski LM, Kaufman AE. Towards a comprehensive volume visualization system. Boston, Massachusetts: IEEE Computer Society Press 1992; 13-20. |
| 29. | Avila R, He T, Hong L, et al. VolVis: a diversified volume visualization system. Washinton, D.C. : IEEE Computer Society Press 1994; 31-38. |
| 30. | Sobierajski LM, Kaufman AE. Volumetric Ray Tracing. Proceedings of the 1994 symposium on Volume visualization 1994, 1: 11-18. . |
| 31. | Kniss J, Kindlmann G, Hansen C. Multidimensional Transfer Functions for Interactive Volume Rendering. IEEE Transactions on Visualization and Computer Graphics 2002, 8. . |
| 32. | Wolf I, Vetter M, Wegner I, Böttger T, Nolden M, Schöbinger M, Hastenteufel M, Kunert T, Meinzer HP. The medical imaging interaction toolkit. Med Image Anal. 2005;9:594-604. |
| 33. | Tian J, Xue J, Dai Y, Chen J, Zheng J. A novel software platform for medical image processing and analyzing. IEEE Trans Inf Technol Biomed. 2008;12:800-812. |
| 34. | Tandjung SS, Zhao F, Lin F, Qian K, Seah HS. Synchronized Volumetric Cell Image Acquisition with FPGA-Controlled Endomicroscope. In: Proceedings of the 2009; International Conference on Embedded Systems & Applications, ESA; 2009 July 13-16, 2009; Las Vegas Nevada, USA; 2009. |


