Published online Jan 24, 2024. doi: 10.5306/wjco.v15.i1.130
Peer-review started: August 30, 2023
First decision: November 20, 2023
Revised: December 2, 2023
Accepted: December 25, 2023
Article in press: December 25, 2023
Published online: January 24, 2024
Processing time: 146 Days and 2 Hours
Hepatocellular carcinoma (HCC) is an aggressive subtype of liver cancer and is one of the most common cancers with high mortality worldwide. Reprogrammed lipid metabolism plays crucial roles in HCC cancer cell survival, growth, and evolution. Emerging evidence suggests the importance of fatty acid binding proteins (FABPs) in contribution to cancer progression and metastasis; however, how these FABPs are dysregulated in cancer cells, especially in HCC, and the roles of FABPs in cancer progression have not been well defined.
To understand the genetic alterations and expression of FABPs and their associated cancer hallmarks and oncogenes in contributing to cancer mali
We used The Cancer Genome Atlas datasets of pan cancer and liver hepatocellular carcinoma (LIHC) as well as patient cohorts with other cancer types in this study. We investigated genetic alterations of FABPs in various cancer types. mRNA expression was used to determine if FABPs are abnormally expressed in tumor tissues compared to non-tumor controls and to investigate whether their expression correlates with patient clinical outcome, enriched cancer hallmarks and oncogenes previously reported for patients with HCC. We determined the protein levels of FABP5 and its correlated genes in two HCC cell lines and assessed the potential of FABP5 inhibition in treating HCC cells.
We discovered that a gene cluster including five FABP family members (FABP4, FABP5, FABP8, FABP9 and FABP12) is frequently co-amplified in cancer. Amplification, in fact, is the most common genetic alteration for FABPs, leading to overexpression of FABPs. FABP5 showed the greatest differential mRNA expression comparing tumor with non-tumor tissues. High FABP5 expression correlates well with worse patient outcomes (P < 0.05). FABP5 expression highly correlates with enrichment of G2M checkpoint (r = 0.33, P = 1.1e-10), TP53 signaling pathway (r = 0.22, P = 1.7e-5) and many genes in the gene sets such as CDK1 (r = 0.56, P = 0), CDK4 (r = 0.49, P = 0), and TP53 (r = 0.22, P = 1.6e-5). Furthermore, FABP5 also correlates well with two co-expressed oncogenes PLK1 and BIRC5 in pan cancer especially in LIHC patients (r = 0.58, P = 0; r = 0.58, P = 0; respectively). FABP5high Huh7 cells also expressed higher protein levels of p53, BIRC5, CDK1, CDK2, and CDK4 than FABP5low HepG2 cells. FABP5 inhibition more potently inhibited the tumor cell growth in Huh7 cells than in HepG2 cells.
We discovered that FABP5 gene is frequently amplified in cancer, especially in HCC, leading to its significant elevated expression in HCC. Its high expression correlates well with worse patient outcome, enriched cancer hallmarks and oncogenes in HCC. FABP5 inhibition impaired the cell viability of FABP5high Huh7 cells. All these support that FABP5 is a novel therapeutic target for treating FABP5high HCC.
Core Tip: Several recent studies reported that fatty acid binding proteins (FABPs) contribute to reprogrammed lipid metabolism and cancer progression; however, how these FABPs are dysregulated in cancer, especially in hepatocellular carcinoma (HCC), has not been carefully addressed. We discovered that a FABP gene cluster including FABP5 are frequently amplified in cancer. FABP5 is significantly upregulated in HCC and its high expression correlates well with worse patient outcomes, enrichment of top enriched cancer hallmarks involved in cell cycle progression, and two oncogenes PLK1 and BIRC5 in HCC. FABP5 inhibition impaired the cell viability of FABP5high HCC cells. Our data supported that FABP5 is a novel therapeutic target for treating HCC.
- Citation: Li Y, Lee W, Zhao ZG, Liu Y, Cui H, Wang HY. Fatty acid binding protein 5 is a novel therapeutic target for hepatocellular carcinoma. World J Clin Oncol 2024; 15(1): 130-144
- URL: https://www.wjgnet.com/2218-4333/full/v15/i1/130.htm
- DOI: https://dx.doi.org/10.5306/wjco.v15.i1.130
Cancer cells are heavily dependent on cellular metabolism pathways for their disease malignancy and progression. Lipid metabolism has been increasingly recognized to be reprogrammed and plays crucial roles in cancer cell survival, growth, and evolution[1].
There is emerging evidence suggesting the critical roles of fatty acid binding proteins (FABPs) in contribution to cancer progression and metastasis[2,3]. FABPs are a family of chaperone proteins that bind to long-chain fatty acids, retinoids, and other hydrophobic molecules[3]. There are ten FABP genes identified in the human genome, each with restricted tissue distribution in healthy individuals. Some of the family members including FABP4, FABP5, and FABP7 are abnormally expressed in cancer cells beyond tissue expression restriction and play important roles in cancer malignancy and progression[2,3]. FABP4 is normally expressed in adipocytes at high levels and its expression is controlled by peroxisome proliferator-activated receptor gamma (PPARγ)[4]. Accumulating evidence shows that FABP4 plays important roles in cancer progression in multiple cancer types, including breast cancer[5], ovarian cancer[6], and colon cancer[7]. In contrast, loss of FABP1 expression in colorectal cancer is associated with poor patient outcome[8]. FABP5 is normally expressed in cells of epidermal origin and emerging evidence shows that it functions to regulate fatty acid trafficking, lipid metabolism and cell growth[9]. FABP5 was found to be upregulated in many cancer types[10]. However, the mechanism leading to abnormal FABP expression in cancer is not clear and the roles of these FABPs in contributing to cancer progression have not been well defined. In this study, we aimed to investigate the genetic alterations leading to abnormal expression of FABPs in cancer and the missing links of abnormal FABP expression to cancer gene signatures and patient survival.
Hepatocellular carcinoma (HCC) cell lines HepG2 and Huh7 were obtained from our laboratory for long-term storage and cultured in high glucose Dulbecco’s modified Eagle medium containing 10% fetal bovine serum and 1% penicillin/streptomycin. SBFI-26 (S9957) was purchased from Selleck Chemicals (Houston, TX, United States). The antibodies against FABP5 (39926), p53 (9282), BIRC5 (2808), CDK1 (77055), CDK2 (2546), CDK4 (12790), MCL-1 (94296) and GAPDH (2118) were purchased from Cell Signaling Technology (Danvers, MA, United States). A CellTiter-Glo 2.0 cell viability assay kit (G9241) was purchased from Promega (Madison, WI, United States).
We performed data analysis for The Cancer Genome Atlas (TCGA) pan-cancer and liver hepatocellular carcinoma (LIHC) patient cohort through cBioPortal (https://www.cbioportal.org/) and a well-established web bioinformatic platform Gene Expression Profiling Interactive Analysis 2 (GEPIA2, http://gepia2.cancer-pku.cn/#index), developed by Zhang Lab, Peking University[11]. GEPIA2 collected RNA sequencing data of 9,736 tumors and 8,587 non-tumor samples from the TCGA and the Genotype-Tissue Expression projects.
To find out the genetic alterations of FABPs (FABP1, FABP2, FABP3, FABP4, FABP5, FABP6, FABP7, PMP2, FABP9 and FABP12) in cancer cells, we used cBioPortal tools. We checked the frequencies of each genetic alteration using TCGA pan-cancer (70655 samples from 217 non-redundant studies) and LIHC cohort (1829 samples from eleven studies) and their correlation with FABP5 mRNA expression and HCC cancer stages.
We compared mRNA expression of FABPs in tumor vs non-tumor tissues using TCGA pan-cancer (9664 tumor tissue samples and 711 non-tumor tissue samples) and LIHC cohort (360 tumor tissue samples and 50 non-tumor tissue samples) and checked if high expression correlates with poor patient outcomes using the GEAIP2 platform.
We assessed correlation of FABP5 expression with cancer hallmarks enriched in HCC cells (G2M checkpoint and TP53 signaling) and highlighted genes within the gene sets using the GEAIP2 platform.
The cell viability assay was performed as described in our earlier study[12]. Briefly, 2000 HepG2 or Huh7 cells per well were pre-seeded into white 96-well plates overnight. The cells were then treated with a 2-fold serial dilution of SBFI-26 (0-100 μmol/L). The cell viability was measured using a VICTOR Nivo Multimode Microplate Reader (PerkinElmer Health Sciences Inc, Shelton, CT, United States) at 72 h post treatment by using CellTiter-Glo 2.0 Reagent.
We performed Pearson's or Spearman's correlation test to determine whether there was a significant link between the two variables. The log-rank test was used to determine the statistical significance of gene expression in correlation with patient outcome. aP < 0.05; bP < 0.01; cP < 0.001; dP < 0.0001.
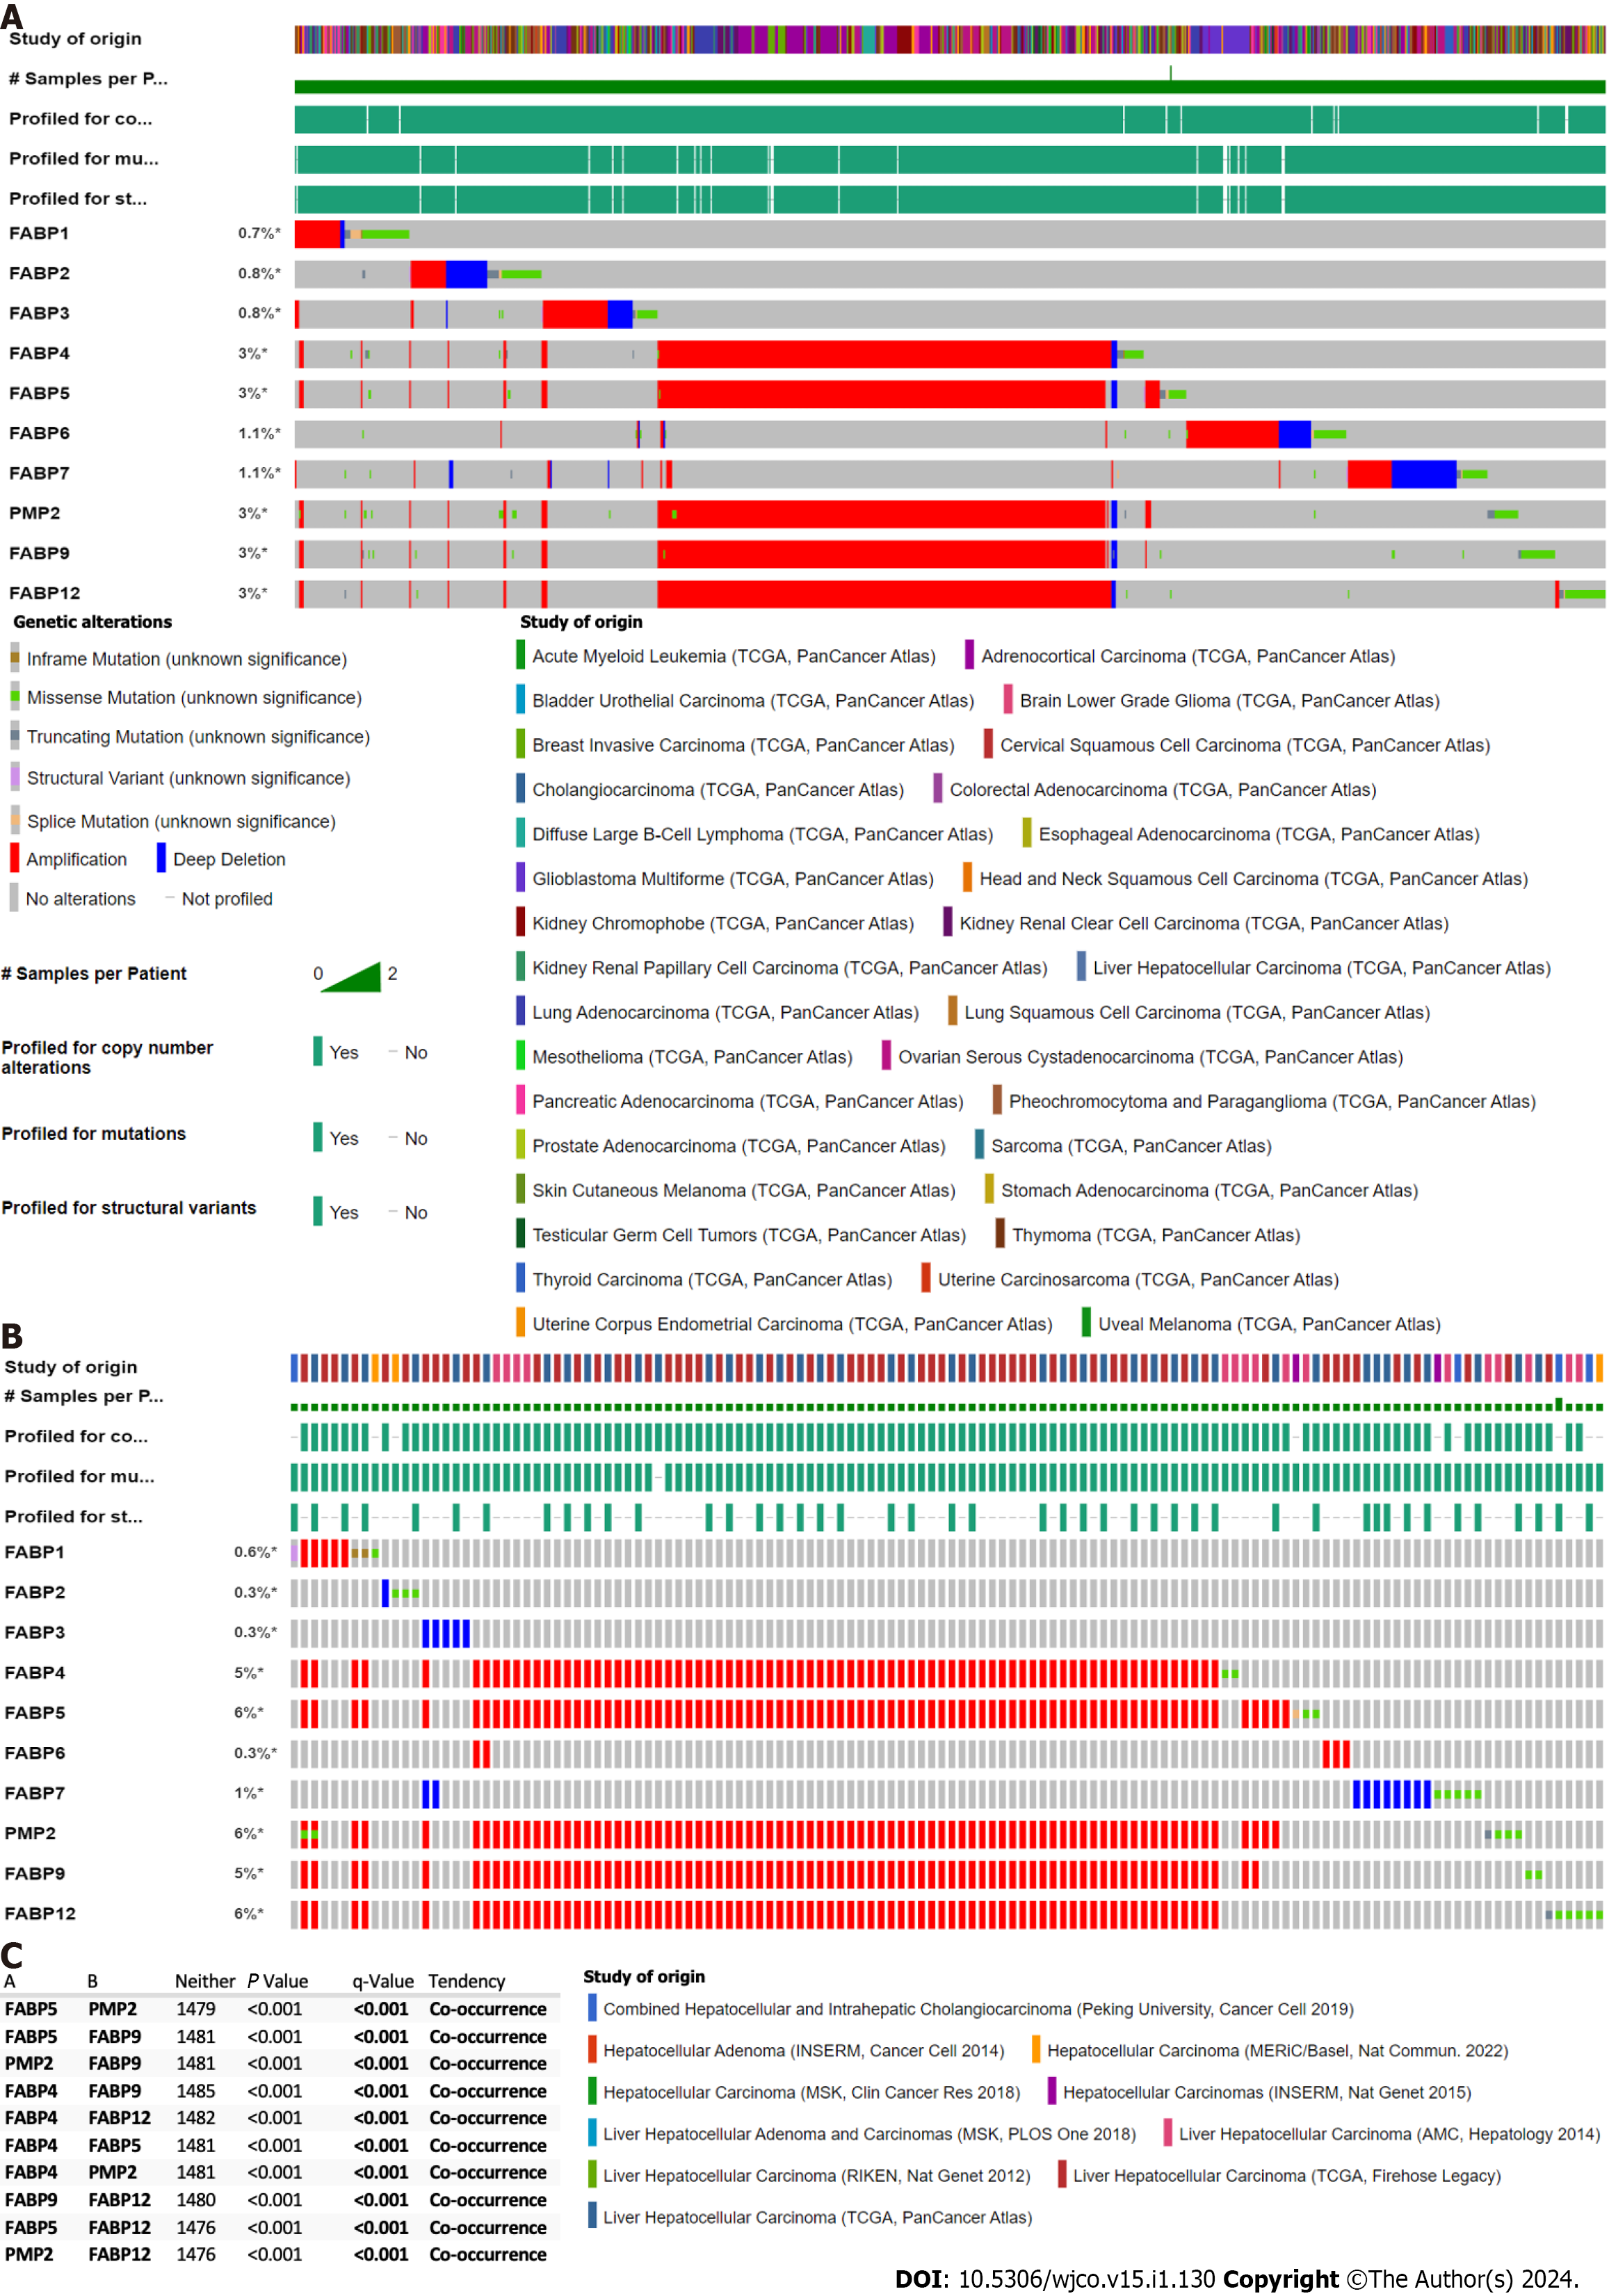
We discovered that a cluster of FABP genes FABP4, FABP5, FABP8, FABP9 and FABP12 at the adjacent loci of chromosome 8, but not other FABPs located at different chromosomes, showed high frequencies of genetic alteration (3%) in the pan-cancer cohort (Figure 1A). The frequency of genetic alterations of these FABPs reaches 5%-6% in the LIHC cohort (Figure 1B). The prevalent type of alteration is amplification and co-occurrence of amplification of these genes FABP4, FABP5, FABP8, FABP9 and FABP12 is highly significant (P < 0.001) (Figure 1C). Other genetic alterations such as mutations, structural variants and homo-deletion also occur but at much lower frequencies (Figure 1A and B).
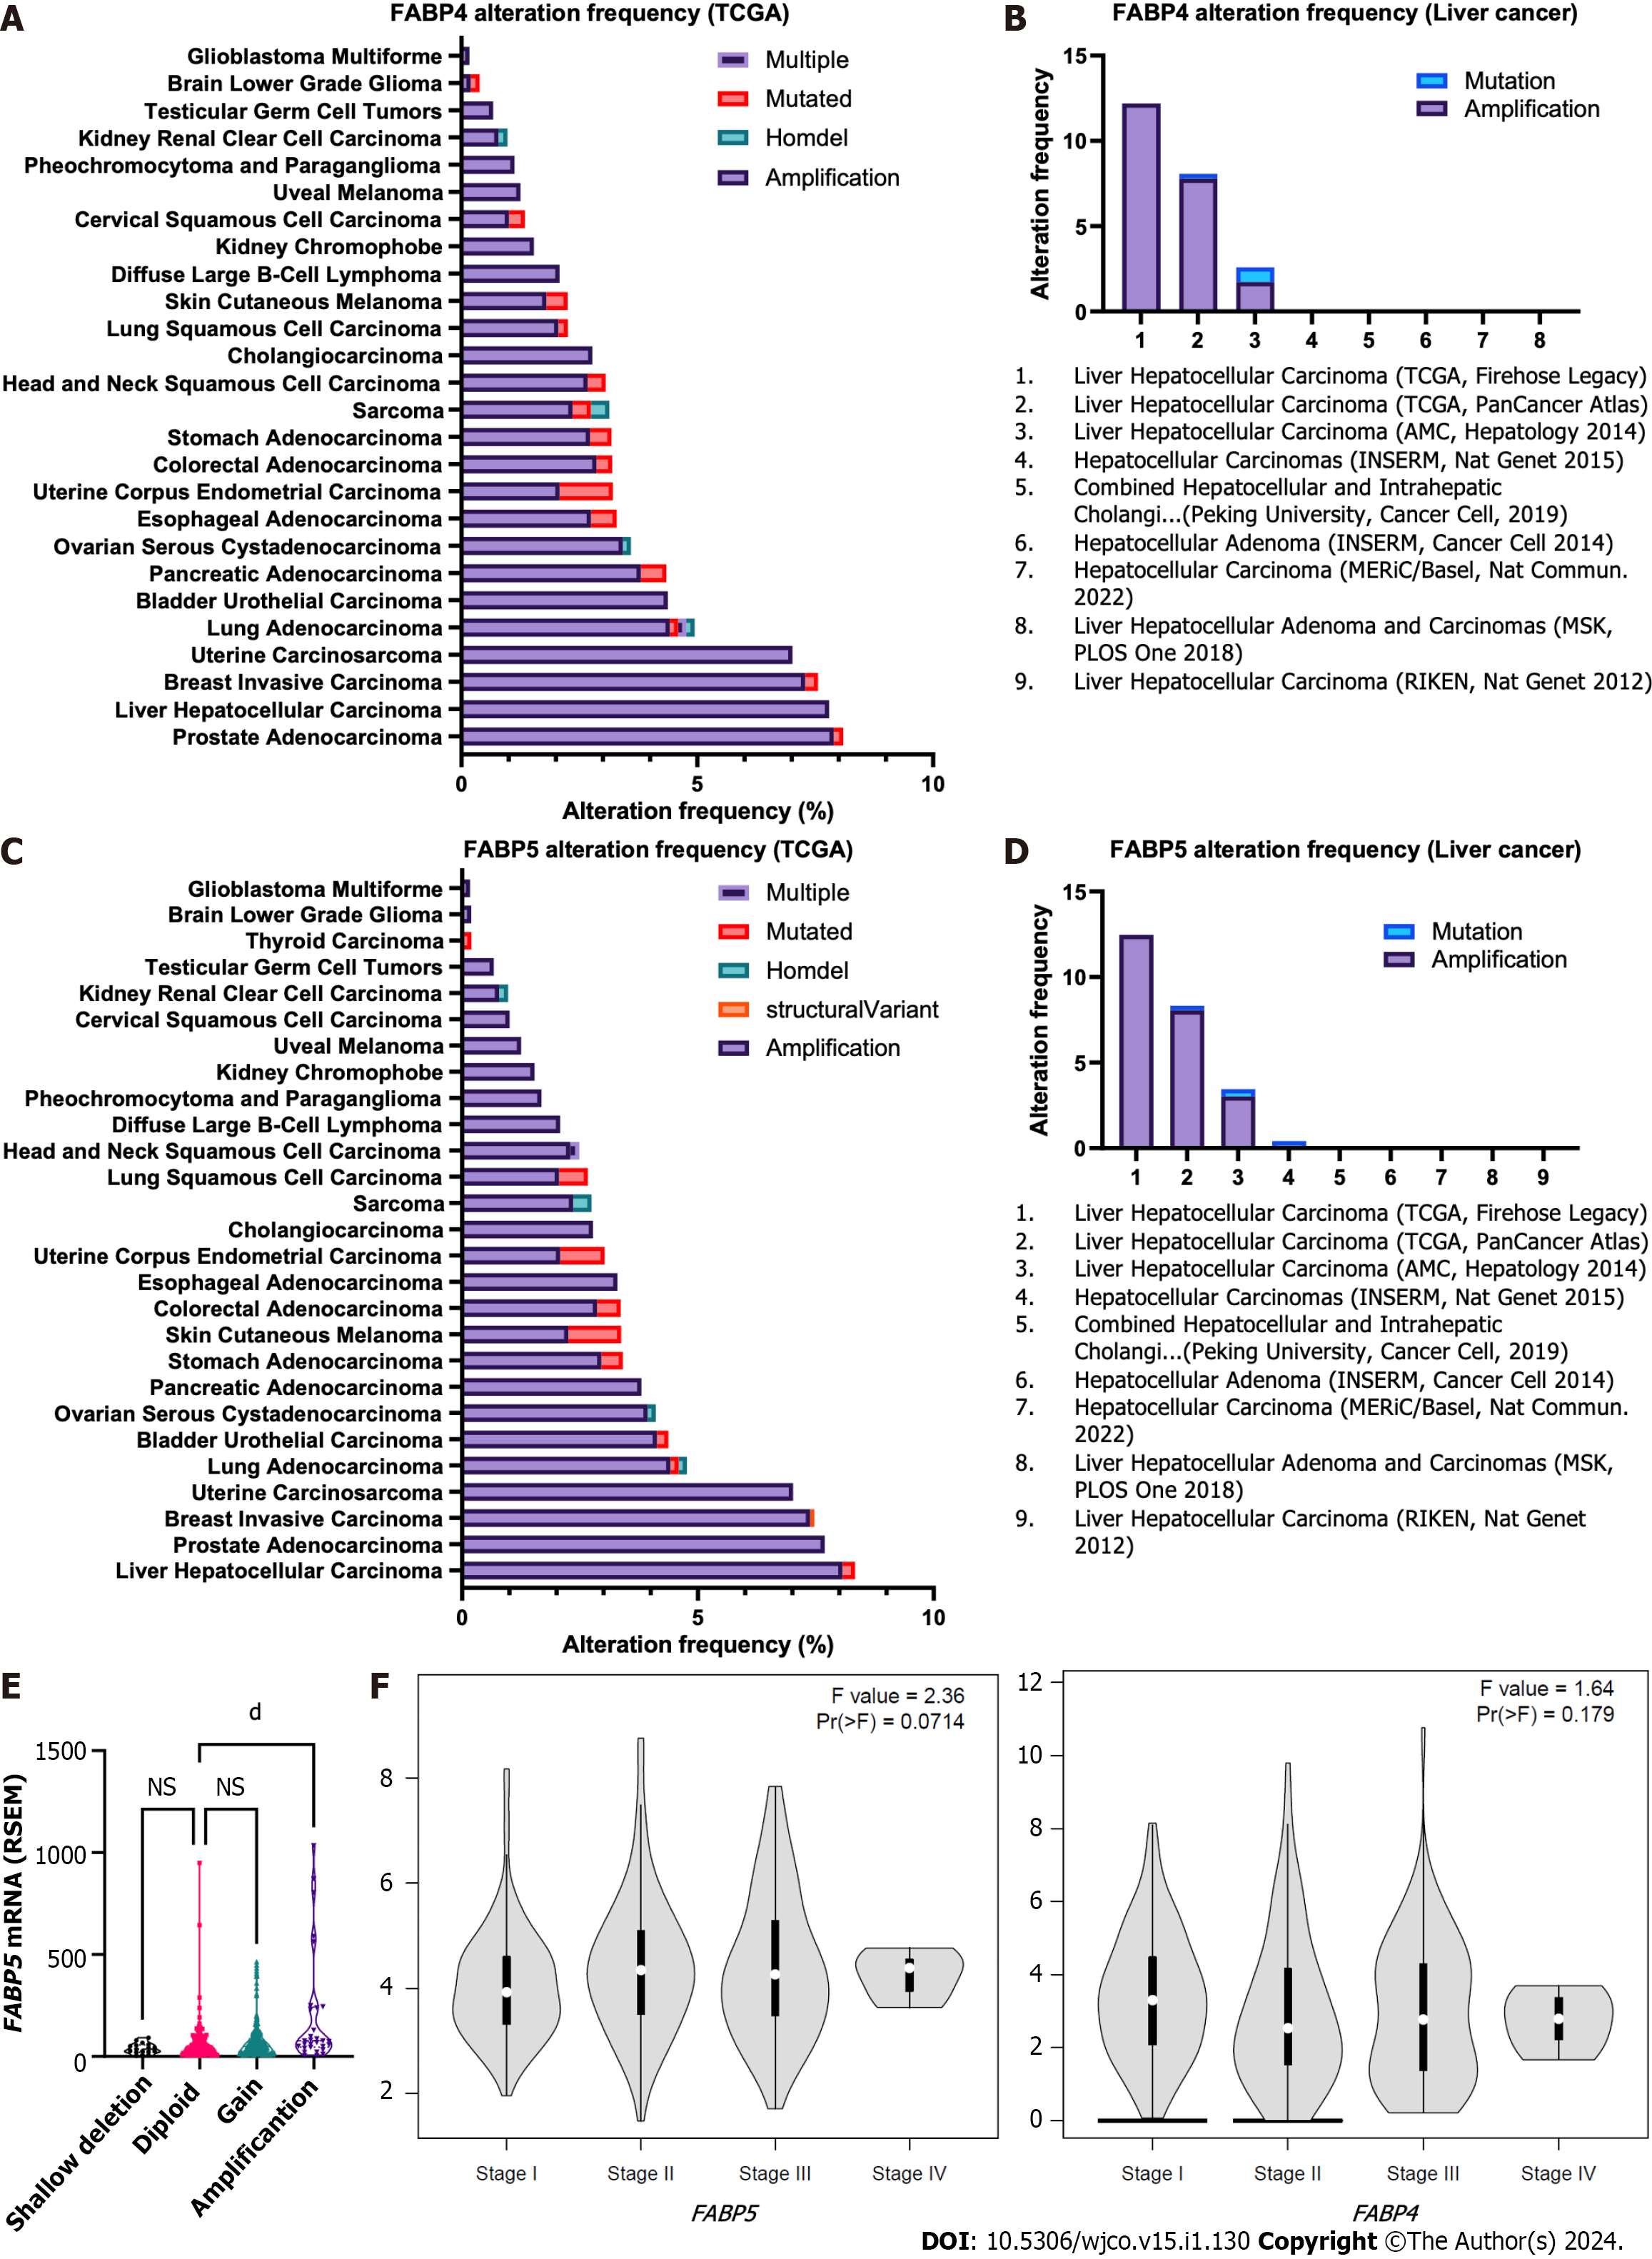
Interestingly, when we checked genetic alterations of FABPs in different cancer types, we discovered that patients with prostate adenocarcinoma (PRAD) or HCC have the highest genetic alteration frequencies among others and again with genetic amplification as the prevalent type. FABP4 showed the highest frequency in PRAD (7.9%) followed by HCC (7.8%) using TCGA pan cancer cohort, while FABP5 showed the highest frequency in HCC (8.1%) followed by prostate PRAD (Figure 2A and C). Consistent with these, when we checked their genetic status in various liver cancer cohorts, we observed high FABP4 alteration frequencies up to 12.5% and FABP5 up to 12.2% in the aggressive subtype HCC (Figure 2B and D). Importantly, FABP5 mRNA expression is much higher in the patients with FABP5 amplification than those with FABP5 gain, diploid, or deletion (P < 0.0001) (Figure 2E). Moreover, HCC cases at stage II-IV showed higher expression of FABP5 (P = 0.071), but not FABP4 (P = 0.179) (Figure 2F).
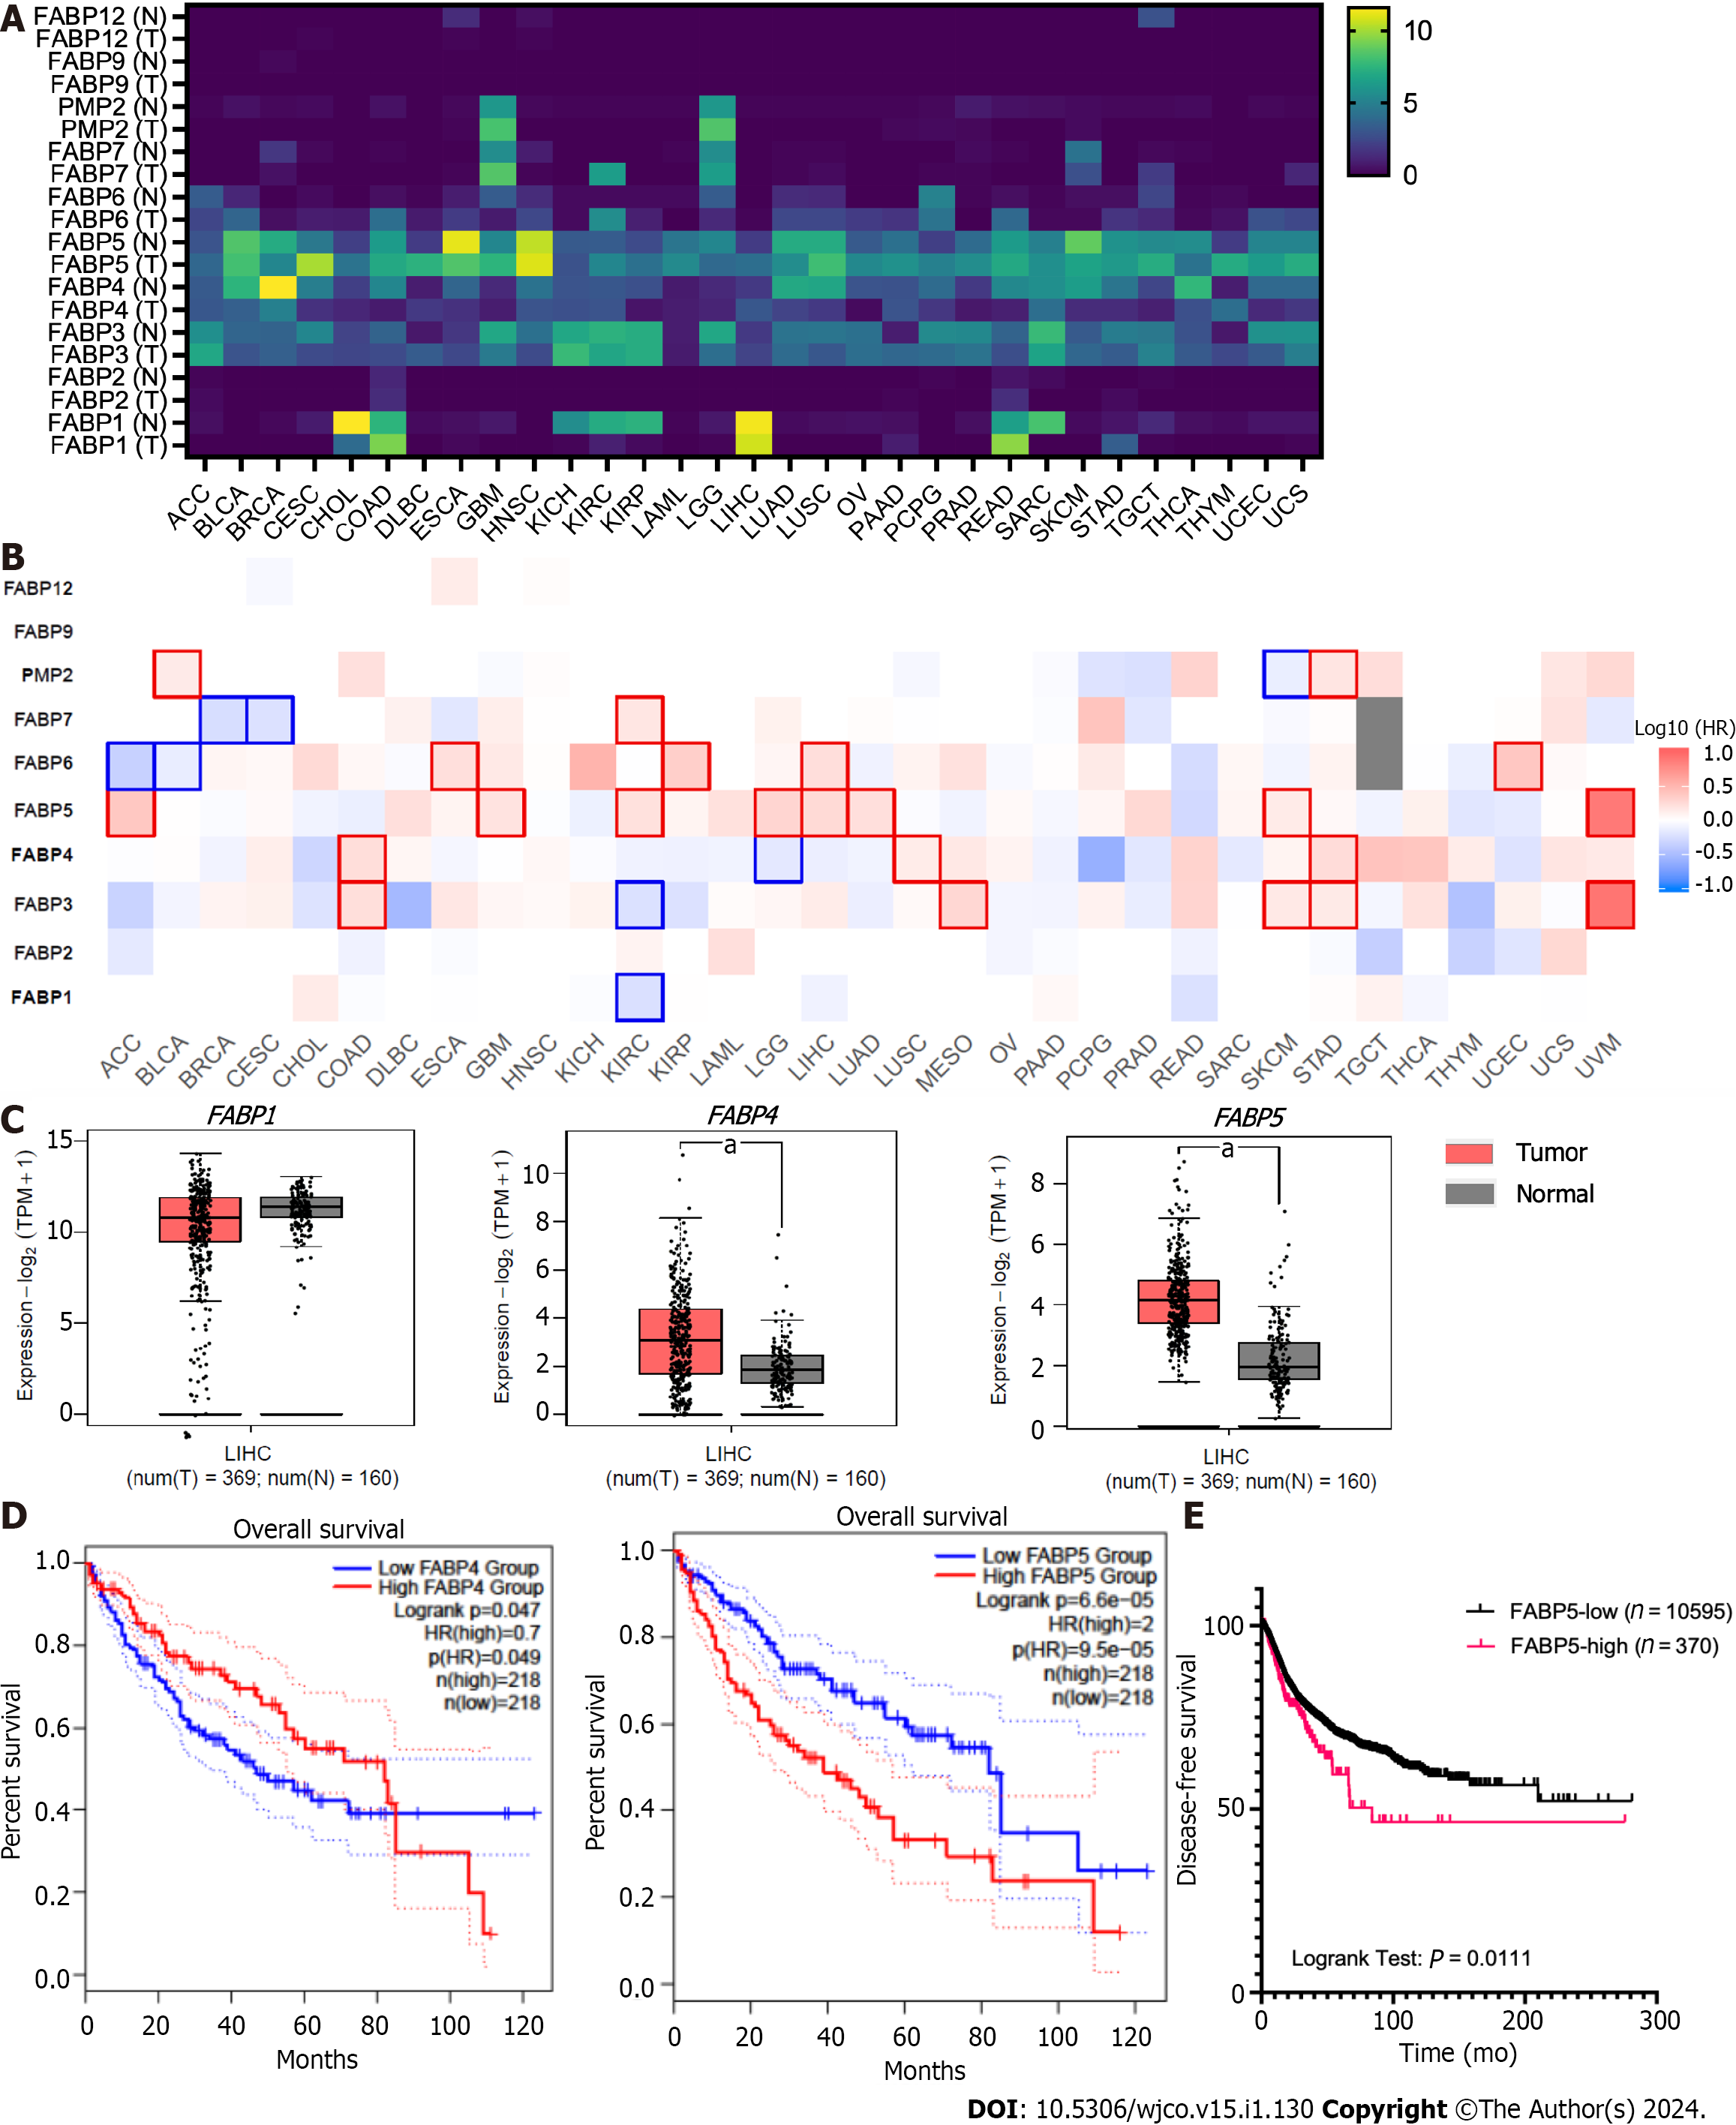
To find out whether amplification and resulting high expression of FABP family members has clinical significance in cancer, we compared their expression in tumor tissues and non-tumor controls for various cancer types (Figure 3A). Among all family members, FABP3, FABP4, and FABP5 are expressed ubiquitously across various cancer types (Figure 3A), while FABP1, FABP6, FABP7, and FABP8 are expressed selectively in restricted cancer types. In contrast, FABP2, FABP9, and FABP12 are expressed at extremely low levels, if any (Figure 3A). FABP1, FABP3, FABP4, and FABP5, but not other family members, are selectively expressed in LIHC patients (Figure 3A and Supplementary Figure 1A), while FABP3, FABP4 and FABP5 are also selectively expressed in PRAD patients (Figure 3A and Supple
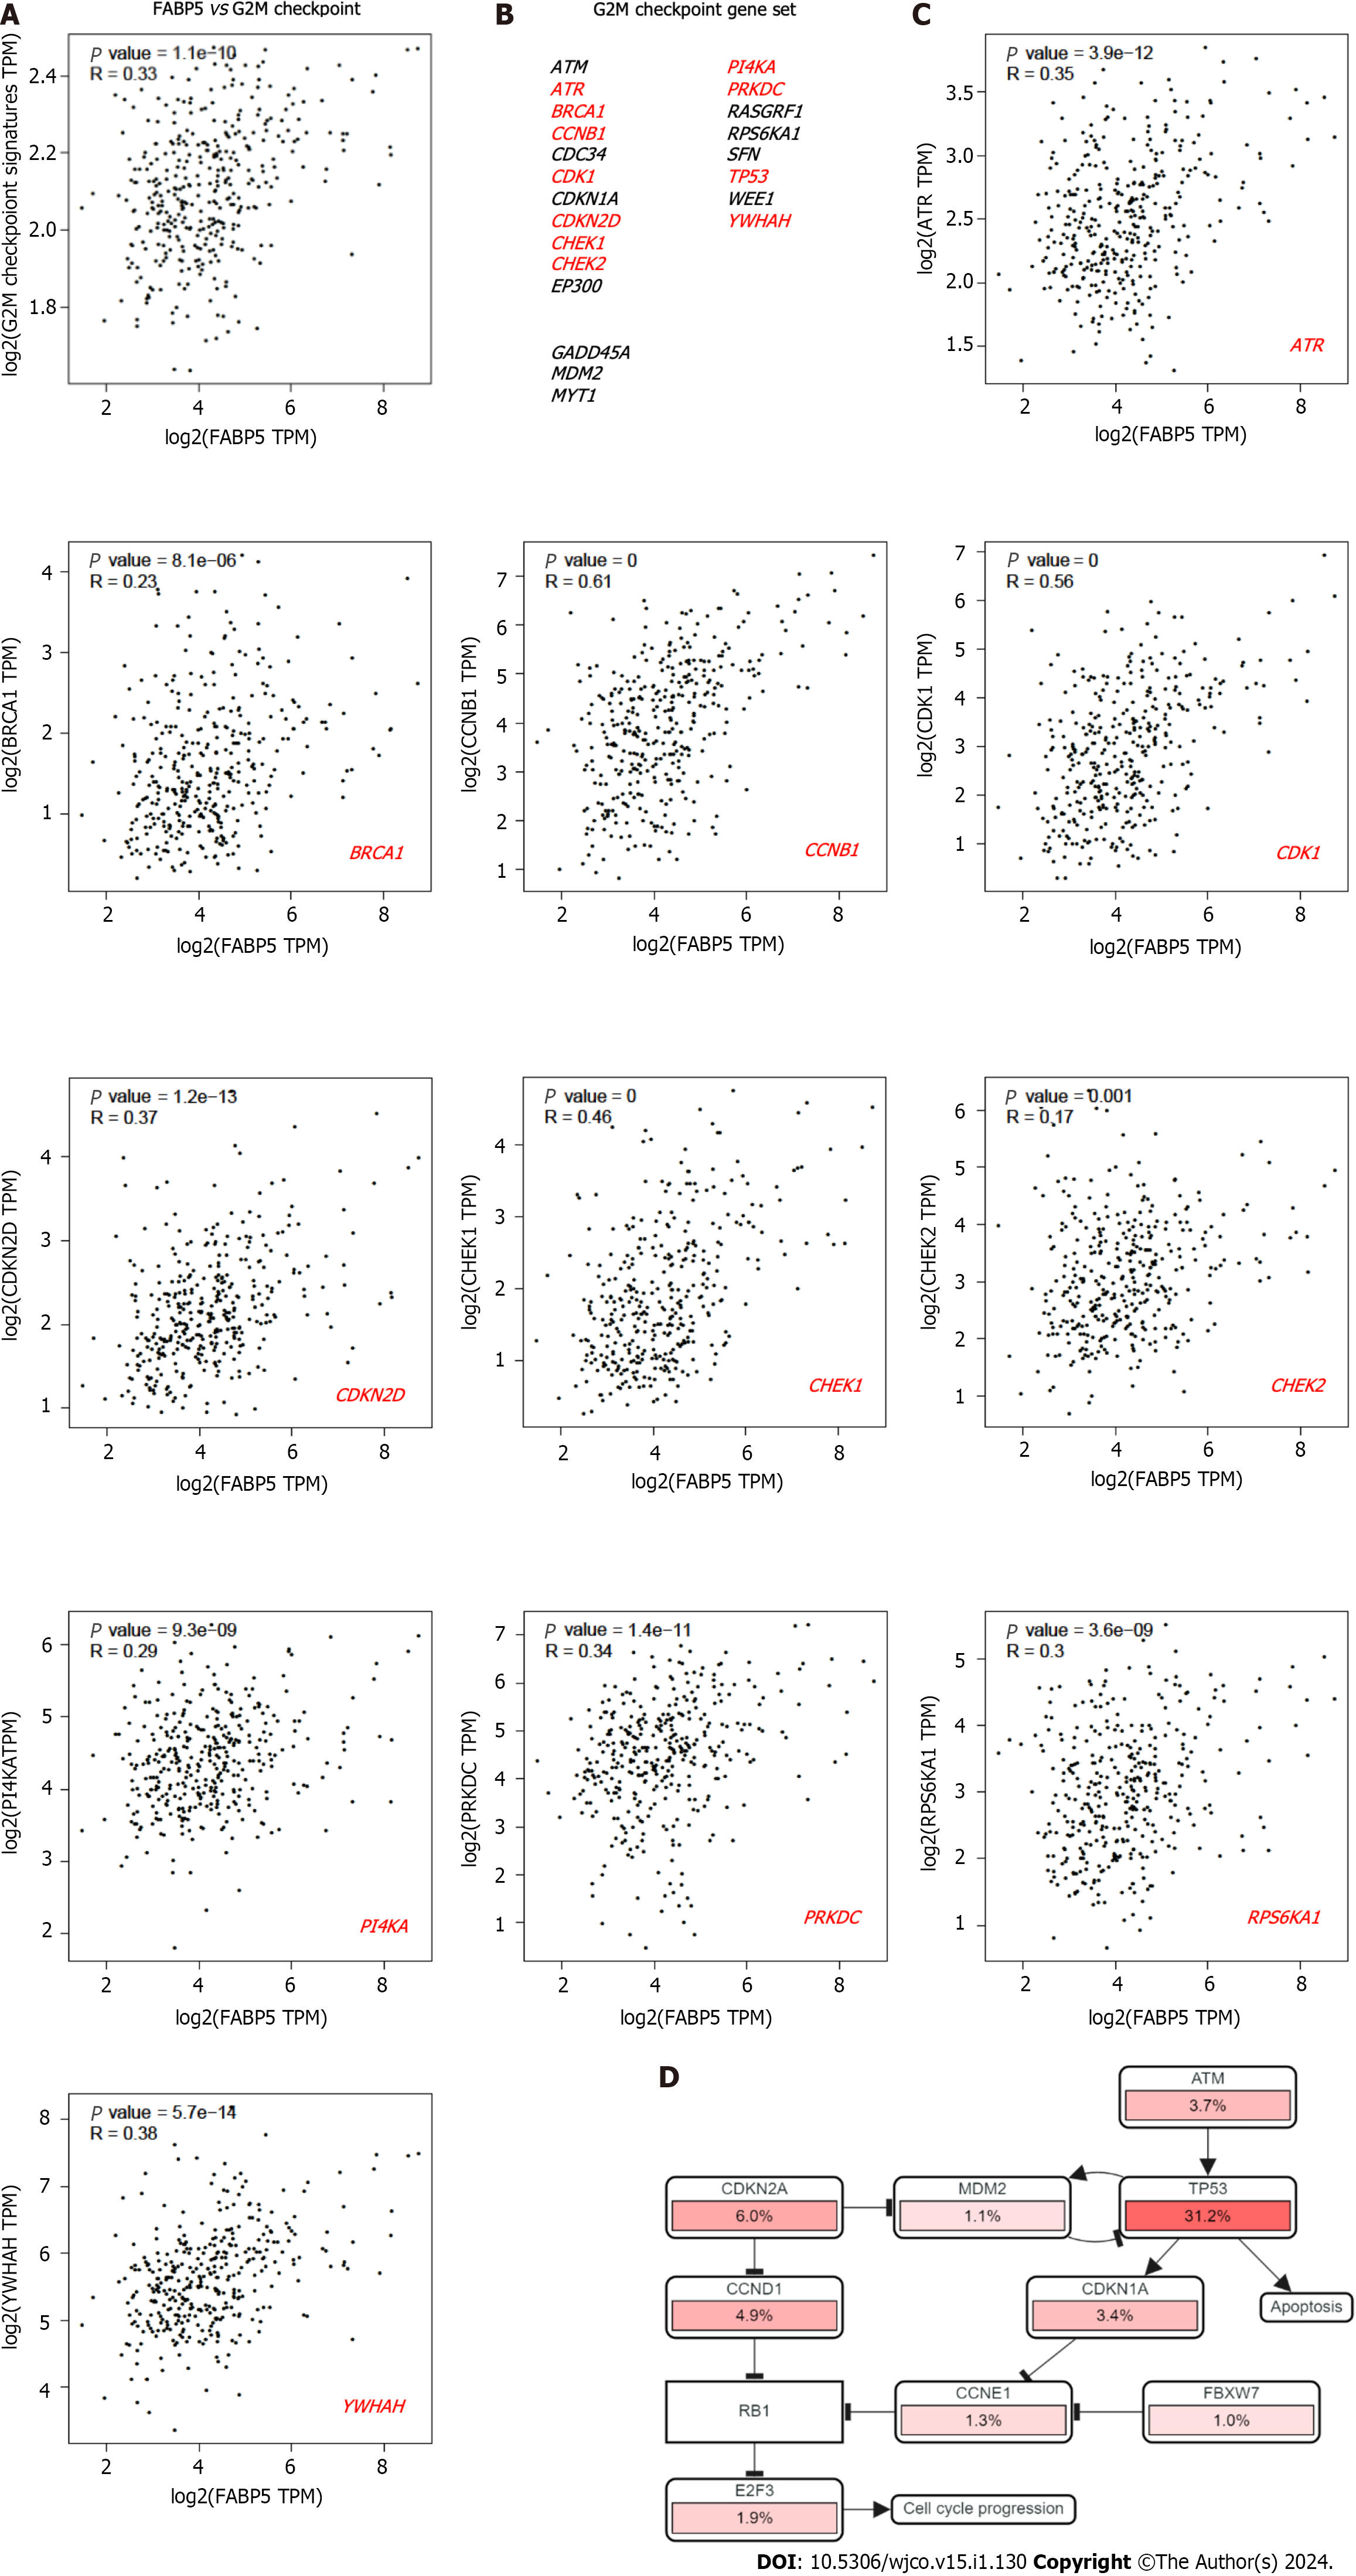
E2F targets, G2M checkpoint and DNA repair have been identified to be the top three cancer hallmarks enriched in HCC tumor cells compared to non-tumor controls[13], which supported that cell cycle and DNA repair signaling networks are critical for HCC cancer malignancies and progression. Therefore, we are interested in checking if FABP5 overexpression correlates with enrichment of these important cancer hallmarks in HCC. We found that FABP5 expression correlates well with G2M checkpoint gene signature (r = 0.33, P = 1.1e-10) (Figure 4A and B), and most of the genes in the dataset, including ATR (r = 0.35, P = 3.9e-12)[13], BRCA1 (r = 0.23, P = 8.1e-6), CCNB1 (r = 0.61, P = 0), CDK1 (r = 0.56, P = 0), CDKN2D (r = 0.37, P = 121e-13), CHEK1 (r = 0.46, P = 0), CHEK2 (r = 0.17, P = 0.001), PI4KA (r = 0.29, P = 9.3e-9), PRKDC
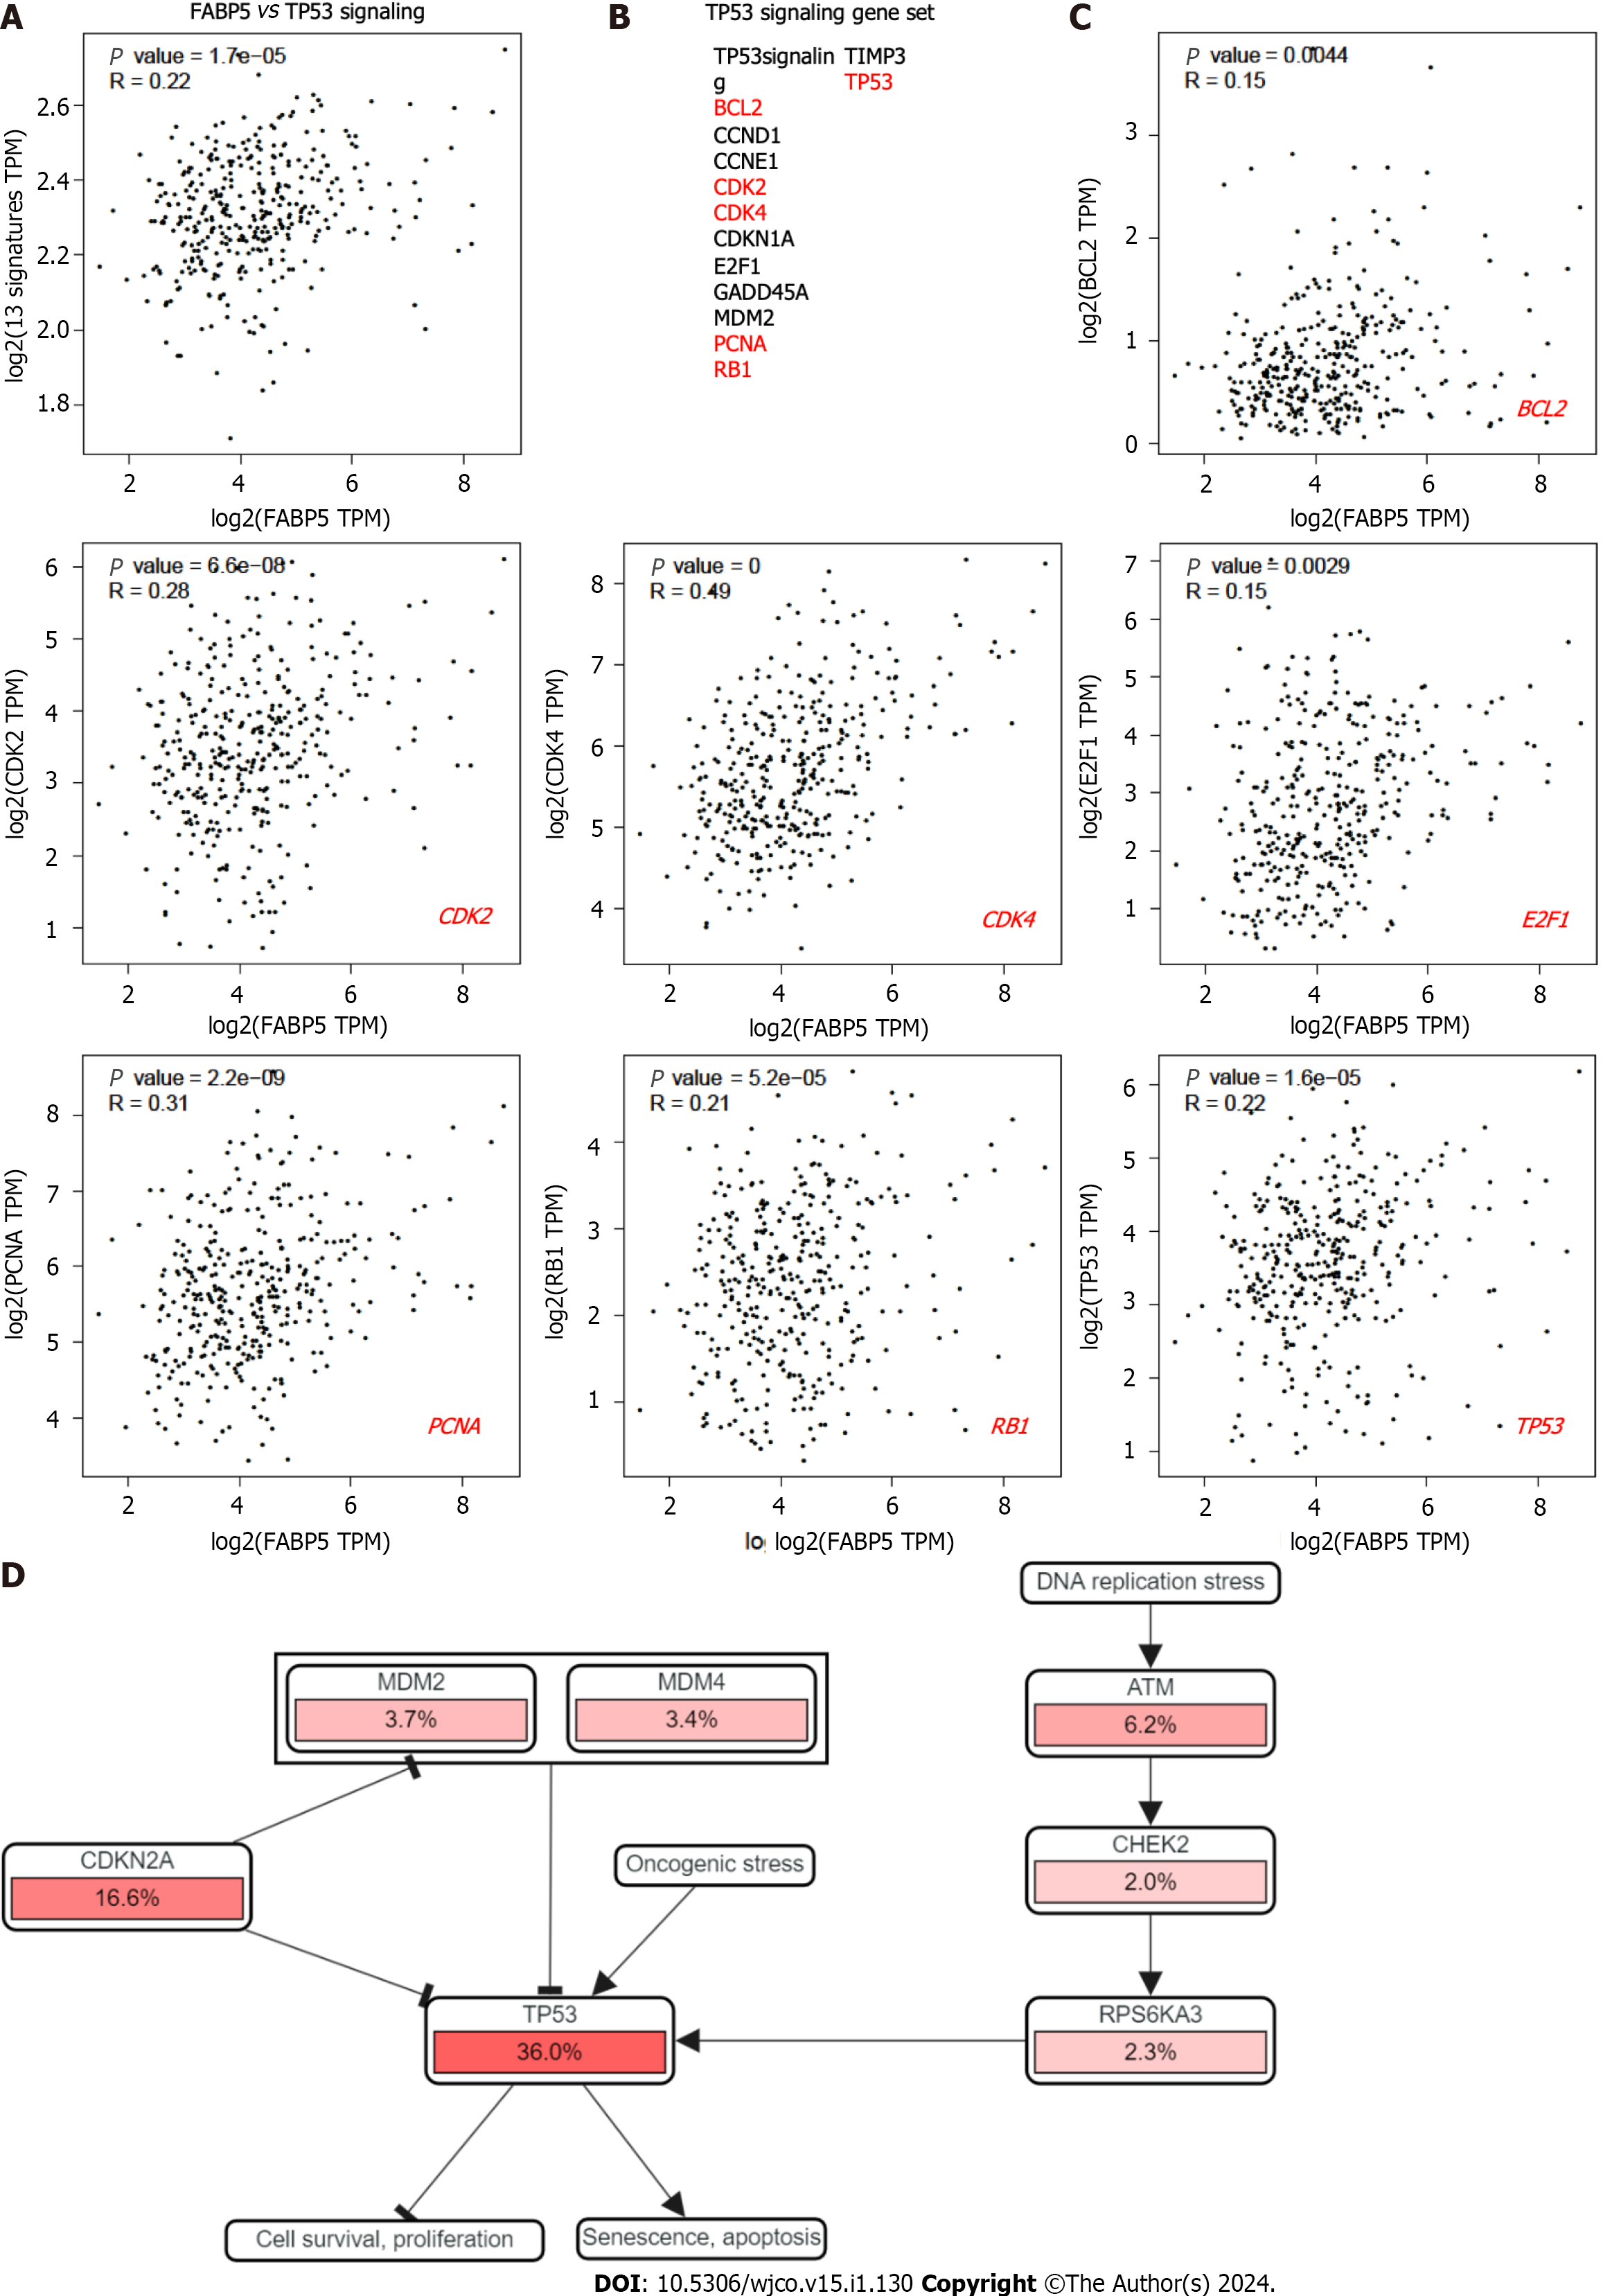
In an independent analysis using cBioportal platform, we found that most genes involved in cell cycle network are dysregulated with TP53 as the top gene (Figure 4D). Therefore, we checked if FABP5 expression is associated with expression of TP53 and p53 signaling gene signature. We found that FABP5 expression correlates well with TP53 expression (r = 0.22, P = 1.6e-5), its signaling gene signature (r = 0.33, P = 1.1e-10) (Figure 5A and B), and almost half of the genes in the dataset, including BCL2 (r = 0.15, P = 0.0044), CDK2 (r = 0.28, P = 6.6e-8), CDK4 (r = 0.49, P = 0), E2F1 (r = 0.15, P = 0029), PCNA (r = 0.31, P = 2.2e-9), and RB1 (r = 0.21, P = 5.2e-5) (Figure 5C). In an independent analysis using cBioportal platform, we found that most genes involved in TP53 signaling network are dysregulated with TP53 as the top gene (Figure 5D).
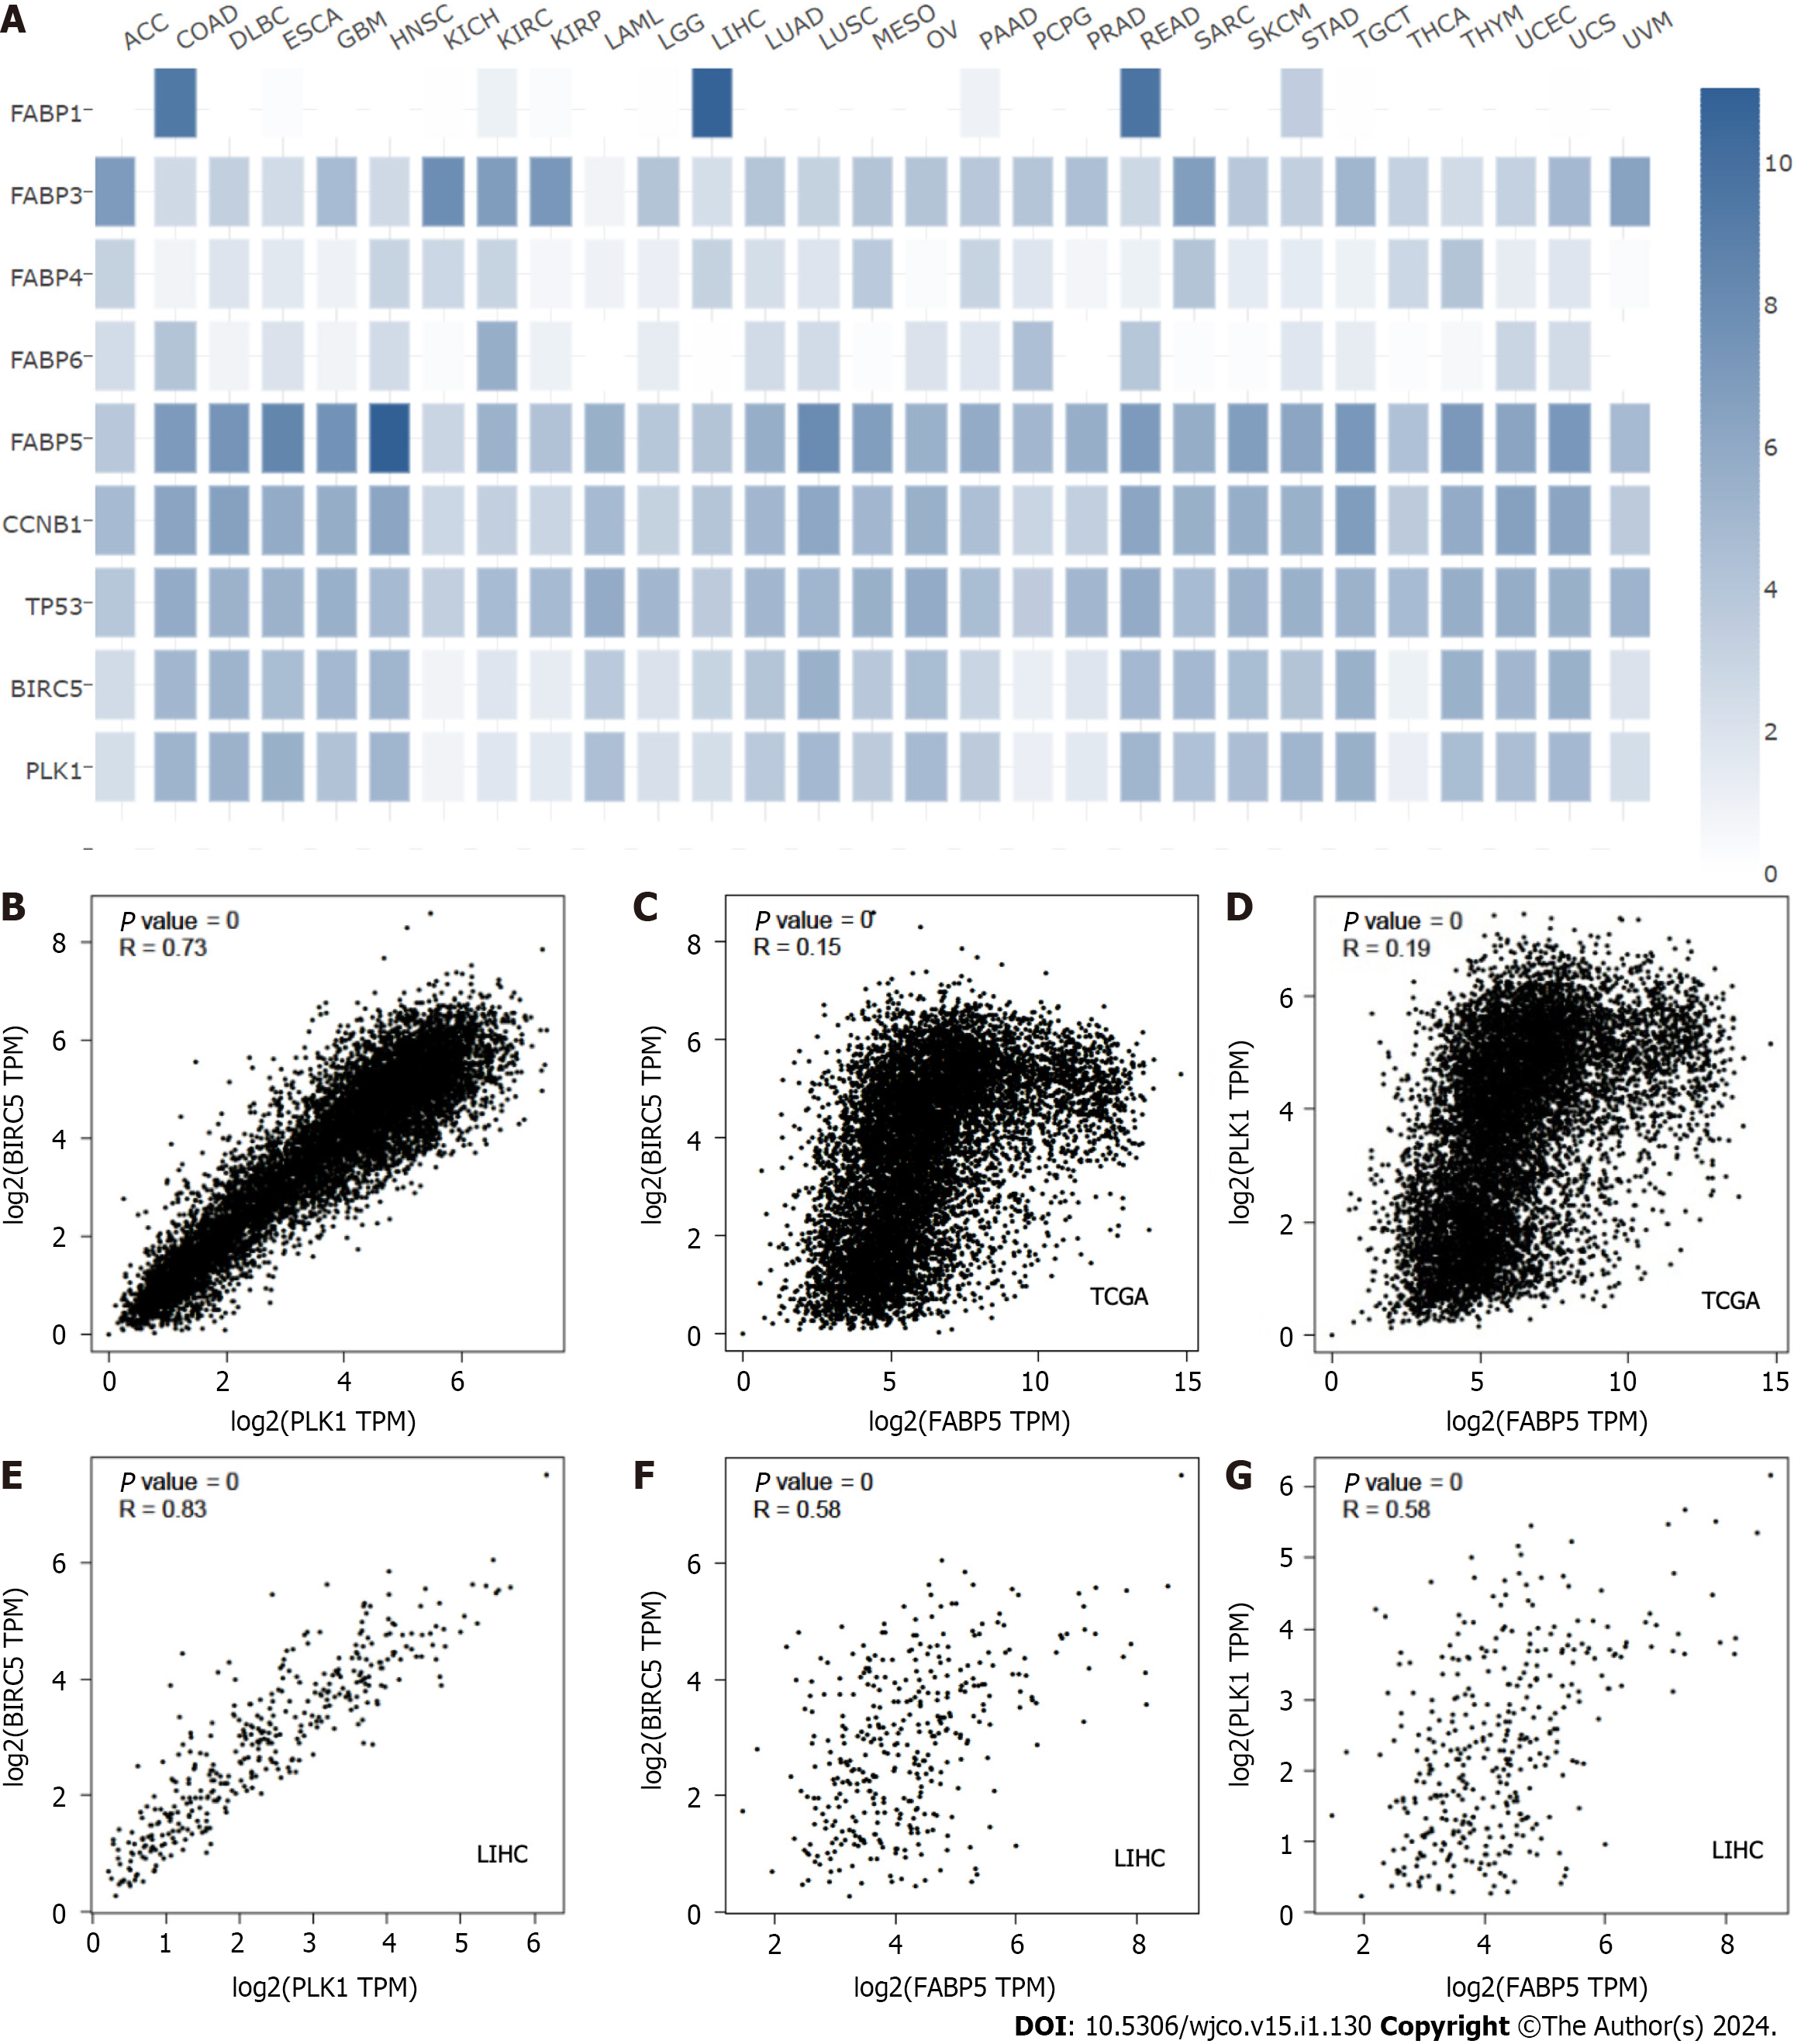
In our previous study, we demonstrated that that PLK1, a master regulator of cell cycle, and BIRC5, a multifunctional gene only expressed at G2M phase, are two important oncogenes that are highly co-expressed in HCC and the co-targeting of PLK1 and BIRC5 synergistically inhibited tumor growth of HCC preclinical models in vitro and in vivo[12]. To investigate the relationship between FABP5 expression and PLK1-BIRC5 co-expression in cancer, we first checked expression of selected FABPs together with CCNB1, TP53, BIRC5 and PLK1 (Figure 6A). Expression of FABP5, but not other FABPs including FABP1, FABP3, FABP4 and FABP6 appeared to be well-correlated with expression of PLK1 and BIRC5 across cancer types, in addition to CCNB1 and TP53 (Figure 6A). Consistent with our previous findings[12], expression of PLK1 and BIRC5 showed remarkable correlation in pan cancer (r = 0.73, P = 0) and even higher in LIHC (r = 0.83, P = 0) (Figure 6B and C). Expression of FABP5 also showed some correlation with PLK1 (r = 0.19, P = 0) or BIRC5 (r = 0.15, P = 0) in cancer and much better correlation in LIHC patient cohort (r = 0.58, P = 0; r = 0.58, P = 0, respectively) (Figure 6D-G and Supplementary Figure 3A and B). These data demonstrate that FABP5 is highly correlated to the expression of PLK1-BIRC5 co-expression, which is selectively in patients with HCC.
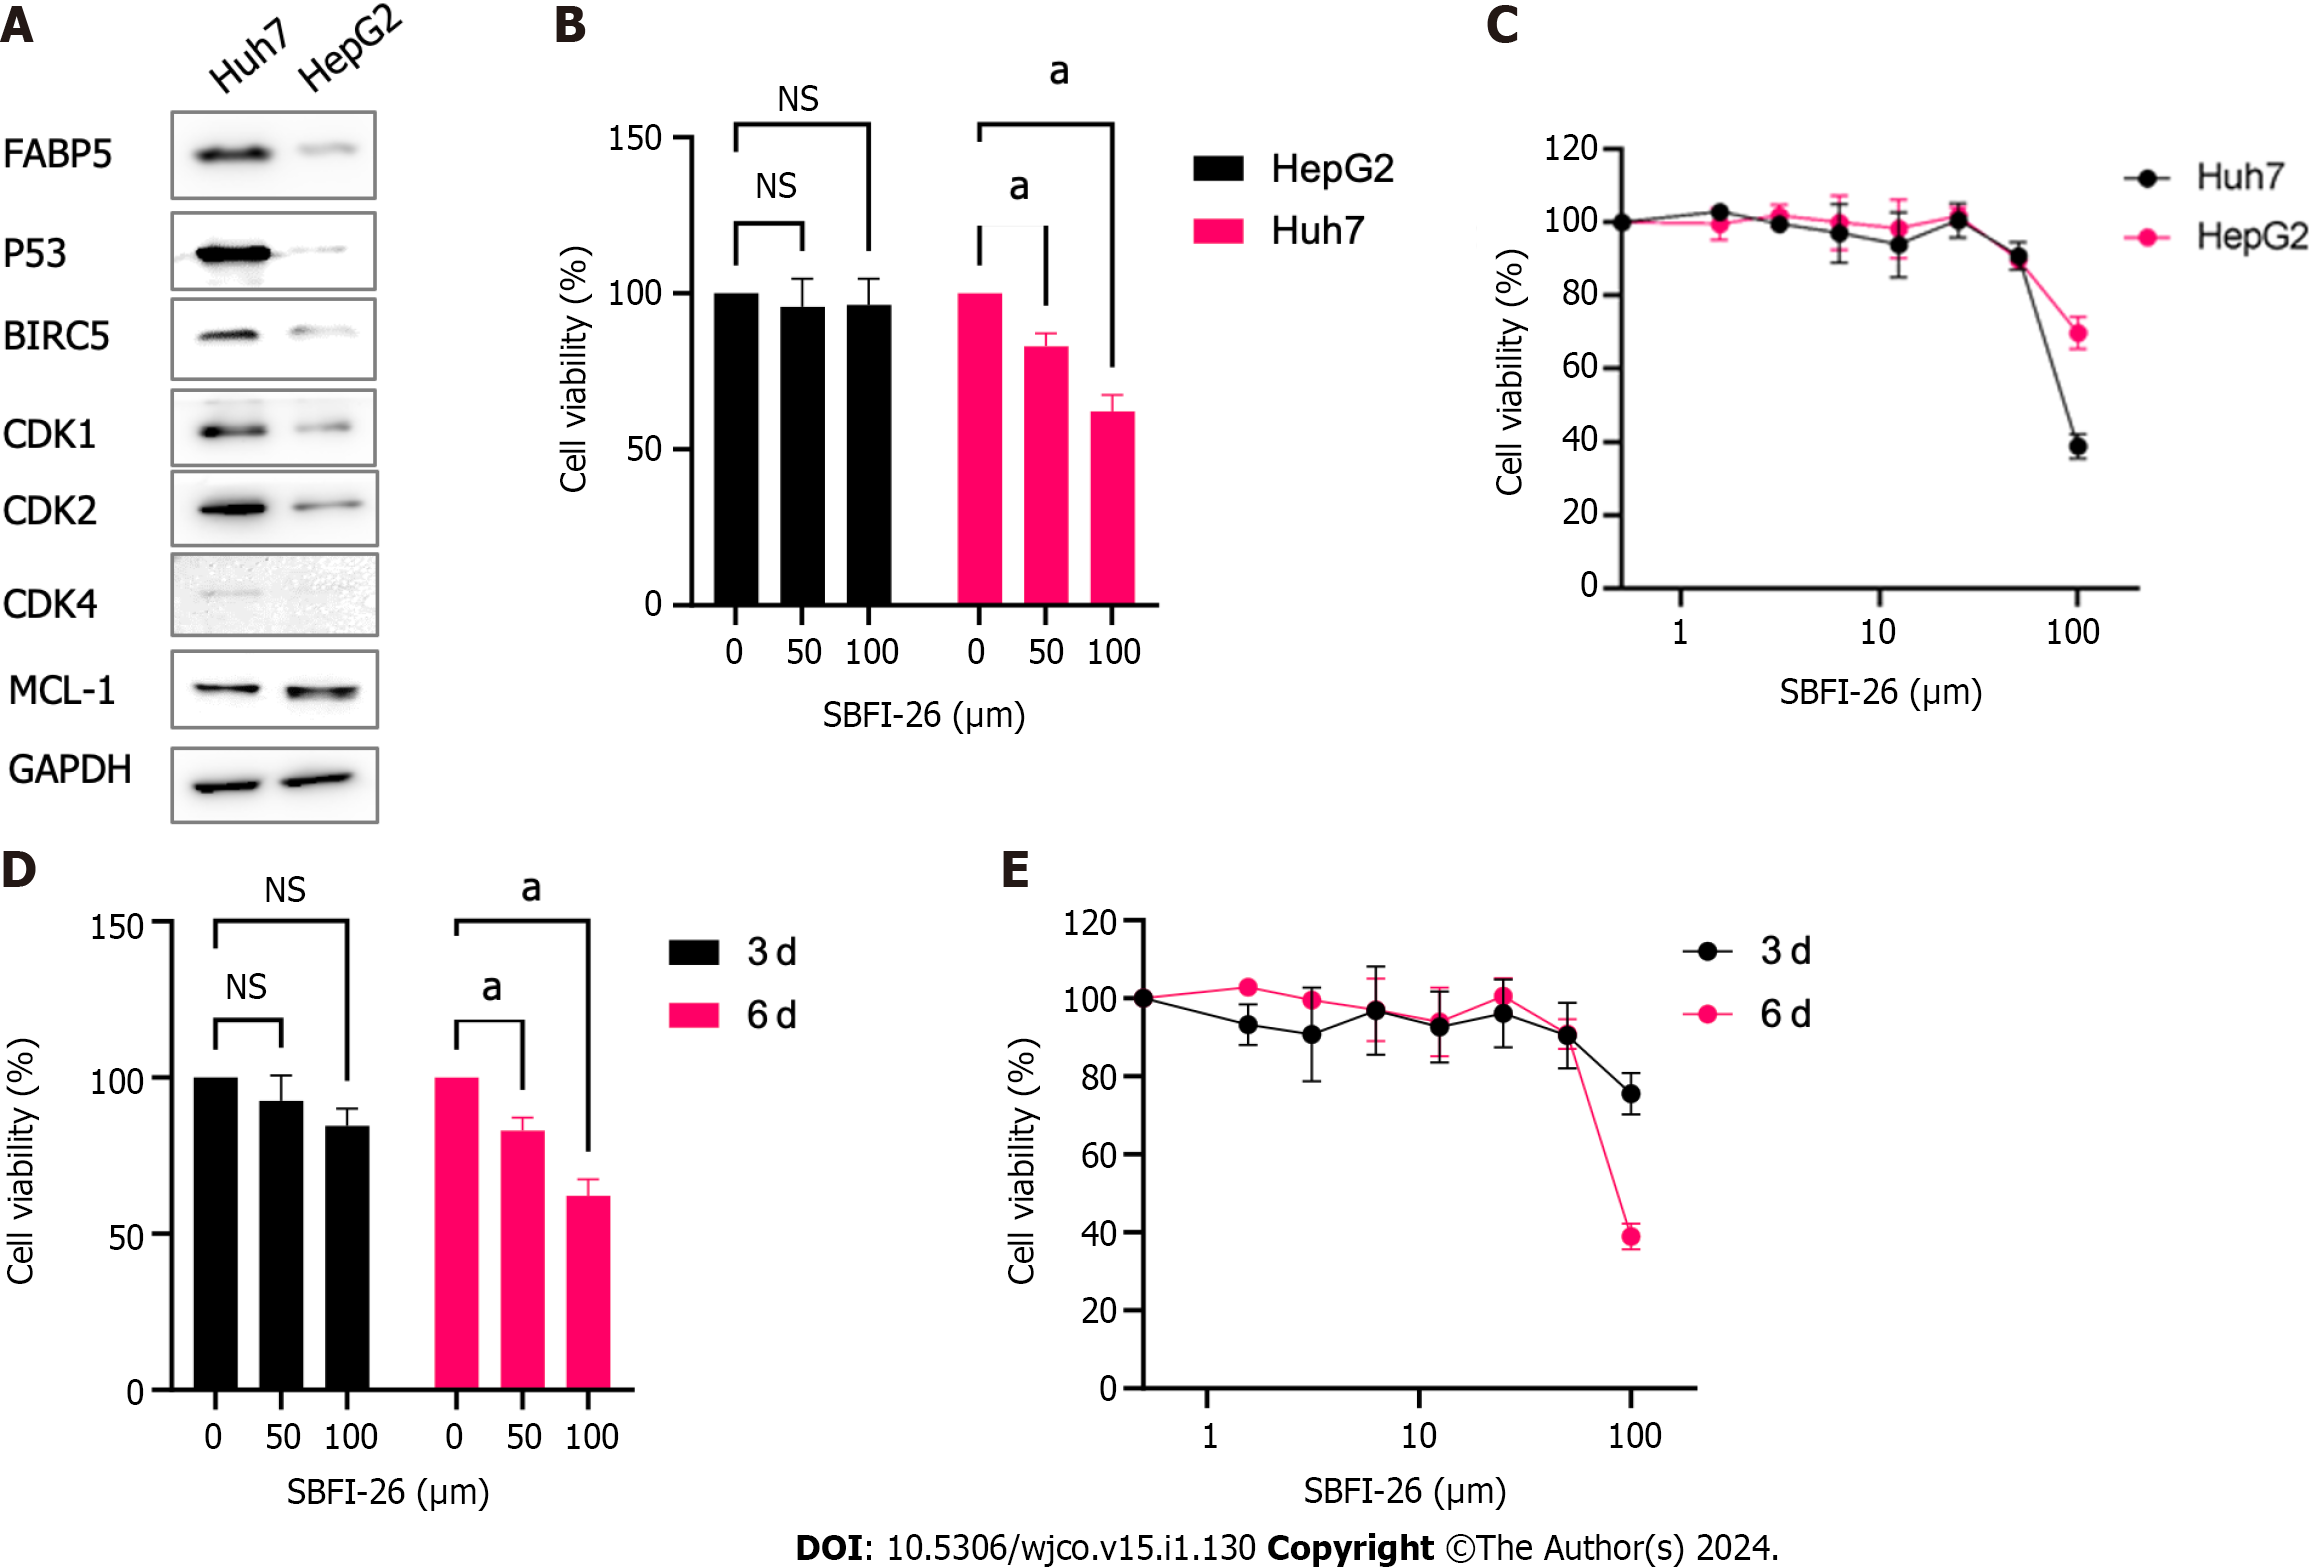
The stabilizing TP53 mutation Y220C in Huh7 cells resulted in overexpression of p53, which is much higher than that in HepG2 cells harboring wild type TP53 gene. Interestingly, FABP5 protein expression is also expressed at a much higher level in Huh7 cells than HepG2 cells (Figure 7A). BIRC5, CDK1, CDK2, and CDK4, but not MCL-1, are also expressed at much higher levels in FABP5high Huh7 cells than FABP5low HepG2 cells (Figure 7A). Huh7 cells are more sensitive to FABP5 inhibition by SBFI-26, a specific inhibitor of FABP5, than in HepG2 cells (IC50 = 89 and 145 µmol/L) at 6 d upon treatment (Figure 7B and C). Long treatment for 6 d led to further inhibition of cell viability of Huh7 cells than shorter treatment for 3 d (IC50 = 89 and 749 µmol/L, respectively) (Figure 7D and E). This demonstrated that like many other compounds targeting regulators of cellular mechanism, the anti-tumor effect of FABP5 inhibitor SBFI-26 is a slow process, which requires time to show the anti-tumor effect. Together, these data indicate that HCC cells with high FABP5 expression are sensitive to FABP5 inhibition.
In this study, we discovered the FABP5 gene is frequently amplified together with other adjacent family members FABP4, FABP8, FABP9 and FABP12 as a gene cluster. However, only FABP5 and FABP4 are highly expressed in HCC patients and are significantly upregulated in tumor cells compared to non-tumor controls. Compared to FABP4, FABP5 is expressed at higher levels in cancer including LIHC and more differentially expressed in tumor cells compared to non-tumor controls. Consistent with our data, Ohata et al[14] performed immunohistochemical staining of FABP5 for 243 paired HCC and adjacent non-tumor liver tissue samples. The study confirmed that all normal liver cells were stained negatively, while liver tumor cells can be divided into two groups, FABP5 positive (57.2%) and FABP5 negative (42.8%). Therefore, this data supports that FABP5 is overexpressed in 57.2% of patients with liver tumors. Our data of FABP5 expression in HepG2 and Huh7 cells is consistent with published data in this study as well. This study showed a positive correlation of high FABP5 expression with distant metastasis and invasion. However, Huh7 and HepG2 are both considered to be low metastatic. Our data showed that high expression of FABP5 mRNA correlated well with G2M checkpoint (P = 1.1e-10, r = 0.33) and TP53 signaling in liver cancer cells (P = 1.7e-5, r = 0.22) (Figures 4 and 5). We confirmed some of these gene expression differences involved in these two signaling networks including CDK1, CDK2, CDK4, and BIRC5 by western blotting in FABP5 low expressing HepG2 cells and FABP5-high expressing Huh7 cells (Figure 7A). The hotspot mutation Y220C of TP53 gene results in its decreased DNA binding and reduced p53 tumor suppressor function, leading to cancer progression[15-17]. This may explain that Huh7 cells carrying TP53 Y220C mutation grow much faster than hepG2 cells with wild type TP53 (cell doubling time, 24 and 48 h, respectively). Therefore, it is possible that the TP53 genetic status affects the cell proliferation and expression of FABP5, which requires further validation.
Furthermore, the correlation of FABP5 expression with poor patient survival is more significant than that of FABP4 expression. These data suggest FABP5 is the predominant gene across FABPs that are dysregulated in cancer, and it is the most important member that contributes significantly to cancer malignancy and progression, especially in patients with HCC. It is interesting to find out that high FABP5 expression correlates well with top cancer hallmarks and two oncogenes PLK1 and BIRC5 that were identified in HCC patients in our and other studies earlier[12,13]. These data strongly suggest that FABP5 is a novel therapeutic target for treating HCC and provides valuable insights for potential therapeutic development in treating patients with HCC.
Small molecule inhibitors targeting FABP proteins, especially FABP4, are currently under development by multiple efforts. Early preclinical data provide evidence that targeting FABP4 by BMS309403 is promising in treating cancer for multiple cancer disease models[2,7,18]. In this study, our data suggests that FABP5 is a novel therapeutic target in patients with HCC and other cancer types. FABP5 inhibitors such as SFBI-26 are emerging and demonstrate that targeting FABP5 is feasible and promising in treating cancer[13].
We found that the gene cluster with FABP4, FABP5, FABP8, FABP9, and FABP12 in adjacent loci in chromosome 8 are often co-amplified in many cancer types but with highest frequencies in PRAD and HCC. Amplification is the most common genetic alteration type for these FABPs. In contrast, other family members FABP1, FABP2, FABP3, FABP6 and FABP7 also showed expression in cancer, ubiquitously or selectively, but are not frequently altered at genetic level. Interestingly, not all co-amplified family members are expressed in cancer due to amplification. Only FABP4 and FABP5 are expressed across various cancer types, suggesting that genetic amplification itself is necessary but not sufficient for their abnormal expression in cancer. Expression of FABP4, as a major target of PPARγ[19], has been shown to be controlled by PPARγ[4], and FABP4 has been shown to negatively regulate PPARγ expression level, likely through a negative feedback signaling loop. In contrast to FABP4, FABP5 has been shown to facilitate fatty-acid induced PPARγ activation and downstream signaling, and activated PPARγ in turn upregulates FABP5 expression levels in prostate cancer[10]. Whether this is also the case in HCC requires further investigation. In this study, we discovered that FABP5 is the one with greatest changes in mRNA expression across family members in patients with LIHC comparing tumor with non-tumor tissues and its expression highly correlates with poor patient outcome and enriched cancer hallmarks involved in cell cycle progression.
Dysregulated cell metabolism and cell cycle progression are key interconnecting events for cancer malignancy and progression[20]. The top three cancer hallmarks previously reported in HCC patients are E2F targets, G2M checkpoint and DNA repair[13]. All these lead to dysregulated cell cycle progression. Interestingly, we discovered that FABP5 expression highly correlates with top cancer hallmarks enriched in LIHC patients (G2M checkpoint), which likely drive cancer cell survival and proliferation[13]. In our previous study, we demonstrated that two oncogenes, PLK1 and BIRC5, are highly co-expressed in HCC and co-targeting of PLK1 and BIRC5 synergistically inhibited tumor growth of HCC preclinical models in vitro and in vivo[12]. Both PLK1 and BIRC5 are master regulators in cell cycle, powerful in promoting cell cycle progression and inhibiting cell death[21,22]. In this study, we confirmed that PLK1 and BIRC5 are co-expressed in cancer including HCC. More interestingly, FABP5 expression correlates very well with expression of PLK1 and BIRC5 in multiple cancer types. The strong correlation of FABP5 with cell cycle hallmark and cell cycle master regulators suggests its critical role in contribution to cancer cell progression when overexpressed.
In addition to its upregulation and functions in tumor cells, FABP5 is also found to be dysregulated in multiple immune cell types and can serve as a novel immune-related prognostic marker and a target of immunotherapy[23]. FABP5 was reported to regulate mitochondrial integrity and functions as cell-intrinsic checkpoint for Treg suppressive function in tumor microenvironment[24]. However, how FABP5 is dysregulated and the underlying mechanism in anti-tumor immunity have not been fully understood and requires further investigation.
FABP5 is frequently amplified in HCC, leading to its abnormal expression. High FABP5 expression correlates well with worse patient outcome, enriched cancer hallmarks and oncogenes in HCC. Targeting FABP5 by SBFI-26 is more effective in FABP5-high expressing cells than FABP5-low expressing cells.
FABP5 amplification can serve as a prognosis biomarker for the prediction of patient outcome and as a novel therapeutic target for treating hepatocellular carcinoma (HCC) with FABP5 amplification.
FABP5 is frequently amplified in cancer, especially in HCC, which leads to its abnormal expression in HCC. High FABP5 expression correlates well with worse patient outcome, enriched cancer hallmarks and oncogenes in HCC. Targeting FABP5 by SBFI-26 is more effective in FABP5-high expressing cells (Huh7) than FABP5-low expressing cells (HepG2).
FABP4, FABP5, FABP8, FABP9 and FABP12 as a gene cluster is frequently amplified in cancer, which is the most common genetic alteration for FABPs. FABP5 is highly overexpressed in cancer and its expression correlates well with worse patient outcomes. FABP5 expression highly correlates with enrichment of G2M checkpoint, TP53 signaling pathway, and many genes in the gene sets such as CDK1, CDK4, and TP53. Furthermore, FABP5 also correlates well with two co-expressed oncogenes PLK1 and BIRC5 in liver hepatocellular carcinoma (LIHC) patients. FABP5-high expressing Huh7 cells also expressed higher protein levels of p53, BIRC5, CDK1, CDK2, and CDK4 than FABP5-low expressing HepG2 cells. Huh7 is more sensitive to FABP5 inhibition than HepG2 cells.
In this study, we accessed the public available portal of The Cancer Genome Atlas datasets of pan cancer and liver hepatocellular carcinoma LIHC by using cBioPortal and GEPIA2 portal. Based on mutation and CNA (copy number variation) datasets, we investigated genetic alterations of FABP family members in various cancer types. Based on mRNA datasets, we investigated FABP expression and their correlation with patient clinical outcome, enriched cancer hallmarks and oncogenes. For validation, we determined the protein levels of FABP5 and its correlated genes in Huh7 and HepG2 and evaluated the potential of targeting FABP5 in treating HCC.
The present study aimed to understand the genetic alterations and expression of FABP family members and their associated cancer hallmarks and oncogenes in contributing to cancer malignancies, especially HCC.
Several family members including FABP4, FABP5, and FABP7 are abnormally expressed in cancer cells beyond tissue expression restriction and play important roles in cancer malignancy and progression. However, the mechanism leading to their abnormal expression is not clear.
Reprogrammed lipid metabolism plays crucial roles in cell survival, growth, and evolution in many cancer types including HCC, an aggressive subtype of liver cancer. Fatty acid binding protein (FABP) family members including FABP5 play important roles in contribution to cancer progression and metastasis; however, how these FABP members, especially FABP5, are dysregulated in HCC and their contribution to HCC cancer progression have not been well defined.
We would like to thank the patients and their families who contributed to this research study. We also appreciate the availability of the TCGA dataset and the built-in analysis via the web-based bioinformatic platforms cBioportal and GEPIA2.
Provenance and peer review: Unsolicited article; Externally peer reviewed.
Peer-review model: Single blind
Specialty type: Gastroenterology and hepatology
Country/Territory of origin: China
Peer-review report’s scientific quality classification
Grade A (Excellent): 0
Grade B (Very good): 0
Grade C (Good): C
Grade D (Fair): 0
Grade E (Poor): 0
P-Reviewer: Banerjee S, India S-Editor: Liu JH L-Editor: Filipodia P-Editor: Zhang XD
| 1. | Koundouros N, Poulogiannis G. Reprogramming of fatty acid metabolism in cancer. Br J Cancer. 2020;122:4-22. [RCA] [PubMed] [DOI] [Full Text] [Full Text (PDF)] [Cited by in Crossref: 685] [Cited by in RCA: 1021] [Article Influence: 204.2] [Reference Citation Analysis (1)] |
| 2. | Sun N, Zhao X. Therapeutic Implications of FABP4 in Cancer: An Emerging Target to Tackle Cancer. Front Pharmacol. 2022;13:948610. [RCA] [PubMed] [DOI] [Full Text] [Full Text (PDF)] [Cited by in RCA: 24] [Reference Citation Analysis (0)] |
| 3. | Hotamisligil GS, Bernlohr DA. Metabolic functions of FABPs--mechanisms and therapeutic implications. Nat Rev Endocrinol. 2015;11:592-605. [RCA] [PubMed] [DOI] [Full Text] [Cited by in Crossref: 363] [Cited by in RCA: 492] [Article Influence: 49.2] [Reference Citation Analysis (0)] |
| 4. | Lei C, Fan B, Tian J, Li M, Li Y. PPARγ regulates fabp4 expression to increase DHA content in golden pompano (Trachinotus ovatus) hepatocytes. Br J Nutr. 2022;127:3-11. [RCA] [PubMed] [DOI] [Full Text] [Cited by in Crossref: 2] [Cited by in RCA: 7] [Article Influence: 1.8] [Reference Citation Analysis (0)] |
| 5. | Zeng J, Sauter ER, Li B. FABP4: A New Player in Obesity-Associated Breast Cancer. Trends Mol Med. 2020;26:437-440. [RCA] [PubMed] [DOI] [Full Text] [Cited by in Crossref: 21] [Cited by in RCA: 56] [Article Influence: 11.2] [Reference Citation Analysis (0)] |
| 6. | Mukherjee A, Chiang CY, Daifotis HA, Nieman KM, Fahrmann JF, Lastra RR, Romero IL, Fiehn O, Lengyel E. Adipocyte-Induced FABP4 Expression in Ovarian Cancer Cells Promotes Metastasis and Mediates Carboplatin Resistance. Cancer Res. 2020;80:1748-1761. [RCA] [PubMed] [DOI] [Full Text] [Cited by in Crossref: 118] [Cited by in RCA: 176] [Article Influence: 35.2] [Reference Citation Analysis (0)] |
| 7. | Tian W, Zhang W, Zhang Y, Zhu T, Hua Y, Li H, Zhang Q, Xia M. FABP4 promotes invasion and metastasis of colon cancer by regulating fatty acid transport. Cancer Cell Int. 2020;20:512. [RCA] [PubMed] [DOI] [Full Text] [Full Text (PDF)] [Cited by in Crossref: 27] [Cited by in RCA: 72] [Article Influence: 14.4] [Reference Citation Analysis (0)] |
| 8. | Dum D, Ocokoljic A, Lennartz M, Hube-Magg C, Reiswich V, Höflmayer D, Jacobsen F, Bernreuther C, Lebok P, Sauter G, Luebke AM, Burandt E, Marx AH, Simon R, Clauditz TS, Minner S, Menz A, Büscheck F, Gorbokon N, Steurer S, Blessin NC, Krech T. FABP1 expression in human tumors: a tissue microarray study on 17,071 tumors. Virchows Arch. 2022;481:945-961. [RCA] [PubMed] [DOI] [Full Text] [Cited by in RCA: 13] [Reference Citation Analysis (0)] |
| 9. | Xu B, Chen L, Zhan Y, Marquez KNS, Zhuo L, Qi S, Zhu J, He Y, Chen X, Zhang H, Shen Y, Chen G, Gu J, Guo Y, Liu S, Xie T. The Biological Functions and Regulatory Mechanisms of Fatty Acid Binding Protein 5 in Various Diseases. Front Cell Dev Biol. 2022;10:857919. [RCA] [PubMed] [DOI] [Full Text] [Full Text (PDF)] [Cited by in Crossref: 32] [Cited by in RCA: 39] [Article Influence: 13.0] [Reference Citation Analysis (0)] |
| 10. | O'Sullivan SE, Kaczocha M. FABP5 as a novel molecular target in prostate cancer. Drug Discov Today. 2020;. [RCA] [PubMed] [DOI] [Full Text] [Cited by in Crossref: 37] [Cited by in RCA: 44] [Article Influence: 8.8] [Reference Citation Analysis (0)] |
| 11. | Tang Z, Kang B, Li C, Chen T, Zhang Z. GEPIA2: an enhanced web server for large-scale expression profiling and interactive analysis. Nucleic Acids Res. 2019;47:W556-W560. [RCA] [PubMed] [DOI] [Full Text] [Full Text (PDF)] [Cited by in Crossref: 1991] [Cited by in RCA: 3078] [Article Influence: 513.0] [Reference Citation Analysis (0)] |
| 12. | Li Y, Zhao ZG, Luo Y, Cui H, Wang HY, Jia YF, Gao YT. Dual targeting of Polo-like kinase 1 and baculoviral inhibitor of apoptosis repeat-containing 5 in TP53-mutated hepatocellular carcinoma. World J Gastroenterol. 2020;26:4786-4801. [RCA] [PubMed] [DOI] [Full Text] [Full Text (PDF)] [Cited by in CrossRef: 9] [Cited by in RCA: 11] [Article Influence: 2.2] [Reference Citation Analysis (0)] |
| 13. | Zhu W, Zhang Q, Liu M, Yan M, Chu X, Li Y. Identification of DNA repair-related genes predicting pathogenesis and prognosis for liver cancer. Cancer Cell Int. 2021;21:81. [RCA] [PubMed] [DOI] [Full Text] [Full Text (PDF)] [Cited by in Crossref: 8] [Cited by in RCA: 21] [Article Influence: 5.3] [Reference Citation Analysis (0)] |
| 14. | Ohata T, Yokoo H, Kamiyama T, Fukai M, Aiyama T, Hatanaka Y, Hatanaka K, Wakayama K, Orimo T, Kakisaka T, Kobayashi N, Matsuno Y, Taketomi A. Fatty acid-binding protein 5 function in hepatocellular carcinoma through induction of epithelial-mesenchymal transition. Cancer Med. 2017;6:1049-1061. [RCA] [PubMed] [DOI] [Full Text] [Full Text (PDF)] [Cited by in Crossref: 60] [Cited by in RCA: 61] [Article Influence: 7.6] [Reference Citation Analysis (0)] |
| 15. | Boettcher S, Miller PG, Sharma R, McConkey M, Leventhal M, Krivtsov AV, Giacomelli AO, Wong W, Kim J, Chao S, Kurppa KJ, Yang X, Milenkowic K, Piccioni F, Root DE, Rücker FG, Flamand Y, Neuberg D, Lindsley RC, Jänne PA, Hahn WC, Jacks T, Döhner H, Armstrong SA, Ebert BL. A dominant-negative effect drives selection of TP53 missense mutations in myeloid malignancies. Science. 2019;365:599-604. [RCA] [PubMed] [DOI] [Full Text] [Cited by in Crossref: 158] [Cited by in RCA: 312] [Article Influence: 62.4] [Reference Citation Analysis (0)] |
| 16. | Dearth LR, Qian H, Wang T, Baroni TE, Zeng J, Chen SW, Yi SY, Brachmann RK. Inactive full-length p53 mutants lacking dominant wild-type p53 inhibition highlight loss of heterozygosity as an important aspect of p53 status in human cancers. Carcinogenesis. 2007;28:289-298. [RCA] [PubMed] [DOI] [Full Text] [Cited by in Crossref: 93] [Cited by in RCA: 108] [Article Influence: 5.7] [Reference Citation Analysis (0)] |
| 17. | Liu X, Wilcken R, Joerger AC, Chuckowree IS, Amin J, Spencer J, Fersht AR. Small molecule induced reactivation of mutant p53 in cancer cells. Nucleic Acids Res. 2013;41:6034-6044. [RCA] [PubMed] [DOI] [Full Text] [Full Text (PDF)] [Cited by in Crossref: 147] [Cited by in RCA: 191] [Article Influence: 15.9] [Reference Citation Analysis (0)] |
| 18. | Farrell M, Fairfield H, Karam M, D'Amico A, Murphy CS, Falank C, Pistofidi RS, Cao A, Marinac CR, Dragon JA, McGuinness L, Gartner CG, Iorio RD, Jachimowicz E, DeMambro V, Vary C, Reagan MR. Targeting the fatty acid binding proteins disrupts multiple myeloma cell cycle progression and MYC signaling. Elife. 2023;12. [RCA] [PubMed] [DOI] [Full Text] [Cited by in Crossref: 11] [Cited by in RCA: 23] [Article Influence: 11.5] [Reference Citation Analysis (0)] |
| 19. | Tontonoz P, Graves RA, Budavari AI, Erdjument-Bromage H, Lui M, Hu E, Tempst P, Spiegelman BM. Adipocyte-specific transcription factor ARF6 is a heterodimeric complex of two nuclear hormone receptors, PPAR gamma and RXR alpha. Nucleic Acids Res. 1994;22:5628-5634. [RCA] [PubMed] [DOI] [Full Text] [Cited by in Crossref: 296] [Cited by in RCA: 298] [Article Influence: 9.6] [Reference Citation Analysis (0)] |
| 20. | Icard P, Fournel L, Wu Z, Alifano M, Lincet H. Interconnection between Metabolism and Cell Cycle in Cancer. Trends Biochem Sci. 2019;44:490-501. [RCA] [PubMed] [DOI] [Full Text] [Cited by in Crossref: 116] [Cited by in RCA: 213] [Article Influence: 35.5] [Reference Citation Analysis (0)] |
| 21. | Chiappa M, Petrella S, Damia G, Broggini M, Guffanti F, Ricci F. Present and Future Perspective on PLK1 Inhibition in Cancer Treatment. Front Oncol. 2022;12:903016. [RCA] [PubMed] [DOI] [Full Text] [Full Text (PDF)] [Cited by in Crossref: 52] [Cited by in RCA: 78] [Article Influence: 26.0] [Reference Citation Analysis (0)] |
| 22. | Wheatley SP, Altieri DC. Survivin at a glance. J Cell Sci. 2019;132. [RCA] [PubMed] [DOI] [Full Text] [Cited by in Crossref: 145] [Cited by in RCA: 252] [Article Influence: 42.0] [Reference Citation Analysis (0)] |
| 23. | Jia H, Zhang X, Liu X, Qiao R, Liu Y, Lv S, Zhu H, Wang J, Kong Q, Zhang H, Zhang Z. FABP5, a Novel Immune-Related mRNA Prognostic Marker and a Target of Immunotherapy for Multiple Myeloma. Front Med (Lausanne). 2021;8:667525. [RCA] [PubMed] [DOI] [Full Text] [Full Text (PDF)] [Cited by in Crossref: 2] [Cited by in RCA: 2] [Article Influence: 0.5] [Reference Citation Analysis (0)] |
| 24. | Field CS, Baixauli F, Kyle RL, Puleston DJ, Cameron AM, Sanin DE, Hippen KL, Loschi M, Thangavelu G, Corrado M, Edwards-Hicks J, Grzes KM, Pearce EJ, Blazar BR, Pearce EL. Mitochondrial Integrity Regulated by Lipid Metabolism Is a Cell-Intrinsic Checkpoint for Treg Suppressive Function. Cell Metab. 2020;31:422-437.e5. [RCA] [PubMed] [DOI] [Full Text] [Full Text (PDF)] [Cited by in Crossref: 316] [Cited by in RCA: 286] [Article Influence: 57.2] [Reference Citation Analysis (0)] |


