Copyright
©The Author(s) 2017.
World J Clin Oncol. Aug 10, 2017; 8(4): 305-319
Published online Aug 10, 2017. doi: 10.5306/wjco.v8.i4.305
Published online Aug 10, 2017. doi: 10.5306/wjco.v8.i4.305
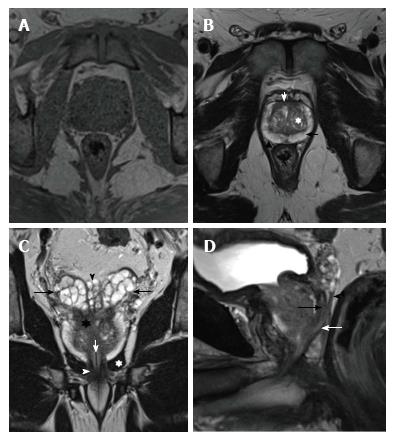
Figure 1 Normal prostate anatomy on magnetic resonance imaging - T1 and T2-weighted images.
A: T1-weighted axial image of a normal prostate: Homogeneous gland, isointense to the adjacent pelvic muscles. It is not possible to differentiate any anatomical detail; B: Axial image of the prostate shows peripheral zone (PZ - black arrow) as a hyperintense area with a U-shape. The transitional zone (TZ - white asterisk) has a hypointense multinodular pattern (“organized chaos”). Anterior fibromuscular stroma (white arrow) is seen as a hypointense area anterior to the TZ and medial to both anterior PZ horns. The “capsule” (arrowhead) is seen as a hypointense rim surrounding the gland; C: Coronal image shows the hyperintense seminal vesicles located cephalad to the base of the prostate (black arrows). Ampulla of vas deferens (VD - black arrowhead) can be seen as paired structures medial to both seminal vesicles (SV). Prostate central zone (asterisk) is seen as a hypointense area located in the base of the prostate gland. Urethra (white arrow), levator ani muscle (white asterisk) and external sphincter (white arrowhead) are also shown; D: Sagittal image shows the vas deferens (black arrow), seminal vesicles (arrowhead) and the ejaculatory duct (white arrow).
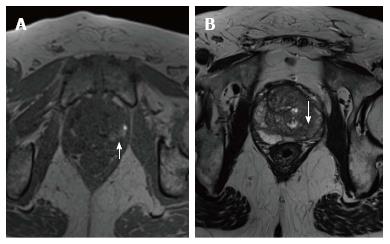
Figure 2 T1 (A) and T2-weighted images (B) of the midgland of the prostate.
The left peripheral zone has a hyperintense area (white arrow, A) in T1-weighted image that correlates with a hypointensity (white arrow in B) in T2-weighted image, suggestive of bleeding in a patient with a recent transrectal ultrasound prostate biopsy.
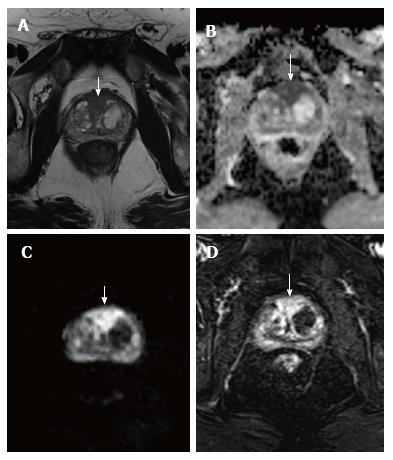
Figure 3 A 71-year-old patient.
A: T2-weighted axial image at the level of the midgland of the prostate shows a hypointense nodular lesion at the transitional zone/anterior fibromuscular stroma, with a diameter of 26 mm (arrow); B and C: ADC map (B) and DWI image (C) show a marked hypo- and hyperintensity, respectively, in relation to restriction of diffusion (white arrows); D: DCE image with significant enhancement of the lesion (arrow). The characteristics of the nodule are compatible with a PIRADS 5 lesion and the marked restriction of the diffusion suggests a high-grade clinically significant prostate carcinoma, confirmed by the results of a MRI-guided transrectal ultrasound prostate biopsy (Gleason 4 + 4).
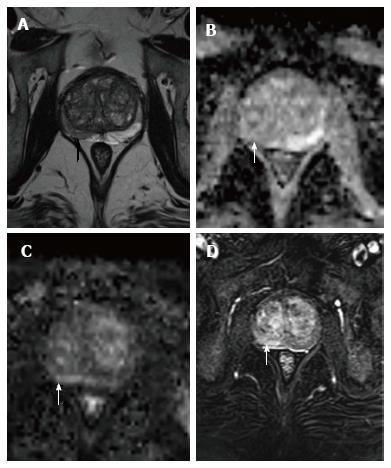
Figure 4 Prostate magnetic resonance imaging of a 64-year-old patient.
A: T2-weighted image shows an area of hypointensity in the right peripheral zone of the midgland of the prostate (black arrow); B: A discrete restriction of diffusion in ADC map (white arrow); C: DWI image (white arrow); D: Enhancement on DCE image (white arrow), suggestive of prostatitis, confirmed by transrectal ultrasound biopsy.
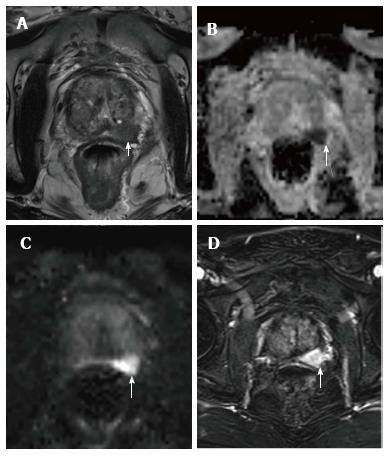
Figure 5 An 82-year-old patient with PIRADS 5 lesion in the basal left peripheral zone showing hypointensity (white arrows) in T2-weighted image (A), restriction of diffusion in apparent diffusion coefficient map (B) and diffusion-weighted magnetic resonance image (C), DCE shows significant early enhancement of the suspicious area (D).
MRI-guided transrectal ultrasound biopsy confirmed a clinically significant prostatic carcinoma (Gleason 5 + 4). DCE: Dynamic contrast enhancement; MRI: Magnetic resonance imaging.
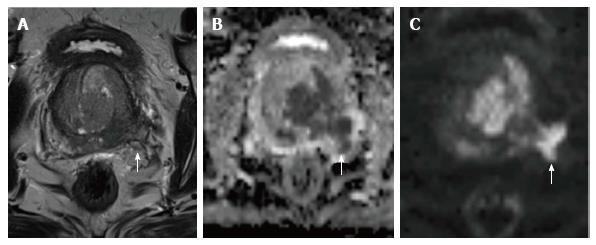
Figure 6 Prostate carcinoma with extracapsular extension in a 72-year-old patient.
A: T2-weighted axial image of the pelvis at the level of midgland of the prostate shows a marked hypointensity in the left peripheral zone and disruption of the “capsule”, distorting the normal anatomy of the left neurovascular bundle with measurable extracapsular extension (ESUR Score 5); B and C: ADC map (B) and DWI-images (C) demonstrate a significant restriction of diffusion, with hypointensity in the ADC and hyperintensity in the DWI-images that extend beyond the prostate “capsule” (arrows). Surgical specimen confirmed a pT3a prostate carcinoma. ADC: Apparent diffusion coefficient; DWI: Diffusion-weighted magnetic resonance imaging.
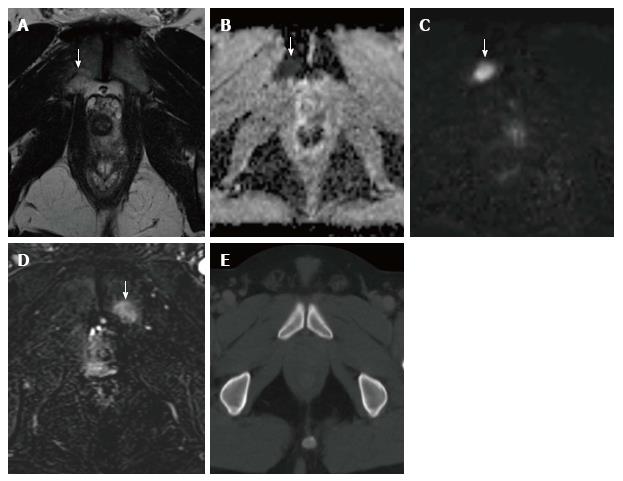
Figure 7 A 54-year-old patient with recently diagnosed prostate carcinoma.
A: T2-weighted axial image of the pelvis shows an ill-defined hyperintense area in the right pubis (arrow); B and C: ADC map (B) and DWI images (C) show restriction of diffusion in the same area (arrow); D: DCE image presents enhancement of the lesion after IV gadolinium (arrow). MRI findings were suspicious for pelvic bone metastasis, with no evidence of such lesion on staging abdomino-pelvic CT scan performed a week earlier (E) and in a previous bone scintigraphy (not shown). Bone metastasis was confirmed on clinical evolution. MRI: Magnetic resonance imaging; DCE: Dynamic contrast-enhanced; CT: Computed tomography.
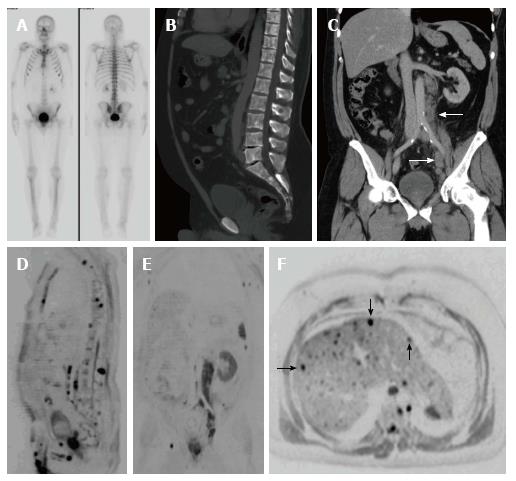
Figure 8 A 51-year-old patient with a history of Gleason 4 + 5 prostate carcinoma treated with hormone therapy.
A: Re-staging bone scintigraphy was negative for bone metastases; B and C: Sagittal (B) and coronal (C) images of abdominal CT scan show a diffuse axial bone altered density that could not rule out bone metastases, along with multiple retroperitoneal and pelvic enlarged nodes suggesting malignant adenopathies (white arrows in C); D and E: Sagittal (D) and coronal (E) whole-body MRI images clearly show multiple bone metastases and adenopathies, along with hepatic nodules (black arrows in F, axial abdominal MRI) suspicious for metastatic disease. MRI: Magnetic resonance imaging.
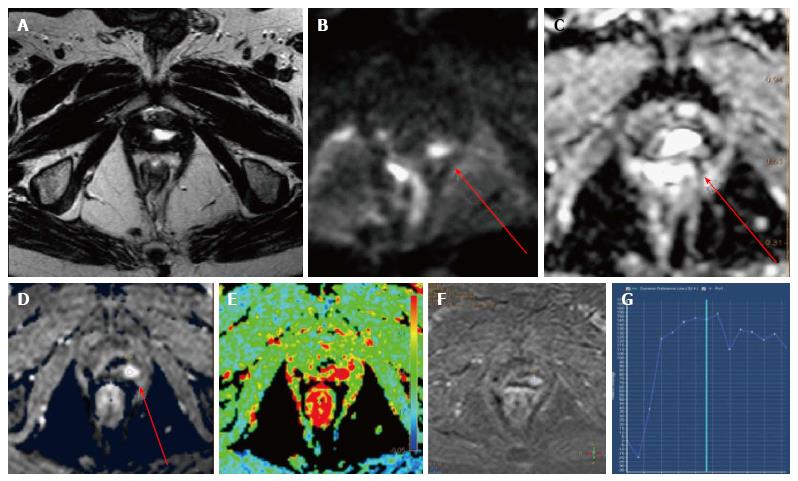
Figure 9 Multiparametric magnetic resonance imaging of local recurrence.
A: Morphological study: Axial T2-weighted fast-spin echo image. No recurrence is detected; B-F: Functional study; B and C: Axial diffusion sequences showing restricted diffusion in ADC map (arrow); D-G: Axial gradient-echo T1-weighted images showing focal enhancement in dynamic study (D) (arrow), color map (E) and curve (G).
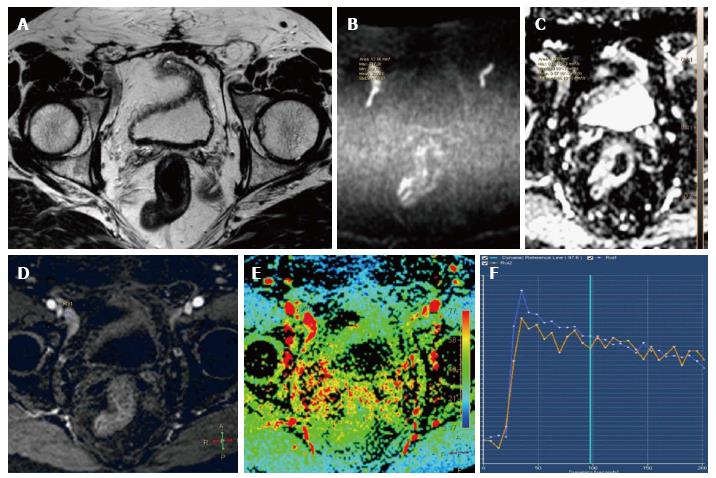
Figure 10 Lymph node study.
A: Axial T2-weighted fast-spin echo image shows right external iliac lymph nodes; B and C: Axial diffusion sequences; C: Restricted diffusion in ADC map; D: Axial gradient-echo T1-weighted perfusion image showing a high peak enhancement; E: Color map; F: Curve; ADC: Apparent diffusion coefficient.
- Citation: Couñago F, Sancho G, Catalá V, Hernández D, Recio M, Montemuiño S, Hernández JA, Maldonado A, del Cerro E. Magnetic resonance imaging for prostate cancer before radical and salvage radiotherapy: What radiation oncologists need to know. World J Clin Oncol 2017; 8(4): 305-319
- URL: https://www.wjgnet.com/2218-4333/full/v8/i4/305.htm
- DOI: https://dx.doi.org/10.5306/wjco.v8.i4.305


