Copyright
©The Author(s) 2017.
World J Clin Oncol. Jun 10, 2017; 8(3): 214-229
Published online Jun 10, 2017. doi: 10.5306/wjco.v8.i3.214
Published online Jun 10, 2017. doi: 10.5306/wjco.v8.i3.214
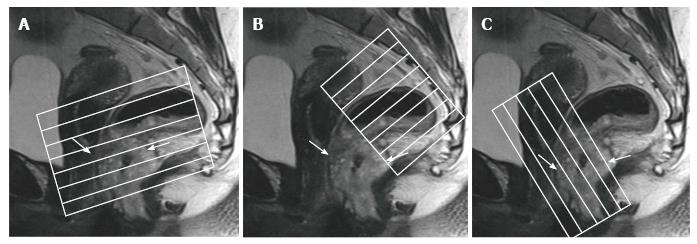
Figure 1 Magnetic resonance imaging planes.
T2-weighted sagittal images are used to determine the longitudinal tumor axis in order to angle the axial and coronal planes. A: Oblique axial plane is obtained perpendicular to the rectal wall at the level of the rectal mass; B: Oblique axial plane is angled perpendicular to the pelvic floor, used to cover lymph node drainage territory; C: Coronal plane is angled parallel to the anal canal for imaging of low rectal tumors. Rectal tumor is indicated by arrows.
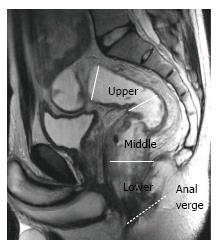
Figure 2 Rectal segments.
T2-weighted sagittal image shows rectal segments: Lower, < 5 cm; middle, 5-10 cm; upper, > 10 cm from the anal verge.
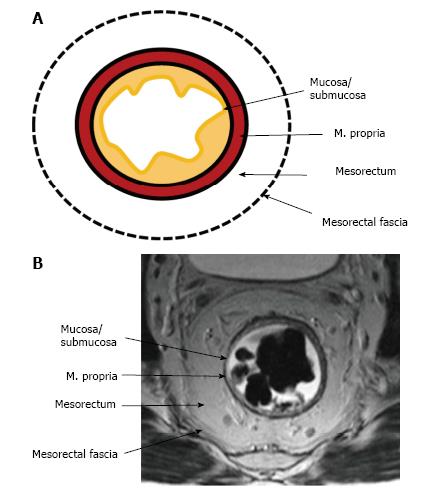
Figure 3 Normal rectal wall anatomy of higher and middle rectum.
Schematic (A) and T2-weighted axial magnetic resonance imaging (B) presentation. The internal hyperintense layer represents the mucosa and submucosa (no distinction is possible between in two layers); the medial hypointense layer and external hyperintense area represent the muscularis propria and the mesorectum, respectively. Mesorectal fascia is seen thin hypointense layer enveloping the mesorectum (arrows).
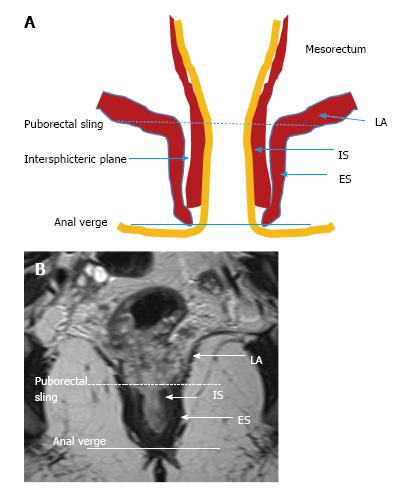
Figure 4 Normal anatomy of lower rectum.
Schematic (A) and coronal plane T2-weighted (B) magnetic resonance imaging presentation. Puborectal sling, the upper portion of the puborectal muscle displaying the uppermost portion of the anal canal (intermittent line). Anal verge is the lowermost portion of the anal canal (line). LA: Levator ani muscle; IS: Internal sphincter; ES: External sphincter.
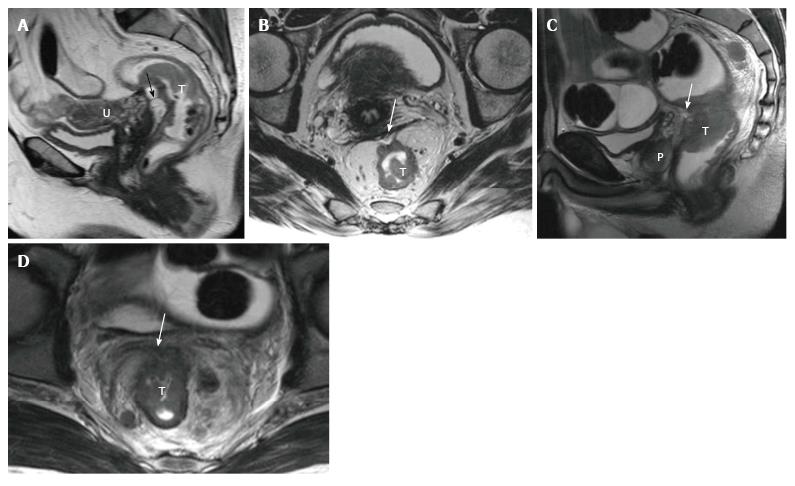
Figure 5 Periton invasion in female (A and B) and male (C and D) patients with T4a rectal tumors.
On sagittal T2-weighted images, periton is seen as a hypointense linear structure in front of the tumor (arrows in A, C). On axial T2-weighted images, the peritoneum has a V shape and attaches onto the anterior aspect of the rectal cancer (arrows in B and D). T: Tumor; U: Uterus; P: Prostate.
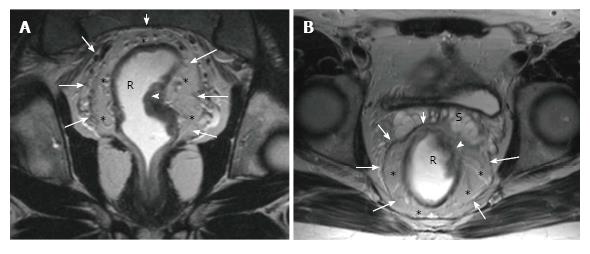
Figure 6 Magnetic resonance imaging anatomy of mesorectum and mesorectal fascia.
On T2-weighted (A) axial and (B) coronal plane magnetic resonance images, mesorectal fascia (arrows) is seen as a thin, low-signal intensity layer enveloping the mesorectal fatty tissue (*) and rectum in a male patient with rectal carcinoma.
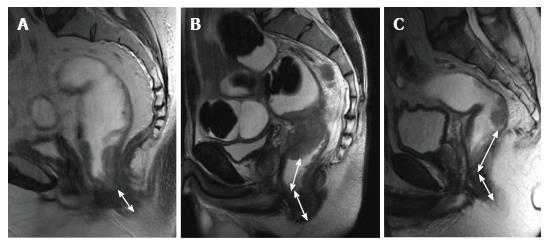
Figure 7 Rectal tumor levels.
T2-weighted sagittal images in different patients with rectal carcinoma show distance from the anal verge (double-headed arrows) in (A) low rectal, (B) midrectal, and (C) upper rectal tumors (low rectal tumor, < 5 cm; midrectal, 5-10 cm; upper rectal, > 10 cm).
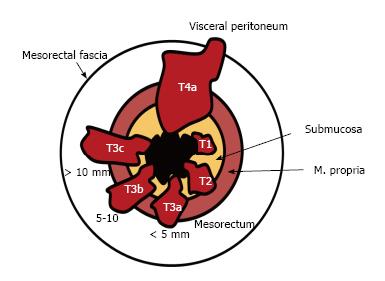
Figure 8 Rectal tumor T staging.
The American Joint Committee on Cancer suggested an optional stratification of T3 tumors based on the extramural depth of invasion: Less than 5 mm, T3a; 5-10 mm, T3b; and more than 10 mm, T3c (adapted from ref. [27]: Nougaret S, Reinhold C, Mikhael HW, Rouanet P, Bibeau F, Brown G. The use of MR imaging in treatment planning for patients with rectal carcinoma: have you checked the “DISTANCE”? Radiology 2013; 268: 330-344).
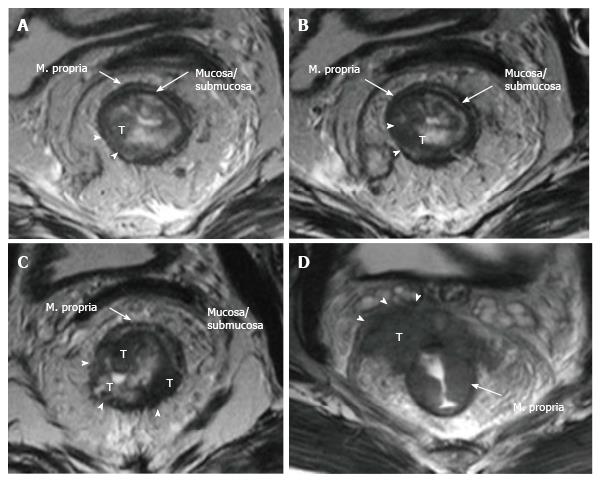
Figure 9 Rectal cancer T staging on magnetic resonance imaging.
T2-weighted axial images showing rectal carcinomas with different T stages. A: T1 tumor is confined to the submucosa, has not entered the muscularis propria (arrowheads); B: T2 tumor extends into, but not beyond, the muscularis propria (arrowheads); C: T3 tumor extends beyond the muscularis propria and strands into mesorectal fat (arrowheads); D: T4a tumor invades the visceral peritoneum (arrowheads). T: Tumor.
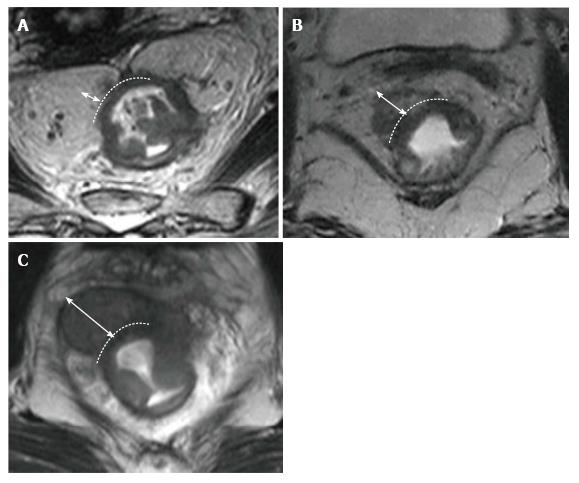
Figure 10 Stratification of T3 tumors on magnetic resonance imaging.
T2-weighted axial magnetic resonance images in different patients with T3 rectal carcinoma showing extension of the tumor beyond the muscularis propria (double-headed arrows). The distance A: Less than 5 mm, T3a; B: 5-10 mm, T3b; and C: More than 10 mm, T3c.
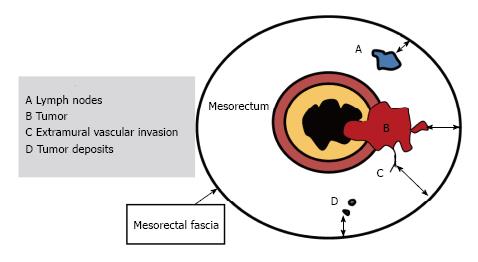
Figure 11 Schematic representation of positive resection margin.
For T3 tumors, the shortest distance between the most penetrating parts of the tumor and the MRF is measured (double-headed arrows). A tumor mesorectal fascia distance of more than 1 mm is a reliable predictor for negative margins. In the presence of satellite nodules such as tumor deposits, lymph nodes or EMVI the shortest distance between the nodules and the MRF should also be reported (Adapted from ref. [27]: Nougaret S, Reinhold C, Mikhael HW, Rouanet P, Bibeau F, Brown G. The use of MR imaging in treatment planning for patients with rectal carcinoma: have you checked the “DISTANCE”? Radiology 2013; 268: 330-344). EMVI: Extramural vascular invasion; MRF: Mesorectal fascia.
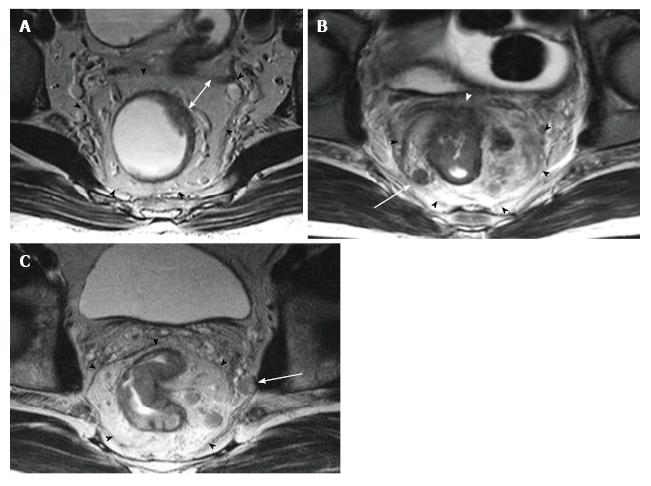
Figure 12 Distance to mesorectal fascia and mesorectal fascia invasion in different patients on T2-weighted axial images.
A: T3a tumor is far away from the mesorectal fascia (double-headed arrow); B: T4a tumor (white arrowhead) and a suspicious mesorectal lymph node (arrow) are abutting the mesorectal fascia; C: Rectal tumor is lying > 1 mm from the mesorectal fascia; however, a suspicious lymph node, located out of the mesorectal fascia, is lying within < 1 mm of the mesorectal fascia (arrow). Mesorectal fascia is indicated with black arrowheads.
Figure 13 Extramural vascular invasion.
T2-weighted (A) coronal and (B and C) serial axial magnetic resonance images in the same patient with T4a rectal cancer showing an irregular and expanded vessel insert to the tumor with tumoral signal intensity (circles).
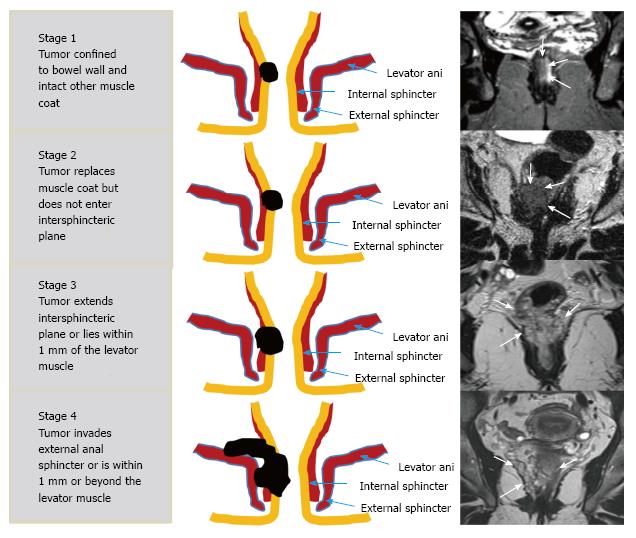
Figure 14 Schematic and high-spatial-resolution coronal T2-weighted magnetic resonance images for each stage according to the low rectal cancer.
Rectal tumors in different patients are indicated with arrows on magnetic resonance images (Adapted from ref. [27]: Nougaret S, Reinhold C, Mikhael HW, Rouanet P, Bibeau F, Brown G. The use of MR imaging in treatment planning for patients with rectal carcinoma: have you checked the “DISTANCE”? Radiology 2013; 268: 330-344).
Figure 15 Stage 4 low rectal cancer.
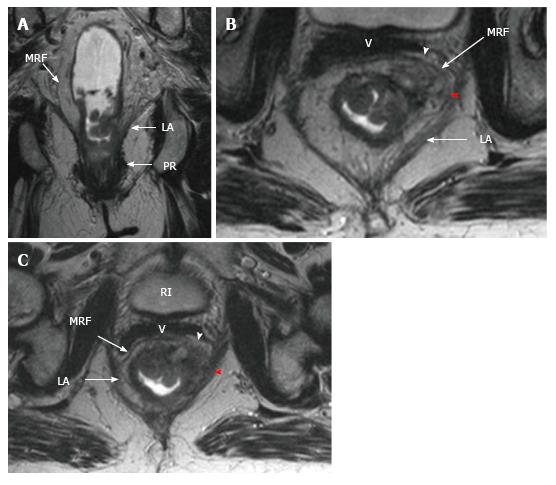
On T2-weighted (A) coronal (B, C) serial axial magnetic resonance images, rectal cancer showing invasion of levator ani (red arrowheads) and mesorectal fascia (white arrowhead). LA: Levator ani; PR: Puborectal; MRF: Mesorectal fascia; BL: Bladder; V: Vagina.
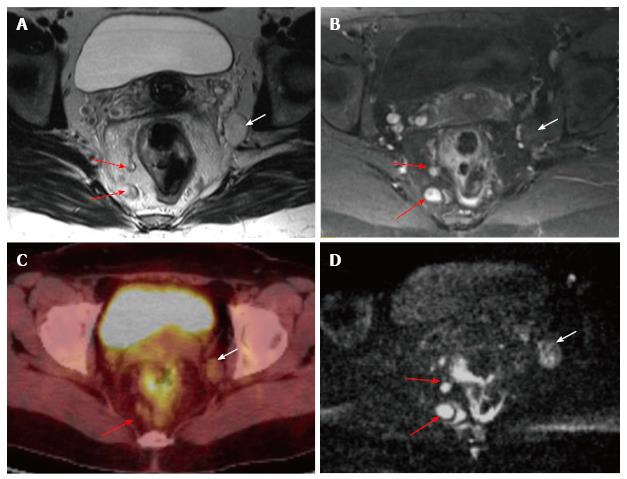
Figure 16 Mesorectal and extramesorectal lymph node involvement in rectal cancer.
A: T2-weighted; B: T1-weighted contrast-enhanced axial MR images; C: 18F-FDG PET-CT; D: DWI showing suspicious lymph nodes in mesorectal (red arrows) and extramesorectal areas (white areas). On DWI, extramesorectal lymph node is more remarkable than T2W and contrast-enhanced T1W sequences. DWI: Diffusion-weighted imaging; 18F-FDG PET-CT: 18F-fluorodeoxyglucosepositron emission tomography-computedtomography.
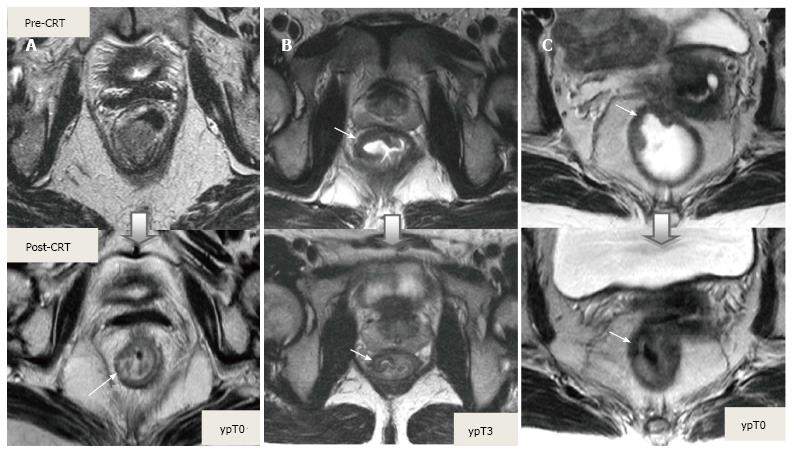
Figure 17 Tumor restaging after neoadjuvant chemoradiotherapy.
On T2-weighted MR images in different patients showing baseline and post-CRT images on upper and lower series, respectively. A: In ypT0 rectal tumor, posttreatment axial image shows a normal, two-layered rectal wall (arrow), corresponding to complete response; B: In ypT3 rectal tumor, posttreatment axial image shows normal, two-layered rectal wall (arrow). This is an example for false-negative MR assessment of complete tumor regression; C: In ypT0 rectal tumor, posttreatment axial image shows thick, fibrotic low signal intensity scar (arrow) in pretreatment T3 tumor area. CRT: Chemoradiotherapy.
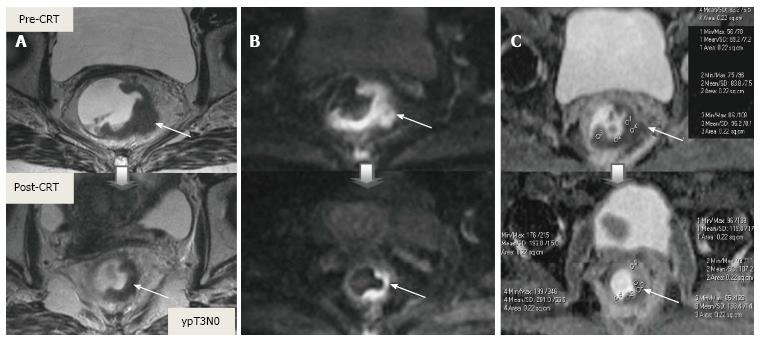
Figure 18 Post-chemoradiotherapy restaging using diffusion-weighted imaging in ypT3 rectal tumor.
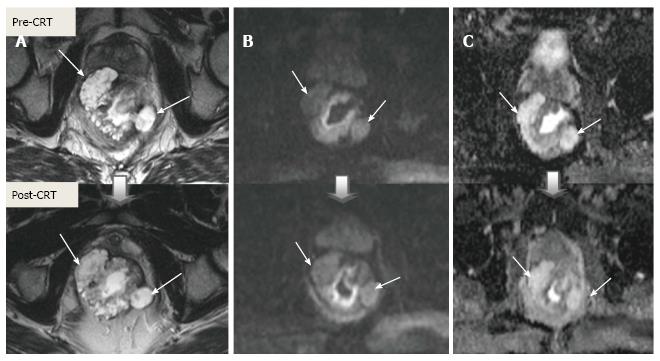
On T2-weighted (A), DW (B) and ADC (C) images in the same patient, baseline and post-CRT images are shown on upper and lower series, respectively. A: Posttreatment T2-weighted axial image shows semiannular infiltrating tumor, compatible with a residual T3 tumor (arrow); B: Posttreatment DW; C: ADC images delineate high and low signal-intensity corresponding to the tumor, respectively (arrow). Pre- and post-treatment mean ADC values are 0.68-0.72, 1.22-1.44 × 10⁻³ mm²/s, respectively, in the tumor area. Post-therapy ADC increase is compatible with therapy response. CRT: Chemoradiotherapy.
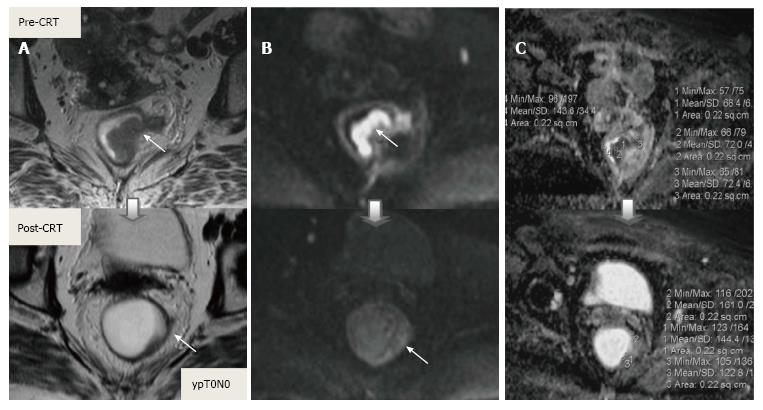
Figure 19 Post-chemoradiotherapy restaging using diffusion-weighted imaging in ypT0 rectal tumor.
On T2-weighted (A), DW (B) and ADC (C) images in the same patient, baseline and post-CRT images are shown on upper and lower series, respectively. A: Posttreatment T2-weighted axial image shows a thick wall of low-signal-intensity fibrosis in the previous rectal tumor area (arrow). It is difficult to determine whether this area contains tumor cells or completely devoid of tumor cells (complete response); B: On posttreatment DW image (B-800), there is no diffusion signal in previous tumor area (arrows), compatible with complete response. In this case, DWI allows the correct differentiation of viable tumor from fibrosis; C: ADC images show post-therapy mean ADC increase (0.70 × 10⁻³ mm²/s vs 1.40 × 10⁻³ mm²/s) compatible with therapy response, but does not allow prediction of complete response. DWI: Diffusion-weighted imaging; CRT: Chemoradiotherapy.
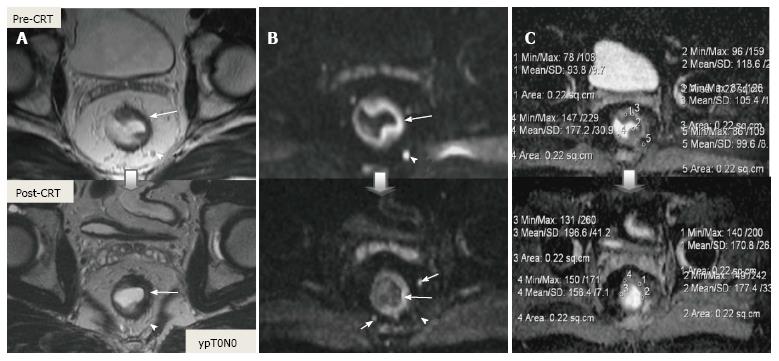
Figure 20 Post-chemoradiotherapy restaging using diffusion-weighted imaging in ypT0 rectal tumor.
On T2-weighted (A), DW (B) and ADC (C) images in the same patient, baseline and post-CRT images are shown on upper and lower series, respectively. A: Posttreatment T2-weighted axial image shows a thick wall of low-signal-intensity fibrosis and areas suspicious for residual tumor have intermediate signal-intensity in the previous rectal tumor area (long arrow); B: Posttreatment DW images delinate a small foci of intermediate and low signal-intensity, respectively, compatible with residual tumor (long arrow); C: ADC images show post-therapy mean ADC increase (1.05 × 10⁻³ mm²/s vs 1.80 × 10⁻³ mm²/s), compatible with therapy response, but not with complete response. The suspicious mesorectal lymph node (arrowheads) is invisible on T2 and DWI after CRT, but the other two are still visible (short arrows). This case is an example for false-positive tumor and lymph node response evaluation of DWI. DWI: Diffusion-weighted imaging; CRT: Chemoradiotherapy.
Figure 21 Mucinous adenocarcinoma.
A: T2; B: Diffusion-weighted; C: ADC images in the same patient, baseline and post-CRT images are shown on upper and lower series, respectively. The mucinous tumor exhibits hyperintensity on T2, diffusion, and ADC images before and after treatment regardless of their response to treatment. Pre-and post-treatment ADC values are 1.70 × 10⁻³ mm²/s and 2.10 × 10⁻³ mm²/s, respectively. Their response to CRT cannot be assessed using diffusion-weighted imaging. CRT: Chemoradiotherapy.
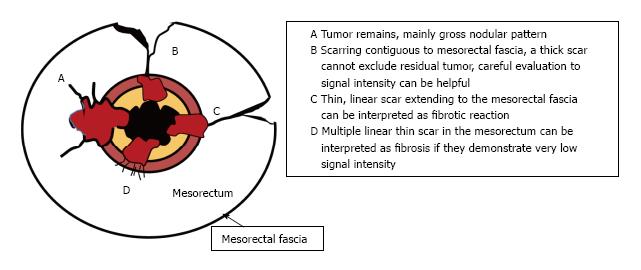
Figure 22 Schematic representation of effects of chemoradiotherapy on a rectal tumor and circumferential resection margins.
Adapted from ref. [27]: Nougaret S, Reinhold C, Mikhael HW, Rouanet P, Bibeau F, Brown G. The use of MR imaging in treatment planning for patients with rectal carcinoma: have you checked the “DISTANCE”? Radiology 2013; 268: 330-344.
Figure 23 The effects of chemoradiotherapy on a rectal tumor and circumferential resection margins.
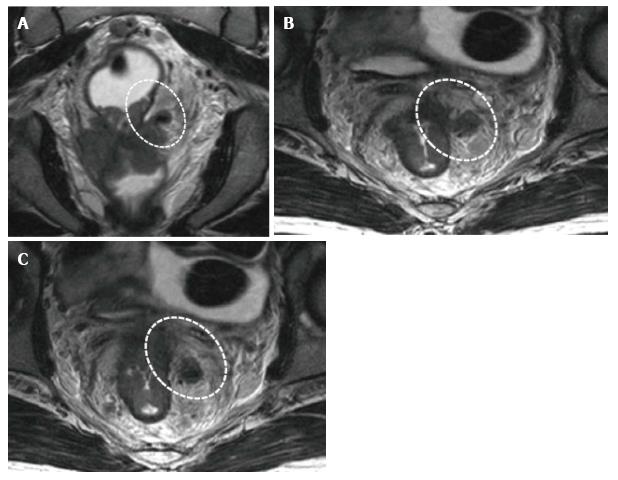
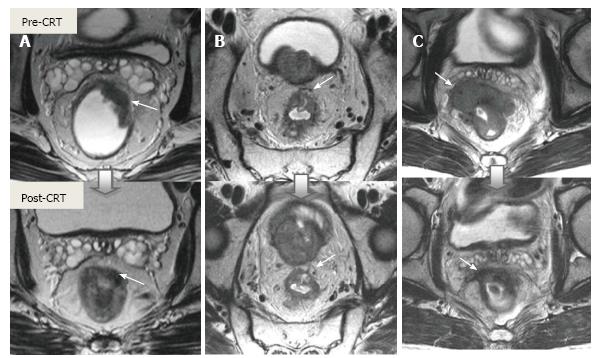
T2-weighted axial magnetic resonance images in different patients show baseline and post-CRT images on upper and lower series, respectively. A: Overstaging due to thick, hypointense tissue infiltration at the mesorectal fascia (arrow) in ypT2 rectal tumor with no MRF invasion; B: In ypT3 rectal tumor with no MRF invasion, thick fibrous retractions of the tumor, suspicious for CRM positivity (arrow); C: Rectal mass is markedly shrunken with low-signal-intensity tissue infiltration at the mesorectal fascia (arrow). At surgery, there was tumor invasion of the mesorectal fascia. CRM: Circumferential resection margins; MRF: Mesorectal fascia; CRT: Chemoradiotherapy.
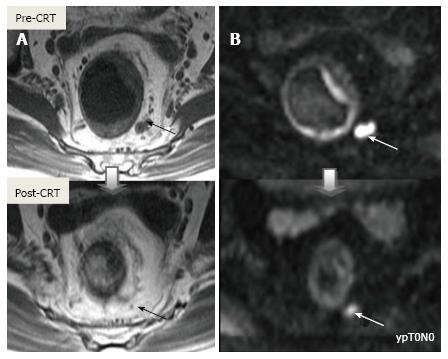
Figure 24 On diffusion-weighted imaging, false-positive mesorectal lymph node evaluation after chemoradiotherapy in ypT0N0 rectal cancer.
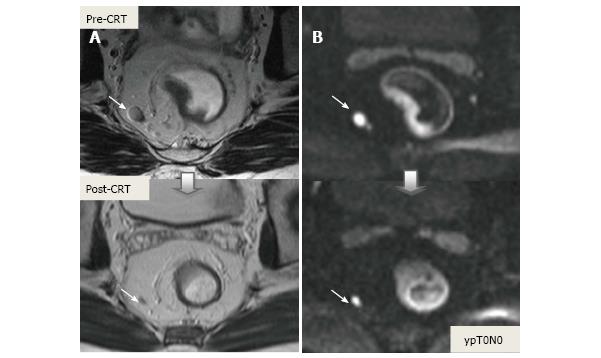
A: T2-weighted axial magnetic resonance images show significant diminution in nodal size after chemoradiotherapy, compatible with negative lymph node (arrows); B: Diffusion-weighted images, high diffusion signal continues after treatment in the perirectal lymph node, compatible with positive lymph node (arrows). CRT: Chemoradiotherapy.
Figure 25 On diffusion-weighted imaging, false-positive mesorectal lymph node after chemoradiotherapy in ypT0N0 rectal cancer.
A: T2-weighted axial images show significant diminution in nodal size, compatible with complete response; B: The contuniation of high diffusion signal intensity on residual fibrotic lymph node incorrectly corresponds to a metastatic lymph node (arrows). CRT: Chemoradiotherapy.
- Citation: Engin G, Sharifov R. Magnetic resonance imaging for diagnosis and neoadjuvant treatment evaluation in locally advanced rectal cancer: A pictorial review. World J Clin Oncol 2017; 8(3): 214-229
- URL: https://www.wjgnet.com/2218-4333/full/v8/i3/214.htm
- DOI: https://dx.doi.org/10.5306/wjco.v8.i3.214


