Copyright
©The Author(s) 2017.
World J Clin Oncol. Feb 10, 2017; 8(1): 54-66
Published online Feb 10, 2017. doi: 10.5306/wjco.v8.i1.54
Published online Feb 10, 2017. doi: 10.5306/wjco.v8.i1.54
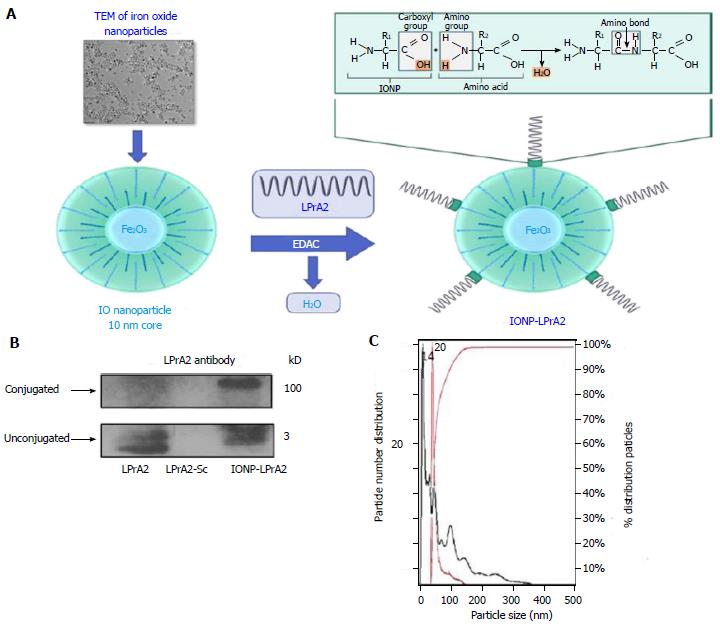
Figure 1 Generation and characterization of IONP-LPrA2.
A: Conjugation of IONP-LPrA2. LPrA2 was conjugated to IONPs via 1-Ethyl-3-(3-dimethylaminopropyl)carbodiimide (EDAC), which activates the carboxyl group on the IONP surface allowing it to form a covalent bond with the amino group of LPrA2 (displayed by TEM, transmission electron microscopy, Ocean Nanotech); B: Western blot confirmation of IONP-LPrA2 conjugation. Conjugated IONP-LPrA2 (100 kD) was detected by Western blot with an LPrA2 antibody, purified from antigen injected rabbit bleeds. Unconjugated LPrA2 (3 kD) and the scrambled peptide LPrA2-Sc (3 kD) served as positive and negative controls, respectively; C: NanoSight analysis of unconjugated and conjugated IONPs. The particle size of unconjugated IONP (14 nm) shown in black and the conjugated IONP-LPrA2 (20 nm) shown in red were determined by nanoparticle tracking analysis. The hyperbolic curve shows that the particles are 100% homogeneous.
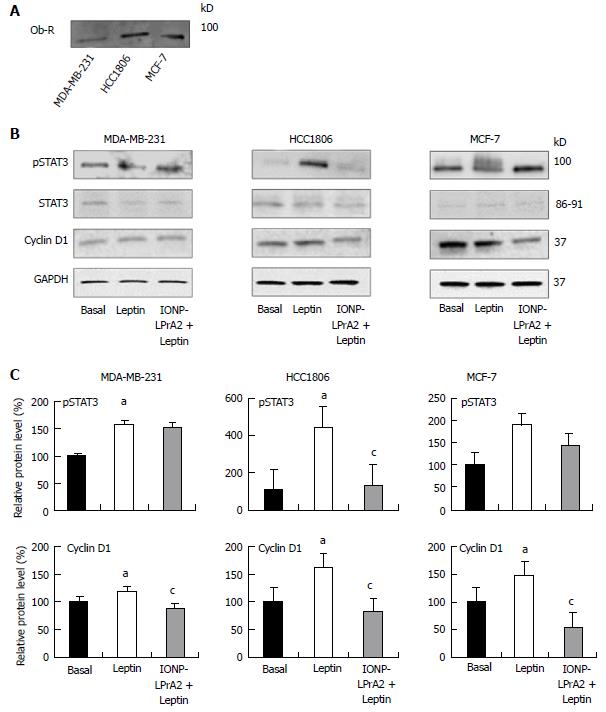
Figure 2 Ob-R expression and effect of IONP-LPrA2 on leptin-induced pSTAT3 and cyclin D1 levels in human breast cancer cells.
A: Detection of Ob-R expression. The expression of Ob-R was detected by Western blot in MDA-MB-231, HCC1806, and MCF-7 cells; B: IONP-LPrA2 inhibition of leptin-induced pSTAT3 and cyclin D1 levels. Lysates were obtained from MDA-MB-231, HCC1806, and MCF-7 cells treated with leptin (1.2 nmol/L) or IONP-LPrA2 (0.0036 pmol/L) plus leptin (1.2 nmol/L) for 24-48 h. pSTAT3 and cyclin D1 levels were detected by Western blot. STAT3 served as a loading control for pSTAT3. GAPDH served as a loading control for cyclin D1; C: Densitometric analysis of pSTAT3 and cyclin D1 levels. Graphs represent quantitative analysis of pSTAT3 and cyclin D1 levels in MDA-MB-231, HCC1806, and MCF-7 cells with Image J software. Relative protein level was significantly increased in leptin treated cell lines compared to basal (untreated) cells, aP < 0.05. Relative protein level in cells pretreated with IONP-LPrA2 and then leptin differed significantly from those treated with leptin alone, cP < 0.05.
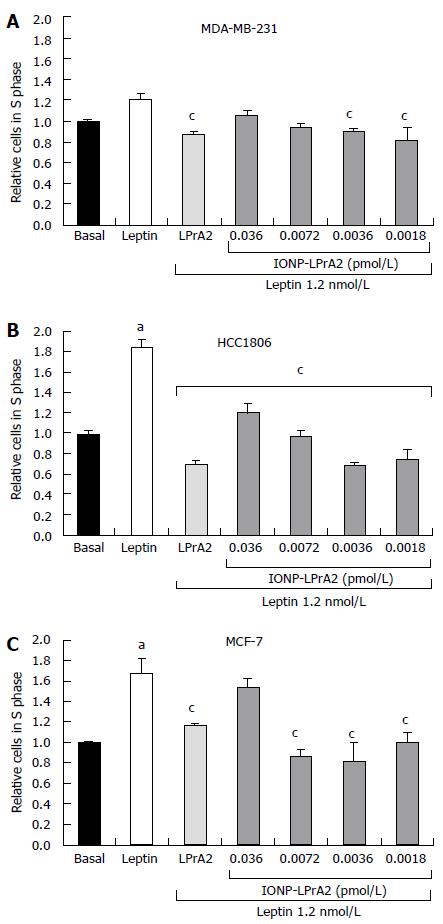
Figure 3 IONP-LPrA2 inhibits leptin-induced cell cycle progression of human breast cancer cell lines.
IONP-LPrA2 inhibits S phase progression in breast cancer cells. A: MDA-MB-231; B: HCC1806; C: MCF-7. The cells were seeded in 6 well plates and treated with leptin (1.2 nmol/L), LPrA2 (1.2 nmol/L) plus leptin (1.2 nmol/L), or IONP-LPrA2 at indicated concentrations plus leptin (1.2 nmol/L) for 24-48 h. The percentage of cells in S phase was determined by cell cycle analysis, a measure of propidium iodide (PI) fluorescence. Relative percentage of cells in S phase was significantly increased in leptin treated cell lines compared to basal (untreated) cells, aP < 0.05. Relative percentage of cells in S phase pretreated with leptin antagonists and then leptin differed significantly from those treated with leptin alone, cP < 0.05.
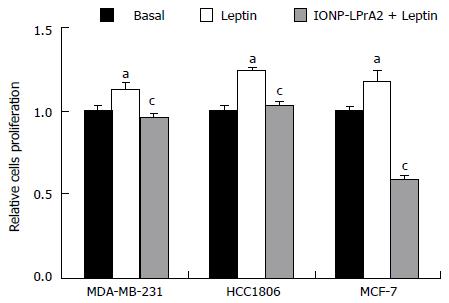
Figure 4 IONP-LPrA2 inhibits leptin-induced cell proliferation in human breast cancer cells.
MDA-MB-231, HCC1806, and MCF-7 cells were seeded in 96 well plates and treated with leptin (1.2 nmol/L) and IONP-LPrA2 (0.0036 pmol/L) plus leptin (1.2 nmol/L) for 24-48 h. Cell proliferation was determined by MTT assay. Relative percentage of proliferating cells was significantly increased in leptin treated cell lines compared to basal (untreated) cells, aP < 0.05. Relative percentage of proliferating cells pretreated with IONP-LPrA2 and then leptin differed significantly from those treated with leptin alone, cP < 0.05.
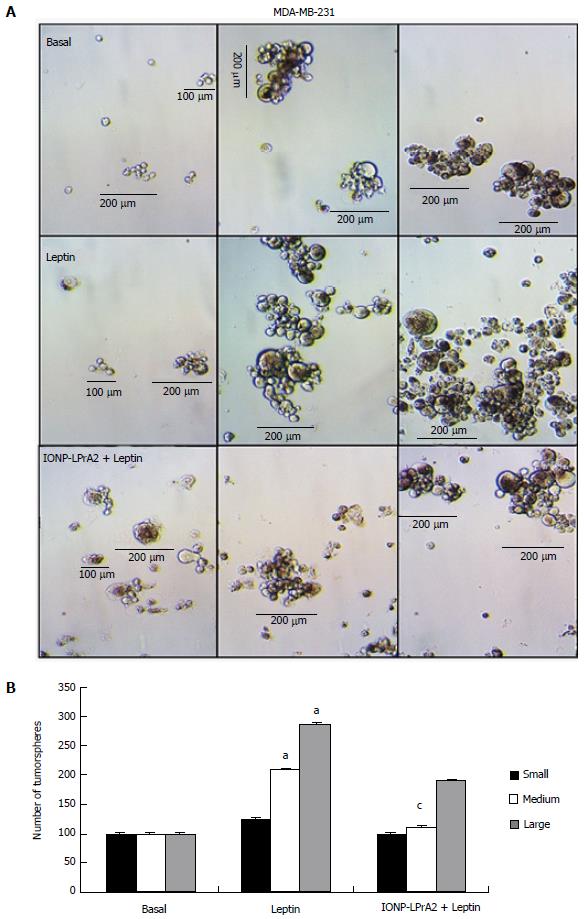
Figure 5 IONP-LPrA2 decreases MDA-MB-231 tumorsphere formation.
A: IONP-LPrA2 attenuation of leptin-induced tumorsphere formation. MDA-MB-231 cells were grown in low attachment plates with mammocult medium for 1-2 wk, under treatment with leptin (1.2 nmol/L) and IONP-LPrA2 (0.0036 pmol/L) plus leptin (1.2 nmol/L). Tumorspheres were counted. Tumorspheres were grouped according to size: Small (< 100 μm), medium (100-200 μm) and large (> 200 μm); B: Effect of leptin and IONP-LPrA2 on number and size of tumorspheres. Graph represents quantitative analysis of small, medium, and large tumorspheres in response to leptin and IONP-LPrA2 treatment. The number of colonies was significantly increased in leptin treated cells compared to basal (untreated) cells, aP < 0.05. The number of colonies pretreated with IONP-LPrA2 and then leptin differed significantly from those treated with leptin alone, cP < 0.05.
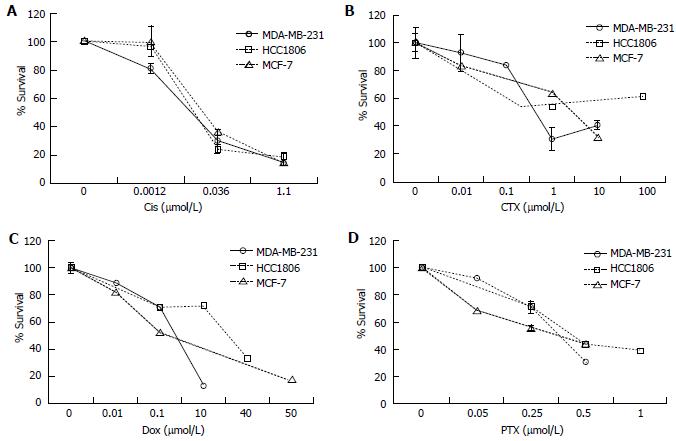
Figure 6 The effect of chemotherapeutics on survival of breast cancer cell lines.
The effective dose of the chemotherapeutics. A: Cisplatin (Cis); B: Cyclophosphamide (CTX); C: Doxorubicin (Dox); D: Paclitaxel (PTX) were determined in MDA-MB-231, HCC1806, and MCF-7 cells. The cells were seeded in 6 well plates and treated with Cis (0.001-1.1 μmol/L), CTX (0.01-100 μmol/L), Dox (0.01-50 μmol/L), and PTX (0.05-1.0 μmol/L) for 1-6 d. Percent survival was determined by the Annexin V/FITC and PI assay. The relative survival was determined by multiplying the percentage of live cells by the total cell count.
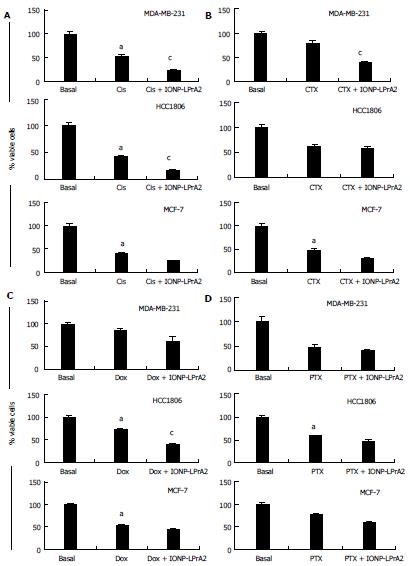
Figure 7 Determination of the effect of IONP-LPrA2 on survival of breast cancer cells treated with chemotherapeutics.
MDA-MB-231, HCC1806, and MCF-7 cells were treated with an effective dose of the chemotherapeutics. A: Cisplatin (Cis); B: Cyclophosphamide (CTX); C: Doxorubicin (Dox); D: Paclitaxel (PTX) plus IONP-LPrA2 (0.0036 pmol/L). The cells were seeded in 6 well plates and treated with chemotherapeutics at effective concentrations determined in Figure 6 for 1-6 d. The treatment concentrations were MDA-MB-231 (Cis 0.001 μmol/L, CTX 0.5 μmol/L, Dox 0.4 μmol/L, PTX 0.5 μmol/L); HCC1806 (Cis 0.036 μmol/L, CTX 1 μmol/L, Dox 10 μmol/L, PTX 0.5 μmol/L); and MCF-7 (Cis 0.036 μmol/L, CTX 5 μmol/L, Dox 0.01 μmol/L, PTX 1 μmol/L). Percent of survival was determined by the Annexin V/FITC and PI assay. The relative survival was determined by multiplying the percentage of live cells by the total cell count. Percent viability was significantly decreased in cells treated with chemotherapeutic compared to basal (untreated) cells, aP < 0.05. Cells treated with chemotherapeutic and IONP-LPrA2 differed significantly from those treated with chemotherapeutic alone, cP < 0.05.
- Citation: Harmon T, Harbuzariu A, Lanier V, Lipsey CC, Kirlin W, Yang L, Gonzalez-Perez RR. Nanoparticle-linked antagonist for leptin signaling inhibition in breast cancer. World J Clin Oncol 2017; 8(1): 54-66
- URL: https://www.wjgnet.com/2218-4333/full/v8/i1/54.htm
- DOI: https://dx.doi.org/10.5306/wjco.v8.i1.54


