Copyright
©The Author(s) 2016.
World J Clin Oncol. Jun 10, 2016; 7(3): 293-301
Published online Jun 10, 2016. doi: 10.5306/wjco.v7.i3.293
Published online Jun 10, 2016. doi: 10.5306/wjco.v7.i3.293
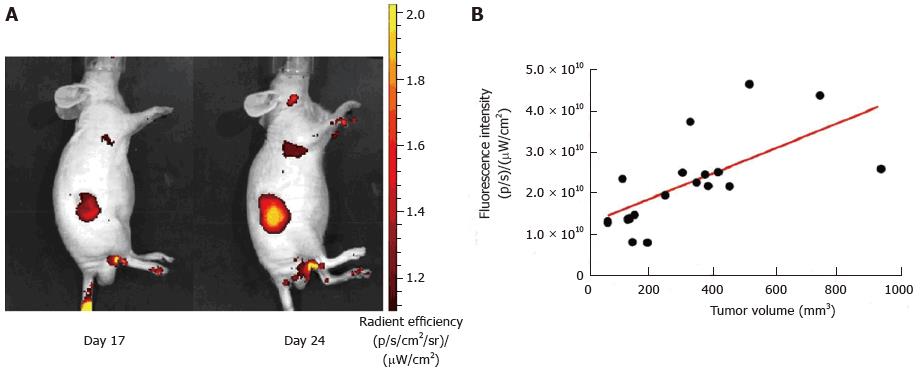
Figure 1 Correlation of tumor volume (HCT116 cells xenograft) and 2-DG-750 fluorescence signal uptake.
A: Representative animal images showing the increase in fluorescence signal intensity with tumor development (day 17 and day 24 post-xenograft); B: Correlation between tumor development determined using a caliper and increase in fluorescence signal intensity (Pearson’s correlation factor r = 0.4197; P = 0.0036).
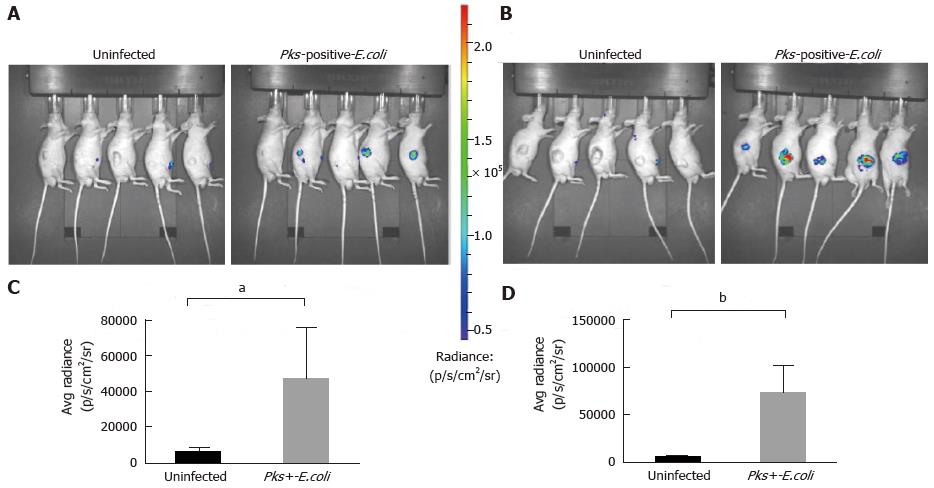
Figure 2 Significant increase of inflammation in HCT116 tumors infected with Escherichia coli strains measured by optical imaging using the inflammation probe.
In vivo BLI imaging was performed at day 20 (A) and day 34 (B) post-HCT116 xenograft in nude mice (n = 5 animals with uninfected xenograft; n = 5 animals in pks-positive E. coli-infected xenograft). BLI images comparing uninfected to pks-positive E. coli-infected xenografts are shown on day 20 (A) and day 34 (B) post-xenograft. Intensity of emission is represented as the pseudocolor image. A sharp increase in the BLI signal was seen in the pks-positive E. coli-infected xenograft group at each time point. The BLI signal detected 10 min after i.p. probe injection was quantified from the ROI drawn manually. Photon flux was expressed as the average radiance in p/s/cm2/sr. Graphs reveal a statistically significant increase in the BLI signal in the pks-positive E. coli-infected tumors: day 20, aP = 0.0132 (C) and day 34, bP = 0.0006 (D). BLI: Bioluminescent; E. coli: Escherichia coli; i.p.: Intraperitoneal.
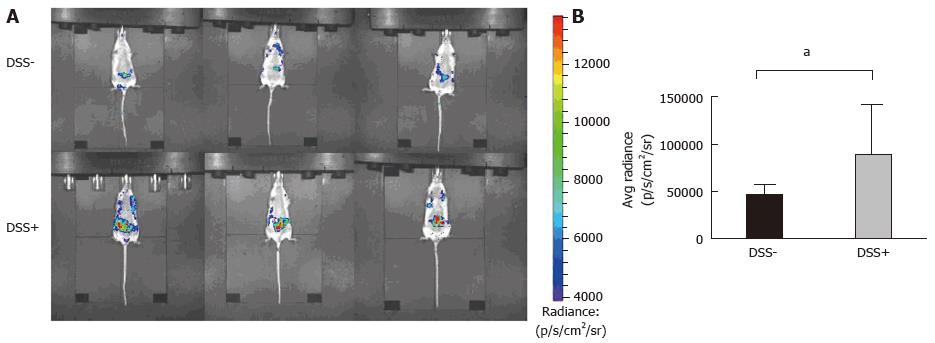
Figure 3 Monitoring of intra-digestive bioluminescent signals using the inflammation probe in the CEABAC10 mouse model.
One mouse group was treated with 1% dextran sodium sulfate (DSS-treated mice group) in drinking water for 6 d (n = 3), while the other group received only drinking water (n = 3; DSS-). Mice were subjected to one cycle of DSS and then imaging with the inflammation probe before sacrifice. Mice were intravenously injected with the inflammation probe, and the BLI signal was detected immediately after injection. DSS-treated mouse group acquisition (A) showed severe intra-digestive inflammation was correlated with a significant increase in the BLI signal on graphs (B) compared to the DSS group (aP = 0.03). BLI: Bioluminescent; DSS: Dextran sodium sulfate.
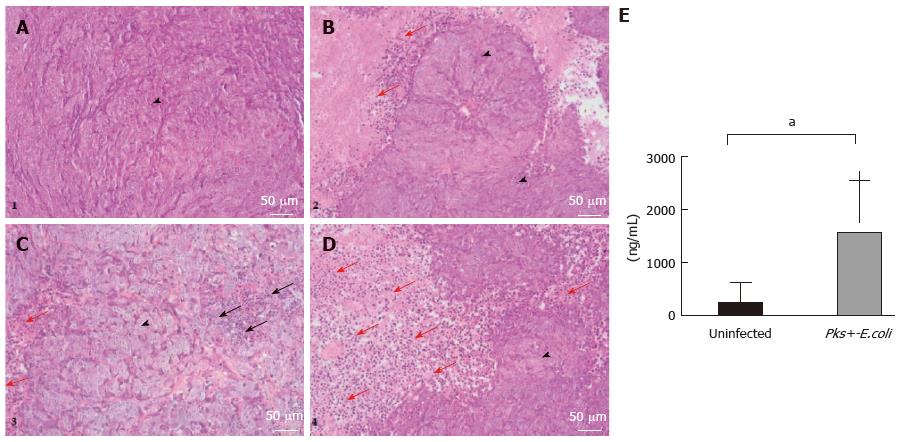
Figure 4 Histological and molecular analyses of HCT116 tumor samples.
A-D: Histological examination of representative HCT116 tumor samples. Xenografts were harvested, paraffin embedded and processed for hematoxylin/eosin/safran. A and B are representative histological examinations from the uninfected xenograft group. C and D are representative histological examinations from the pks-positive-E. coli infected xenograft group. We noted that HCT116 tumor cells (arrowheads) infected with pathogenic E. coli strains are characterized by megalocytosis and progressive enlargement of the cell body and nucleus. Tumor cells in the pks-positive E. coli-infected xenograft group were surrounded by a remarkable infiltration of inflammatory cells (red arrow) compared to the uninfected xenograft group. Tumor necrosis was observed, especially in the infected xenograft group (black arrow). (Scale bars: 50 μm = × 20); E: MPO levels by enzyme-linked immunosorbent assay (ELISA) on HCT116 tumor specimens. An ELISA test was performed on tumor specimens after mouse sacrifice (day 34 post-xenograft). MPO standardized levels were significantly higher (1556 ± 313.6 vs 234.6 ± 121.6, aP = 0.001) in xenografts infected with pathogenic pks-positive E. coli strains. E. coli: Escherichia coli; MPO: Myeloperoxidase.
- Citation: Veziant J, Gagnière J, Jouberton E, Bonnin V, Sauvanet P, Pezet D, Barnich N, Miot-Noirault E, Bonnet M. Association of colorectal cancer with pathogenic Escherichia coli: Focus on mechanisms using optical imaging. World J Clin Oncol 2016; 7(3): 293-301
- URL: https://www.wjgnet.com/2218-4333/full/v7/i3/293.htm
- DOI: https://dx.doi.org/10.5306/wjco.v7.i3.293


