Copyright
©The Author(s) 2016.
World J Clin Oncol. Apr 10, 2016; 7(2): 160-173
Published online Apr 10, 2016. doi: 10.5306/wjco.v7.i2.160
Published online Apr 10, 2016. doi: 10.5306/wjco.v7.i2.160
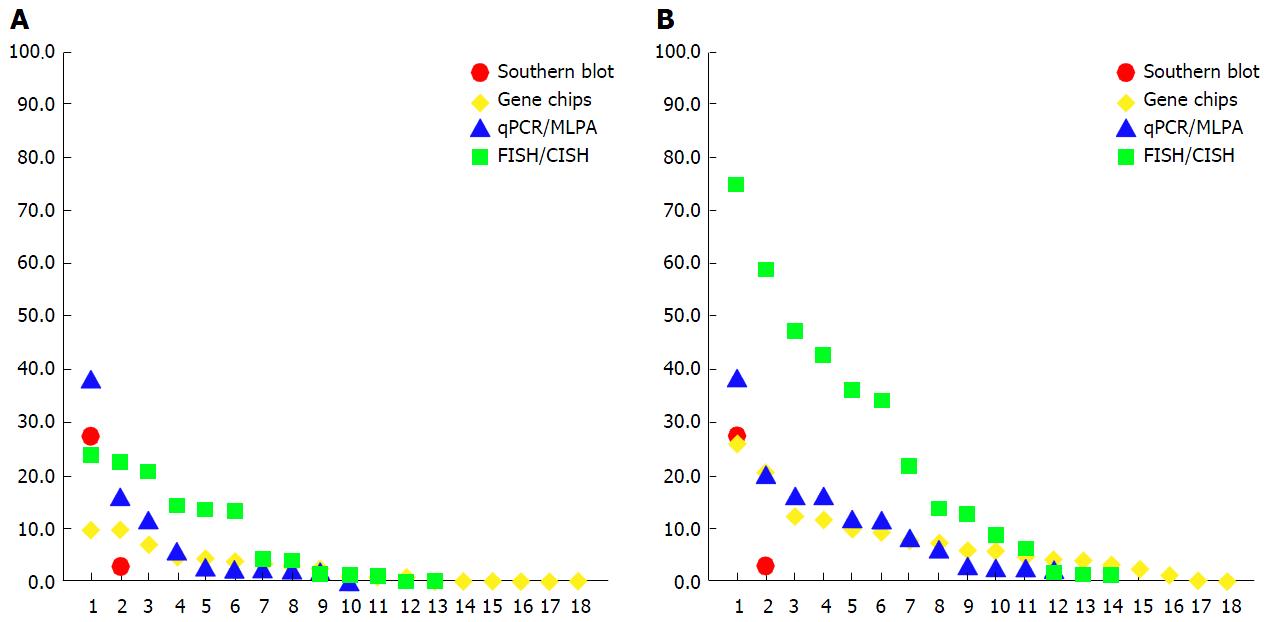
Figure 1 Prevalence of estrogen receptor alpha gene amplification in the literature.
The fraction of altered cases (y-axis) is indicated across published studies (x-axis) and is shown separately for different detection methods. The studies are sorted in descending order of ESR1 amplification frequency, as detected. A: Prevalence of ESR1 amplification defined according to the diagnostic criteria for ERBB2 (HER2) amplification; B: Prevalence of ESR1 copy number increase including amplification and gain. For study citations see Appendices A-D. ESR1: Estrogen receptor alpha gene; MLPA: Multiplex ligation-dependent probe amplification; FISH: Fluorescence in situ hybridization; CISH: Chromogenic in situ hybridization.
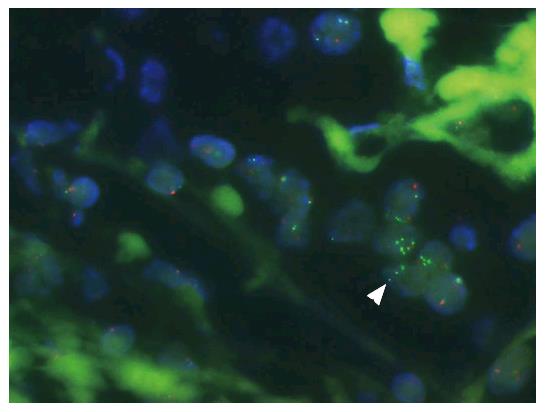
Figure 2 Heterogeneous estrogen receptor alpha gene amplification detected by fluorescence in situ hybridization analysis.
Green and red spots represent estrogen receptor alpha gene (ESR1) gene probe and centromere 6 probe, respectively. White arrowhead points to tumor cell nuclei (blue) with increased numbers of ESR1 fluorescence in situ hybridization signals next to tumor cell nuclei without increased numbers of signals. From Moelans et al[40].
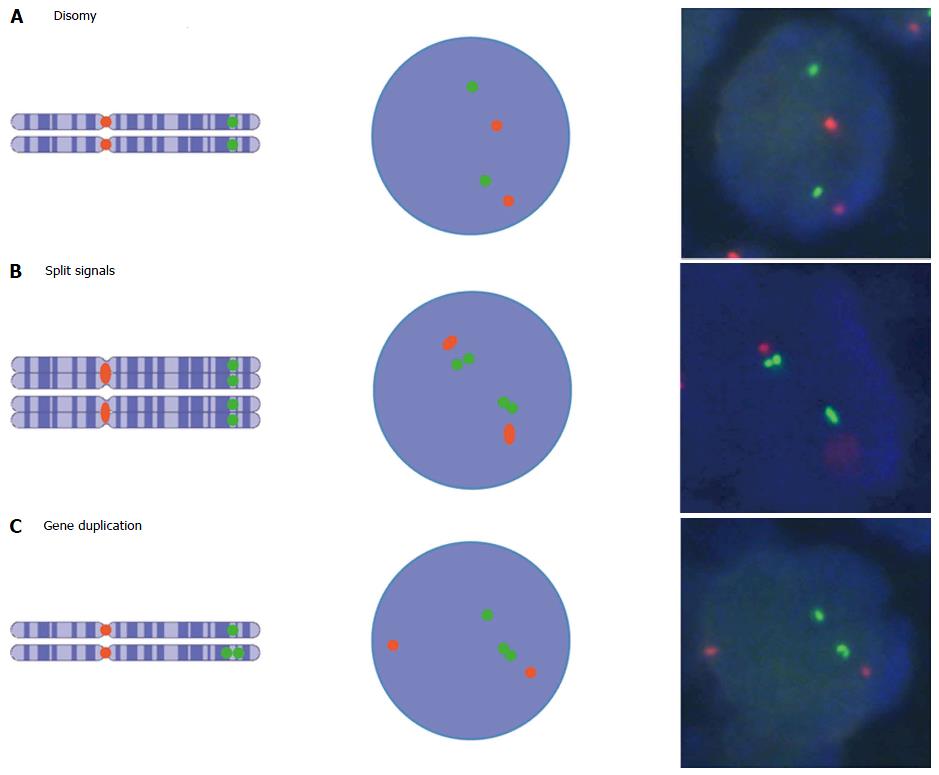
Figure 3 Estrogen receptor alpha gene single and split signal patterns and their supposed appearance as detected with fluorescence in situ hybridization assays.
Green and red spots represent estrogen receptor alpha gene gene probe and centromere 6 probe, respectively. A: Normal disomy with two chromosomes and two gene copies; B: Normal disomy after s-phase with four chromatids and four gene copies; C: Disomy harboring mono allelic gene duplication with two chromosomes and three gene copies[38]. Photos from Moelans et al[40].
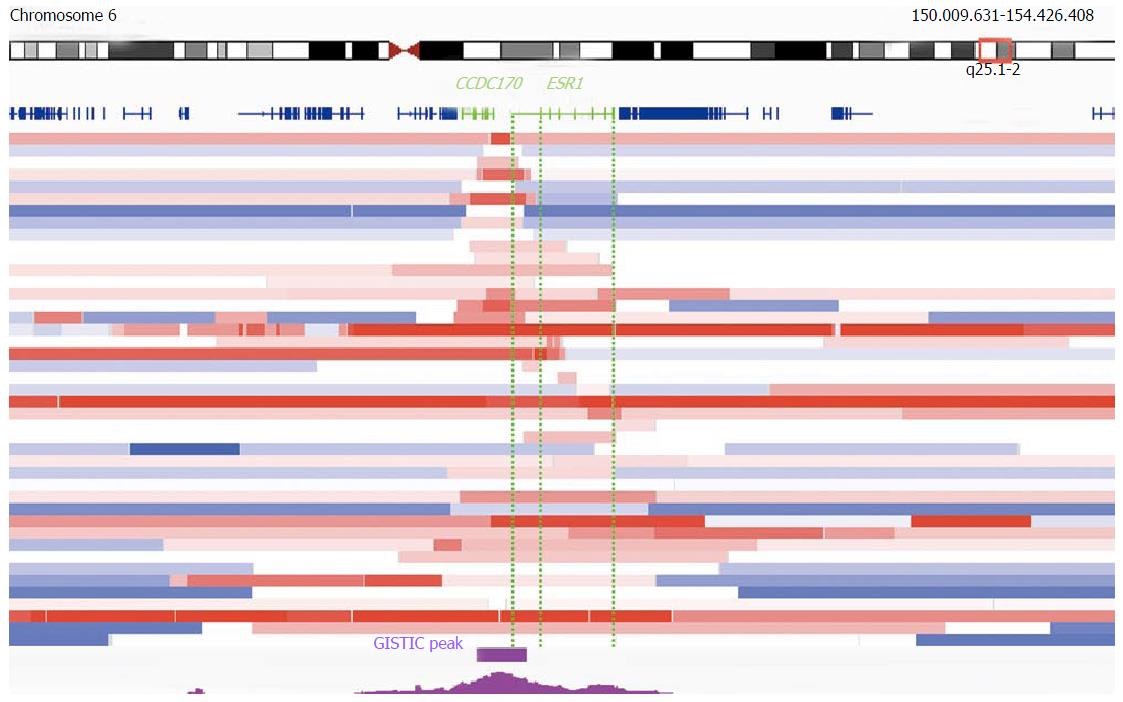
Figure 4 Architecture of the most focal estrogen receptor alpha gene amplifications in The Cancer Genome Atlas.
Segmented log2 gene copy number ratios in 43 TCGA breast cancers are represented as horizontal bars (red: increased, white: neutral/normal, blue: decreased/deleted). Focal amplifications within and smaller than the region that is 2 Mb up and downstream of estrogen receptor alpha gene (ESR1) (150.009.631-154.426.408 bp) and that harbor any amplified ESR1 sequences in relation to their flanking regions are shown. The 19 cases at the top of the figure show amplifications that overlap any CCDC170 sequences and only parts of ESR1. In the lower 24 cases, the amplicon includes either the full ESR1 sequence, or parts of ESR1 without overlapping CCDC170. Positions of genes are indicated in dark blue; ESR1 as well as CCDC170 are highlighted in green. Dotted green lines indicate regions of ESR1 with (right) or without (left) translated exons. The position of the GISTIC-log10 q-value peak is indicated in magenta. The position of the significant GISTIC q-value (< 0.25) region is indicated as a separate magenta colored bar (95%CI)[52,83,86]. TCGA: The Cancer Genome Atlas; GISTIC: Genomic Identification of Significant Targets in Cancer.
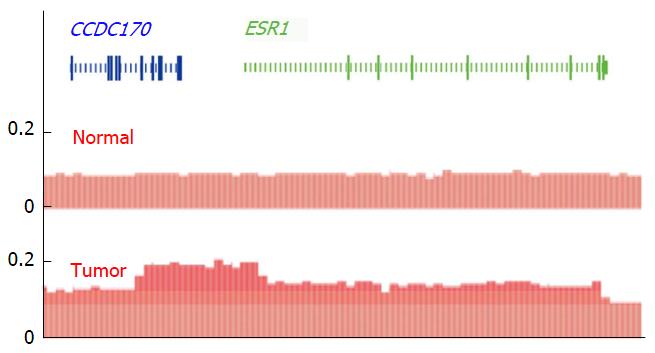
Figure 5 Estrogen receptor alpha gene amplification in a breast cancer tumor responding to estradiol treatment.
DNA copy number profiles (red) in relation to the genomic position of CCDC170 (blue) and estrogen receptor alpha gene (ESR1) (green) in normal and a breast cancer tumor tissue that harbors amplification of the ESR1 gene. The amplified DNA sequence extends from CCDC170 throughout the promoter region and the coding sequence of ESR1. The mapping of amplification was performed using read counts obtained during whole genome sequencing. Read counts above normal and max reads including ESR1 are indicated in increased darker red shading. Data and graphic illustration according to Li et al[89].
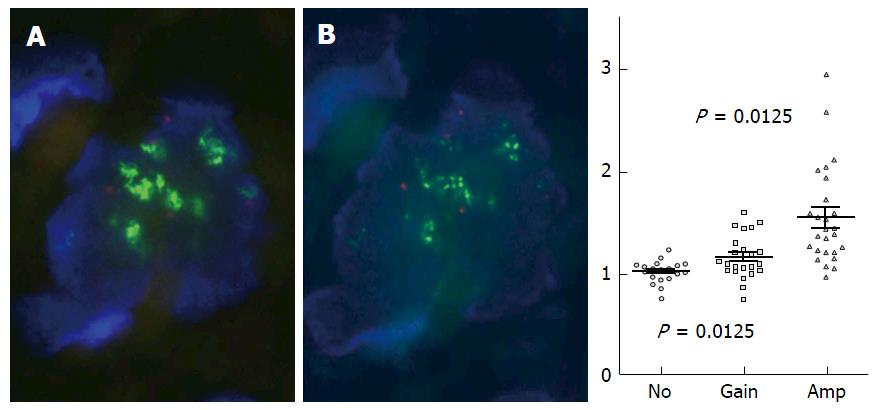
Figure 6 Effect of RNase treatment on fluorescence in situ hybridization signal patterns.
RNase pretreatment resulted in a higher fraction of tumor cells that showed point-shaped fluorescence in situ hybridization (FISH) signals, when fuzzy clouds of estrogen receptor alpha gene (ESR1) signals detected by standard FISH were eliminated (A). ESR1 copy number ratios determined by multiplex ligation-dependent probe amplification (MLPA) (y-axis) of “not increased”ESR1 copy number (no), ESR1 copy number gain (gain) and ESR1 amplification (amp) determined by FISH (x-axis) according to ERBB2 (HER2) testing criteria (B). Results suggest an association of increased DNA copies of ESR1 determined by MLPA with increased ESR1 signals detected by FISH (B). MLPA ratios of groups “no” and “amp” as well as of “no” and “gain” are significantly different (see dot plot). Modified from Moelans et al[40].
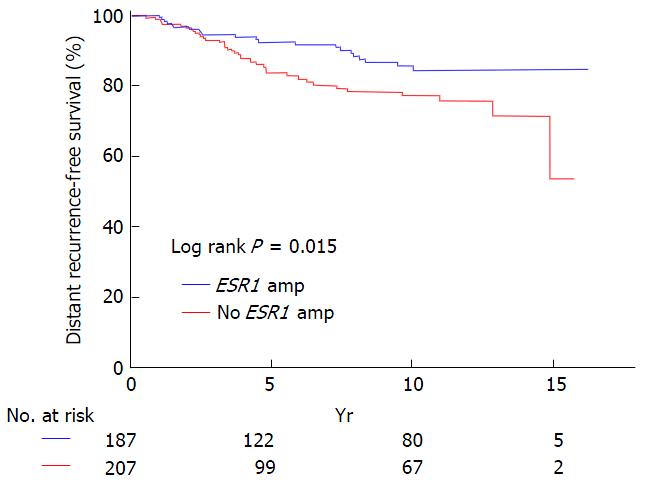
Figure 7 Kaplan-Meier plot for distant recurrence-free survival of 394 breast cancer patients treated with Tamoxifen.
Patients with (blue) and without (red) estrogen receptor alpha gene amplification in primary tumor. From Singer et al[41].
- Citation: Holst F. Estrogen receptor alpha gene amplification in breast cancer: 25 years of debate. World J Clin Oncol 2016; 7(2): 160-173
- URL: https://www.wjgnet.com/2218-4333/full/v7/i2/160.htm
- DOI: https://dx.doi.org/10.5306/wjco.v7.i2.160


