Copyright
©2014 Baishideng Publishing Group Inc.
World J Clin Oncol. Dec 10, 2014; 5(5): 1068-1077
Published online Dec 10, 2014. doi: 10.5306/wjco.v5.i5.1068
Published online Dec 10, 2014. doi: 10.5306/wjco.v5.i5.1068
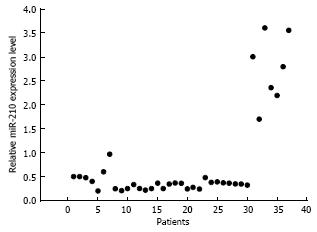
Figure 1 MiR-210 expression in selected oesophageal squamous cell carcinoma patients.
The level of MiR-210 expression in an oesophageal squamous cell carcinoma tumour tissue was related to the level in that patient’s para-tumorous normal oesophageal tissue.
Figure 2 MiR-210 reverses the radioresistance of TE-1R cells.
A: Clonal formation of TE-1R cells that were transfected with the miR-210 mimic (pmiR-210) or with a nonsense sequence (Ctrl) after irradiation at 0, 4 or 8 Gy of 10 mV X-rays. The experiments were performed in triplicate; B: Cell survival curve for TE-1R cells that were transfected with the miR-210 mimic (pmiR-210) or with a nonsense sequence (Ctrl). The cell survival rates were plotted on a logarithmic scale.
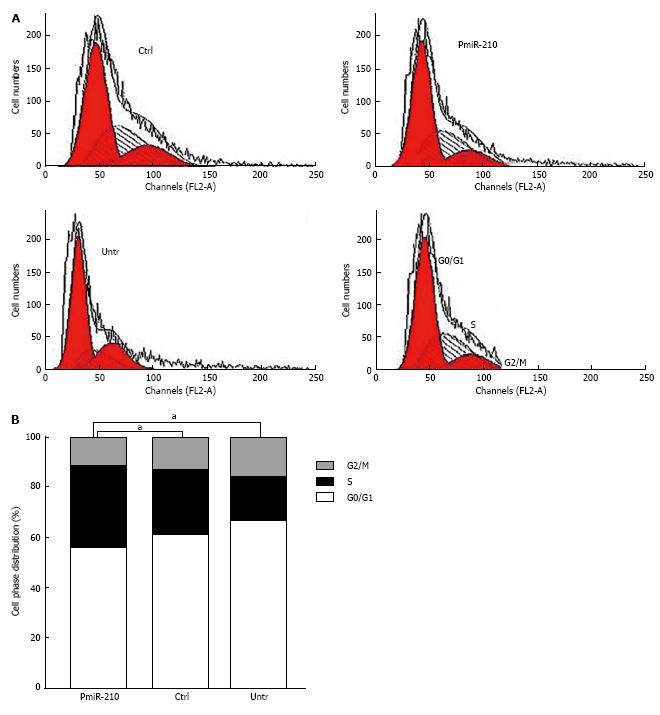
Figure 3 S-phase arrest in miR-210 up-regulated radioresistant oesophageal squamous cell carcinoma cells.
A: Flow cytometry was used to determine the distribution of the cells according to the phases of the cell cycle. All of the cells were uni-irradiated at 6 Gy and analysed 24 h later. The experiments were performed in triplicate. PmiR-210: Transfected with pmiR-210. Ctrl: Transfected with a nonsense sequence. Untr: Untreated; B: Histogram showing the cell cycle distribution of the cells. The fractions of cells in S phase were compared. aP < 0.05, pmiR-210 vs Ctrl or Untr.
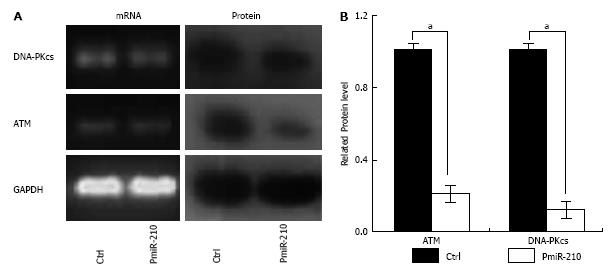
Figure 4 Double-strand break-related changes in protein expression in miR-210 up-regulated radioresistant oesophageal squamous cell carcinoma cells.
A: The expression levels of ataxia telangiectasia mutated (ATM) and DNA dependent protein kinase (DNA-PKcs) in transfected and control TE-1R cells. The mRNA levels were determined using reverse transcription-polymerase chain reaction. The protein levels were determined using Western blot. The experiments were performed in triplicate. Glyceraldehyde-3-phosphate dehydrogenase (GAPDH) was used as the internal reference; B: Histogram showing the levels of ATM and DNA-PKcs protein expression in transfected and control TE-1R cells. aP < 0.05, pmiR-210 vs Ctrl.
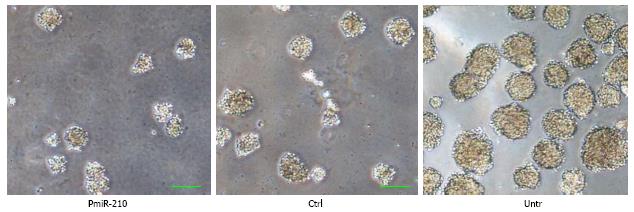
Figure 5 Cell sphere formation of pmiR-210 cells after irradiation (bar: 100 μm).
PmiR-210: Transfected with pmiR-210; Ctrl: Transfected with a nonsense sequence; Untr: Untreated. Cell spheres were allowed to form in serum-free medium for 7 d after 4-Gy radiation. The diameter and number of pmiR-210 cell spheres were the smallest among those of the three types of cells. Bar, 100 μm.
- Citation: Chen X, Guo J, Xi RX, Chang YW, Pan FY, Zhang XZ. MiR-210 expression reverses radioresistance of stem-like cells of oesophageal squamous cell carcinoma. World J Clin Oncol 2014; 5(5): 1068-1077
- URL: https://www.wjgnet.com/2218-4333/full/v5/i5/1068.htm
- DOI: https://dx.doi.org/10.5306/wjco.v5.i5.1068


