Copyright
©2014 Baishideng Publishing Group Co.
World J Clin Oncol. May 10, 2014; 5(2): 191-193
Published online May 10, 2014. doi: 10.5306/wjco.v5.i2.191
Published online May 10, 2014. doi: 10.5306/wjco.v5.i2.191
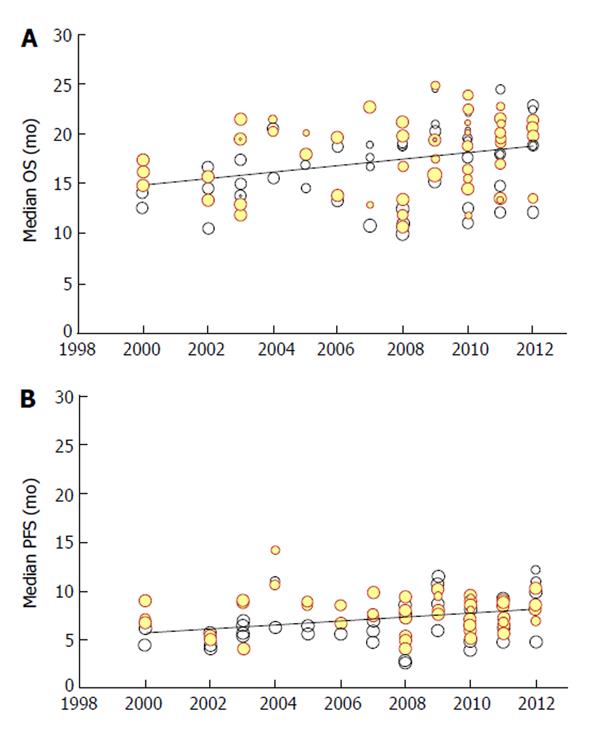
Figure 1 Meta-regression: temporal trend of medians for overall survival (A) and progression-free survival (B).
These graphs refer to 130 treatment arms from 52 randomized studies. The regression lines were the following: A:Median (mo) = 0.331 × yr - 674.138 (P < 0.001); B: Median (mo) = 0.2026 × yr - 399.538 (P < 0.001). Symbols: each study is represented by a circle, the area of which is proportional to its statistical weight. Experimental arms are depicted in red while control arms are in black. OS: Overall survival; PFS: Progression-free survival.
- Citation: Messori A, Conti M, Fadda V, Maratea D, Trippoli S. Meta-regression of treatments for metastatic colorectal cancer: Quantifying incremental benefit from 2000 to 2012. World J Clin Oncol 2014; 5(2): 191-193
- URL: https://www.wjgnet.com/2218-4333/full/v5/i2/191.htm
- DOI: https://dx.doi.org/10.5306/wjco.v5.i2.191


