Copyright
©2012 Baishideng Publishing Group Co.
World J Clin Oncol. Apr 12, 2012; 3(4): 63-66
Published online Apr 12, 2012. doi: 10.5306/wjco.v3.i4.63
Published online Apr 12, 2012. doi: 10.5306/wjco.v3.i4.63
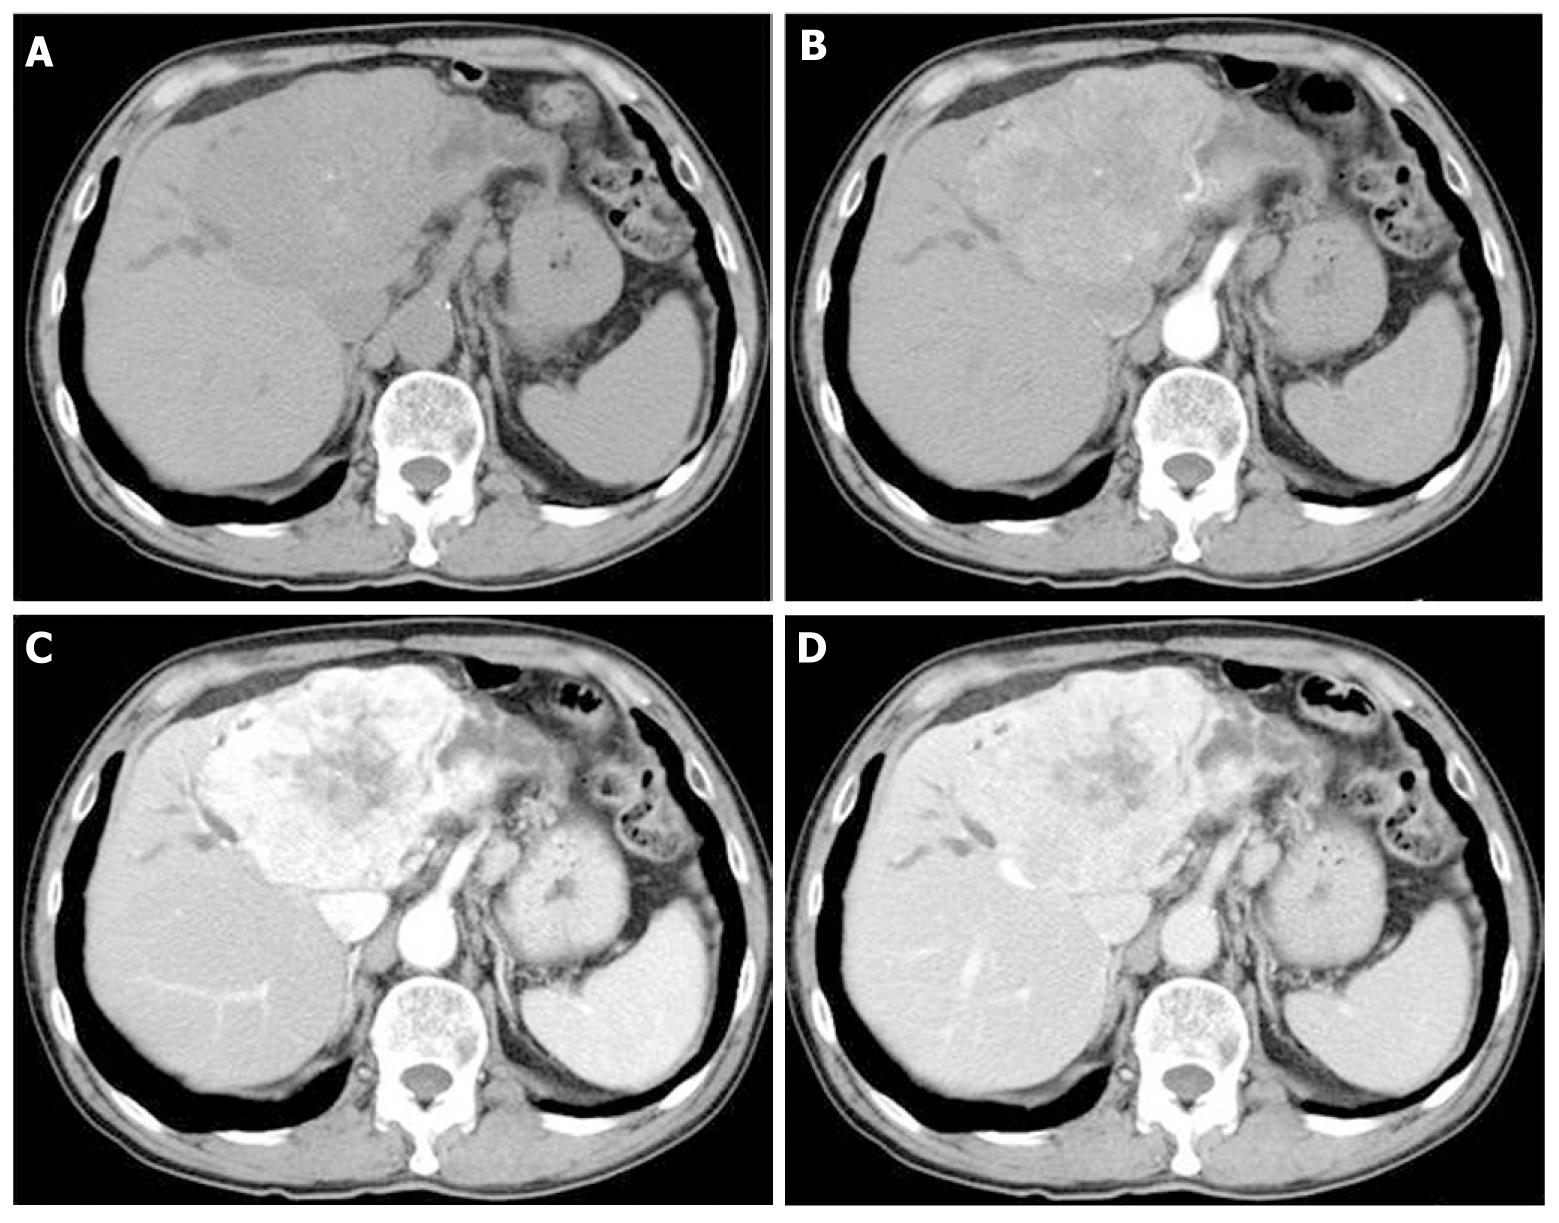
Figure 1 Unenhanced and enhanced computed tomography images.
A: Plain; B: Arterial phase; C: Equilibrium phase; D: Venous phase. Enhanced abdominal computed tomography scan showed a tumor of 92 mm × 61 mm in the left liver lobe, with dilatation of the peripheral bile duct. In addition, tumor showed more heterogeneous enhancement in the venous phase.
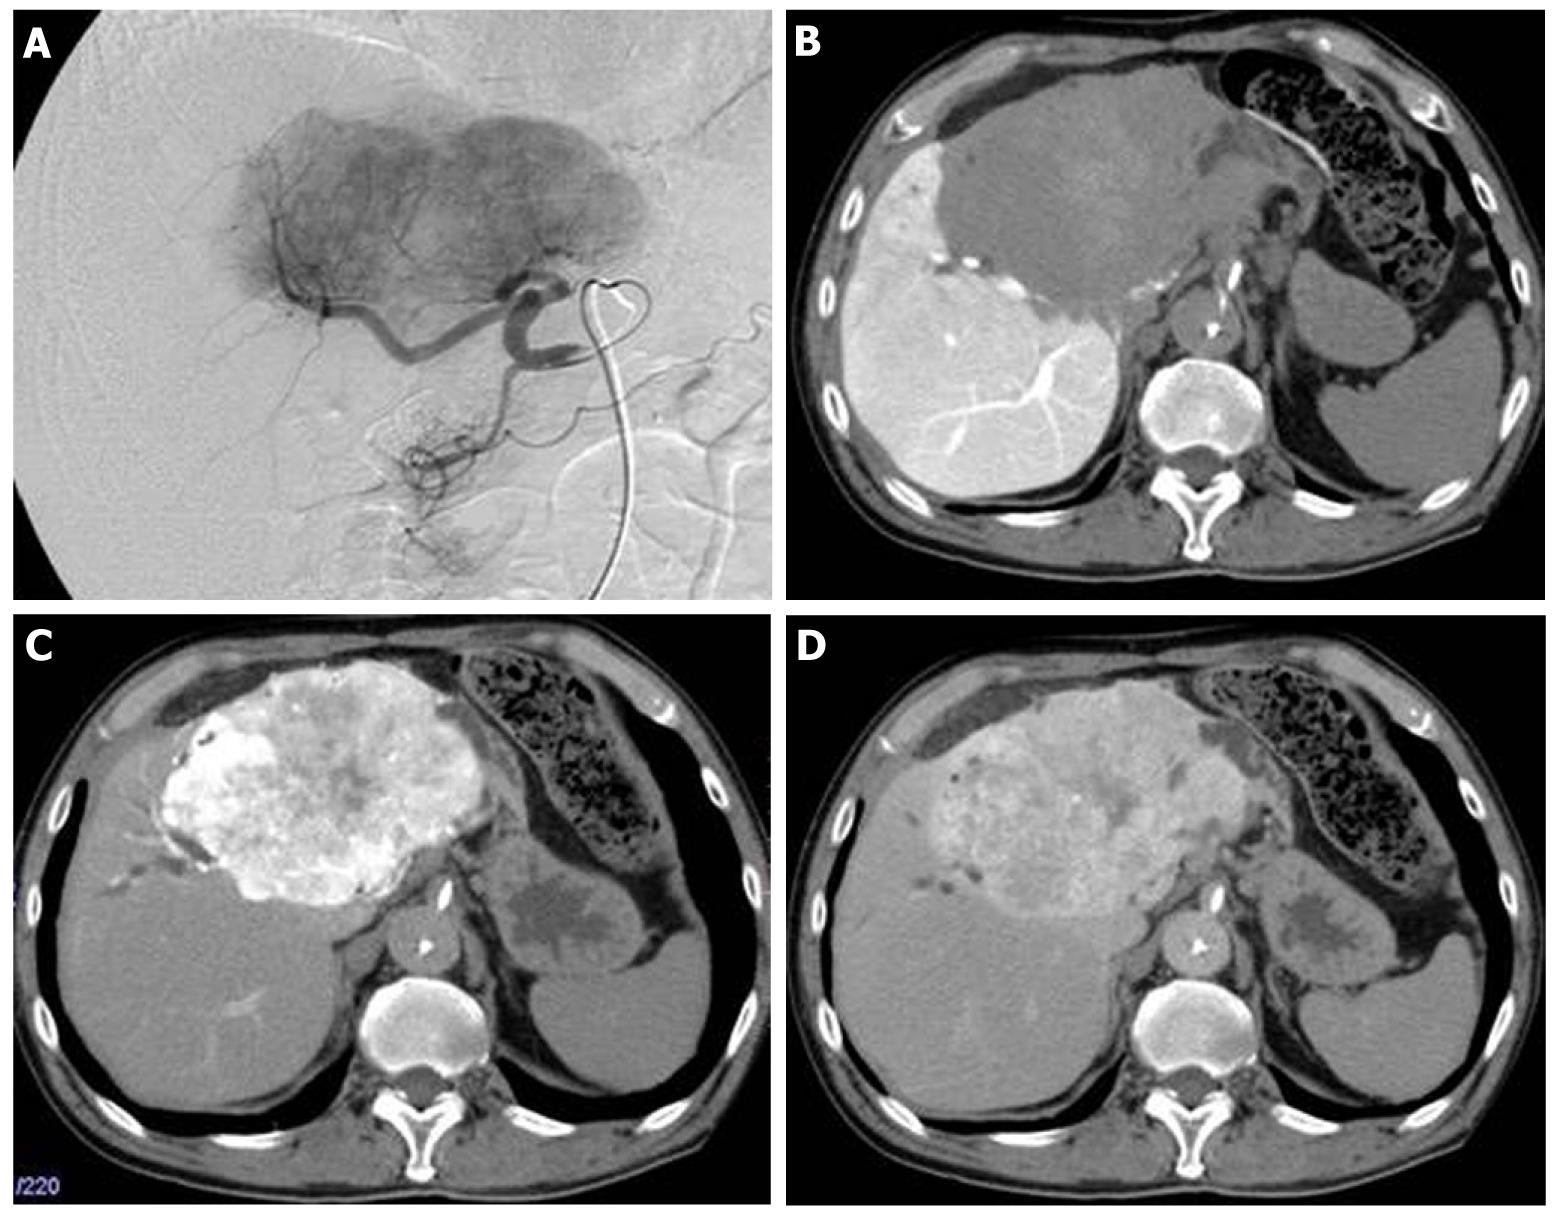
Figure 2 Follow-up hepatic arterial angiography and computed tomography images after 7 years.
A: Hepatic arterial angiography showed hypervascular tumor of left liver lobe; B: Computed tomography (CT) angiography (portal phase) showed portal vascularity defect in the tumor; C-D: CT angiography (C: Arterial early phase; D: Arterial late phase) showed hypervascularity and a persistent enhancement effect.
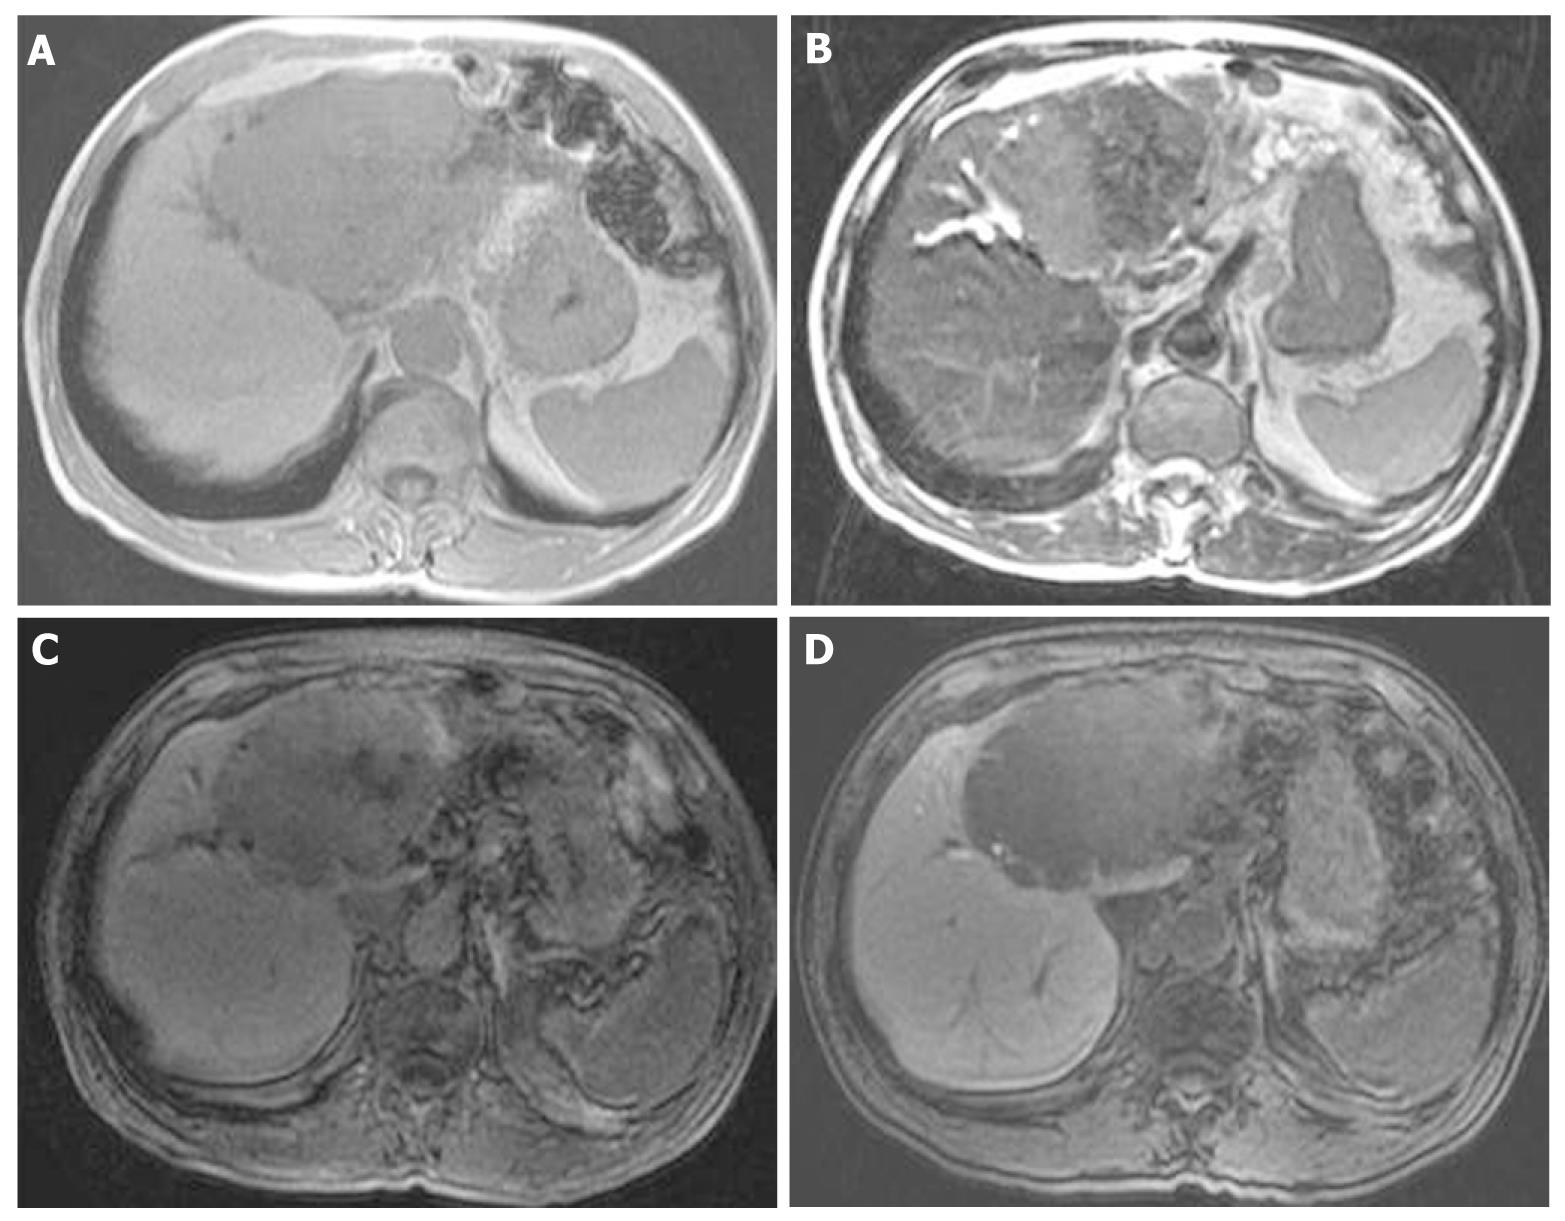
Figure 3 Follow-up magnatic resonance image images after 7 years.
A: Large tumor of left lobe showed low intensity on T1-weighted images; B: Large tumor of left lobe showed heterogeneous high intensity on T2-weighted images; C-D: Large tumor of left lobe showed relative hypointensity in comparison with normal liver parenchyma on equilibrium and hepatobiliary phase of contrast-enhanced EOB magnatic resonance image.
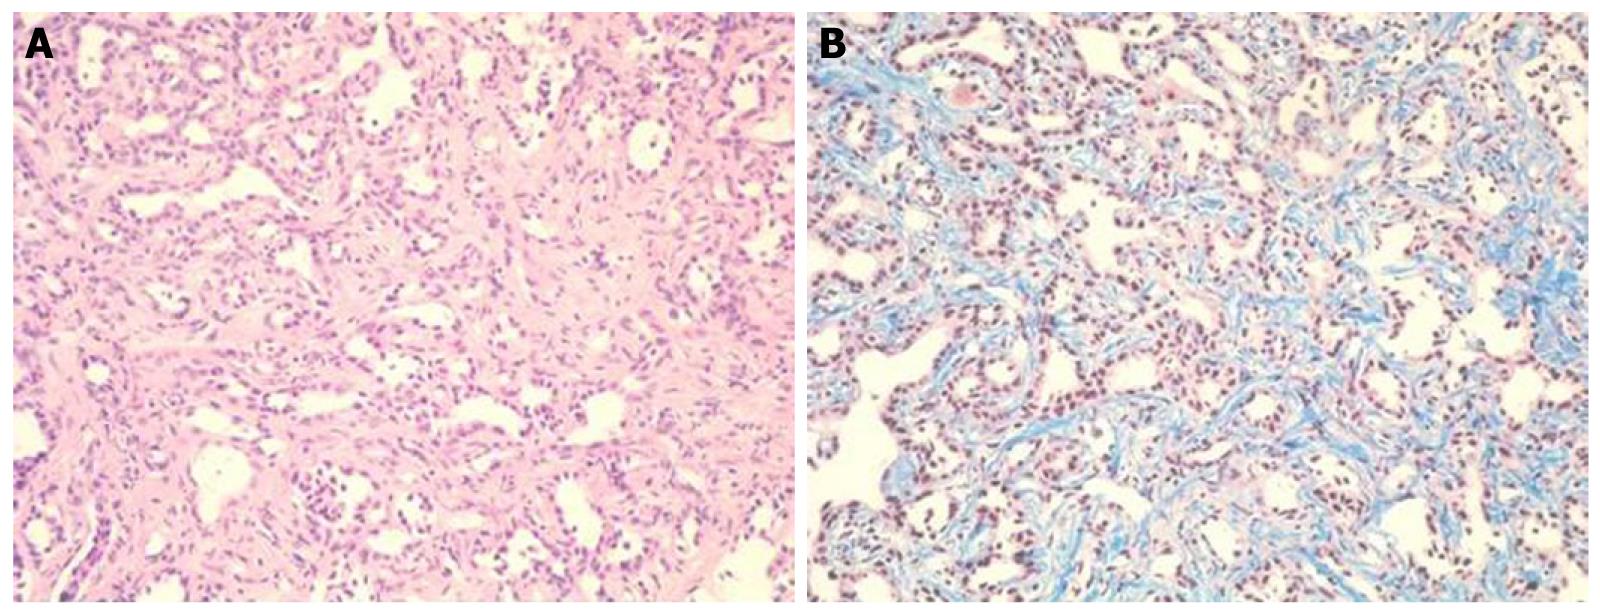
Figure 4 Tumor biopsy findings.
Tumor consisted of small heterogeneous tubular ducts with fibrous tissues, without cell atypia or mitotic activity. A: Hematoxylin and eosin stain (× 400); B: Masson trichrome stain (× 400).
- Citation: Koga F, Tanaka H, Takamatsu S, Baba S, Takihara H, Hasegawa A, Yanagihara E, Inoue T, Nakano T, Ueda C, Ono W. A case of very large intrahepatic bile duct adenoma followed for 7 years. World J Clin Oncol 2012; 3(4): 63-66
- URL: https://www.wjgnet.com/2218-4333/full/v3/i4/63.htm
- DOI: https://dx.doi.org/10.5306/wjco.v3.i4.63


