Copyright
©2011 Baishideng Publishing Group Co.
World J Clin Oncol. Jul 10, 2011; 2(7): 289-298
Published online Jul 10, 2011. doi: 10.5306/wjco.v2.i7.289
Published online Jul 10, 2011. doi: 10.5306/wjco.v2.i7.289
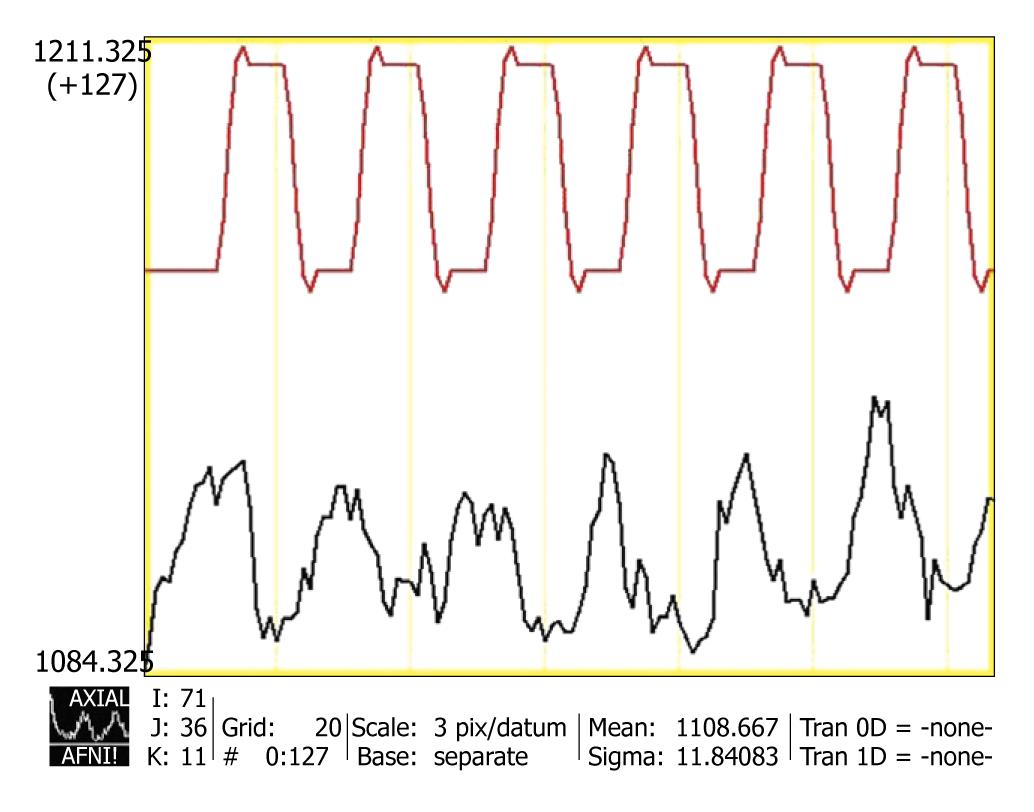
Figure 1 Magnetic resonance signal time series (black line) in an activated voxel.
Subject was engaged in a language phonemic task over a time period of 260 s. The red line curve represents the ideal hemodynamic response function the voxel time series was fitted to. Very good correlation between the two curves can be easily seen. AFNI software (afni.nimh.nih.gov) was used for data processing.
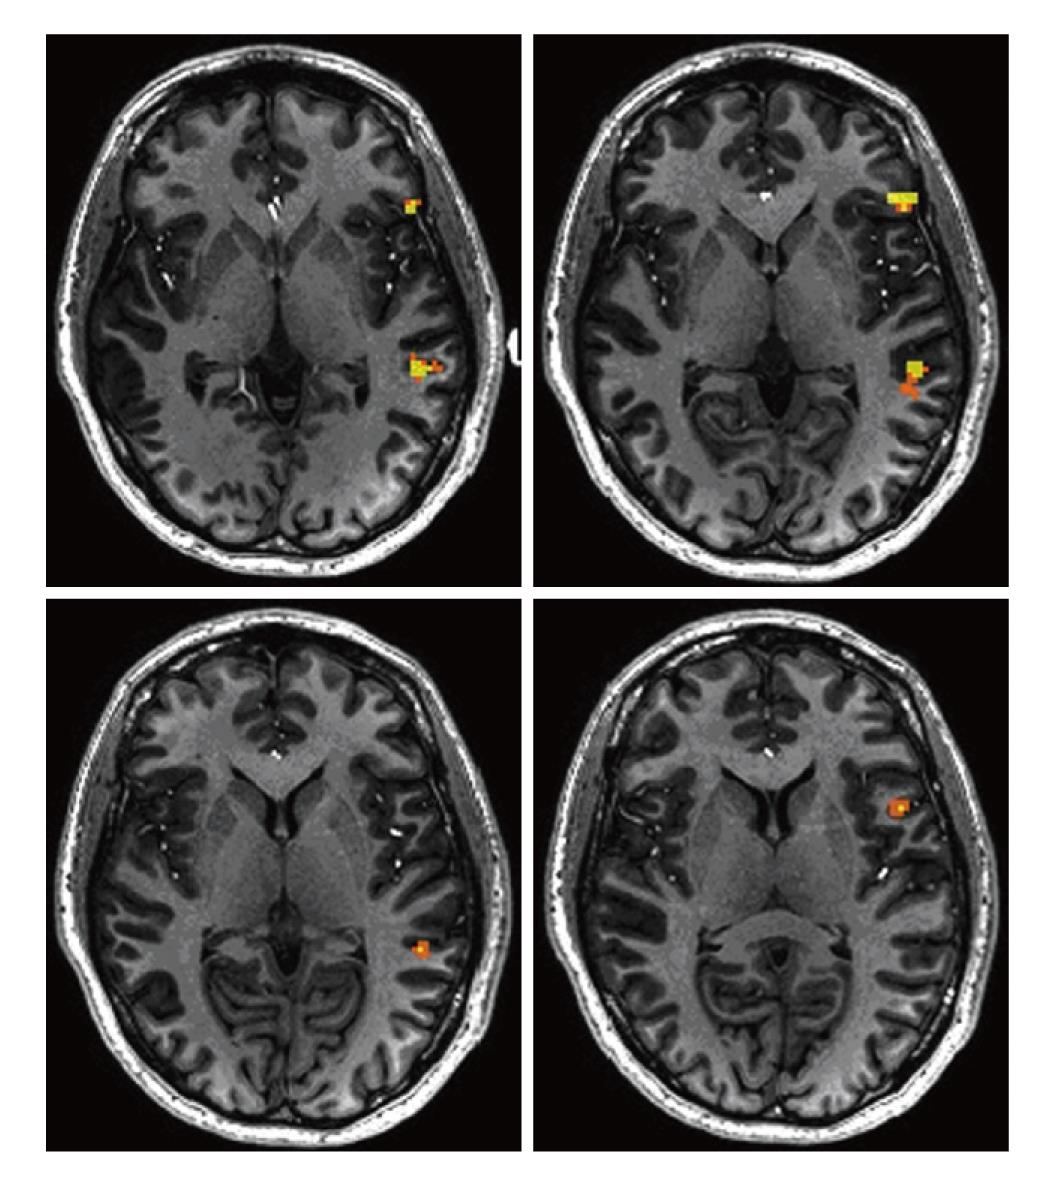
Figure 2 Activation (colored voxels) in the Broca’s and Wernicke’s areas in a normal subject performing a phonemic fluency task.
The t-score map was thresholded at 4.0 value (P < 0.001) and superimposed on a high resolution T1 weighted MPRAGE image. AFNI software (afni.nimh.nih.gov) was used for data processing.
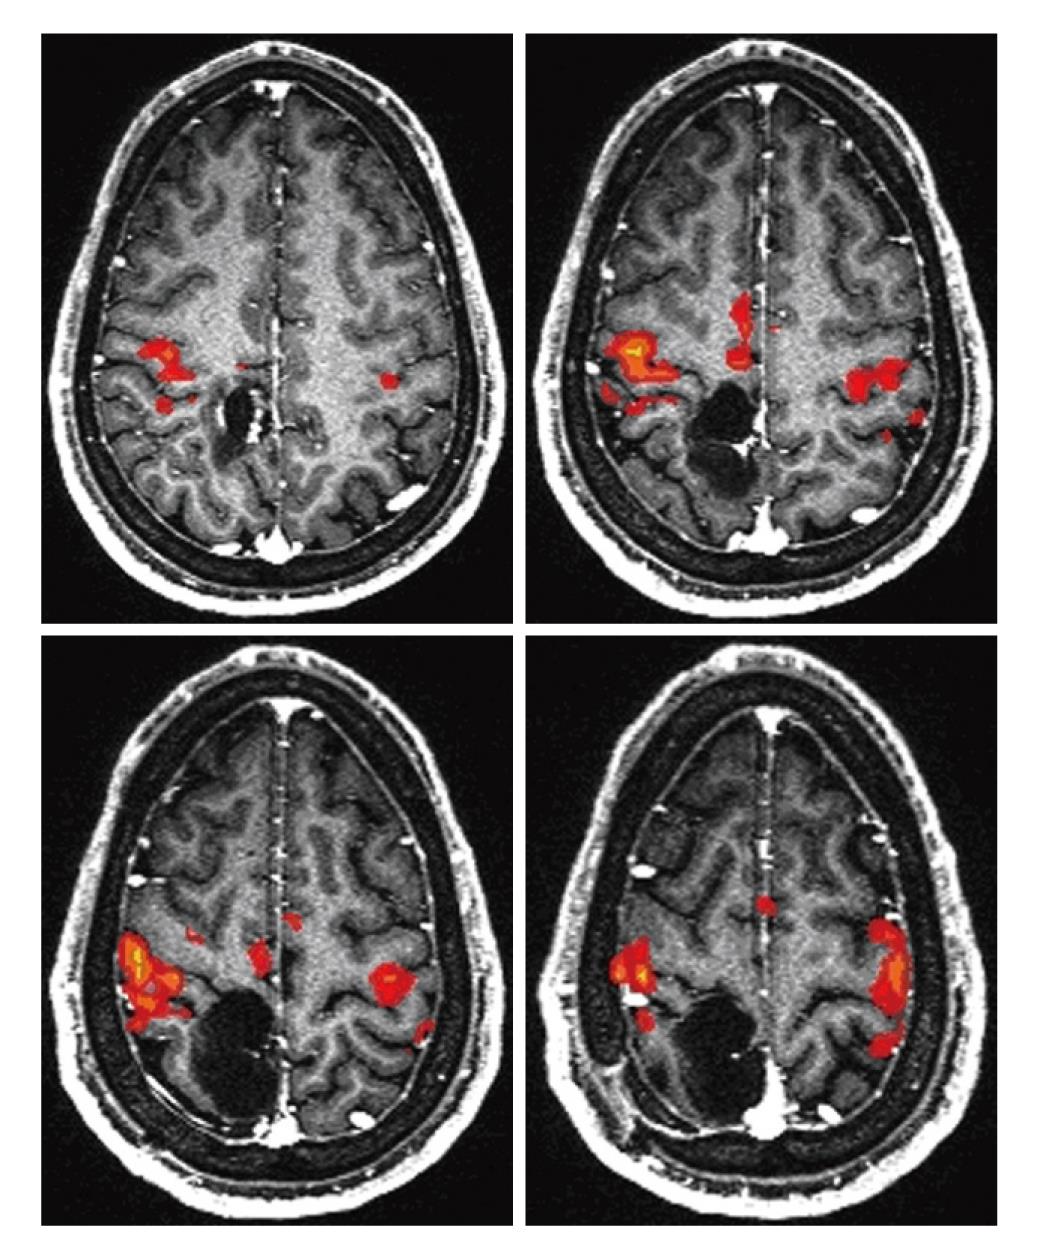
Figure 3 Hand Motor mapping in a patient with a lesion located in the right perirolandic region.
Images were acquired on a 3 T magnetic resonance imaging scanner. AFNI software (afni.nimh.nih.gov) was used for data processing.
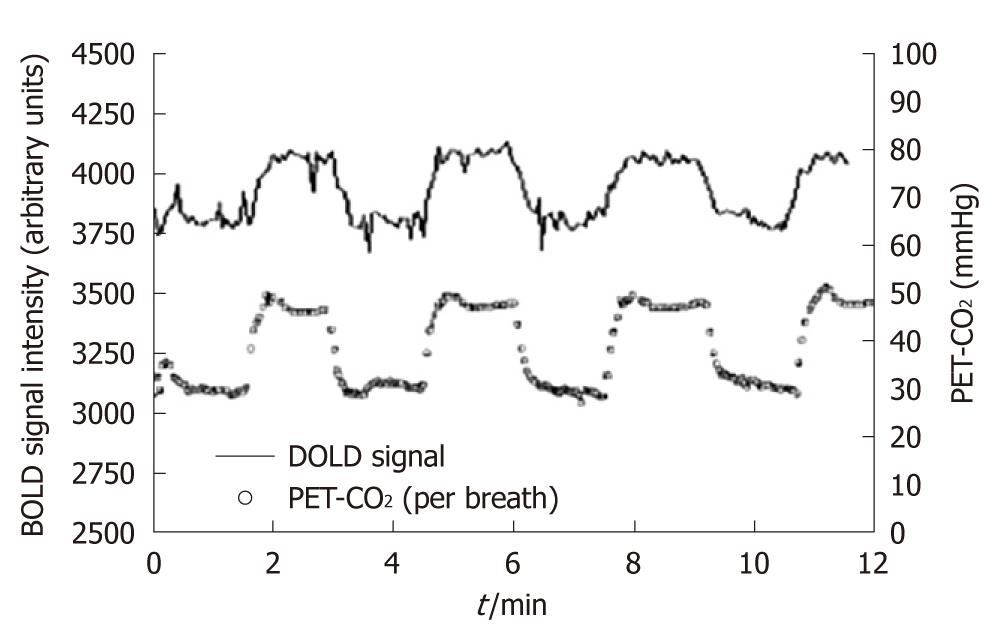
Figure 4 Example of cerebrovascular reactivity measurement using administration of air with altered CO2 or O2 levels: after time shifting the Blood Oxygen Level Dependent signal pattern closely follows pressure of end-tidal CO2 (end tidal pressure of carbon dioxide) pattern (from Vesely et al[69]).
Blood Oxygen Level Dependent magnetic resonance imaging and pressure of end-tidal CO2 (PET-CO2) signals are reported in arbitrary units. BOLD: Blood Oxygen Level Dependent.
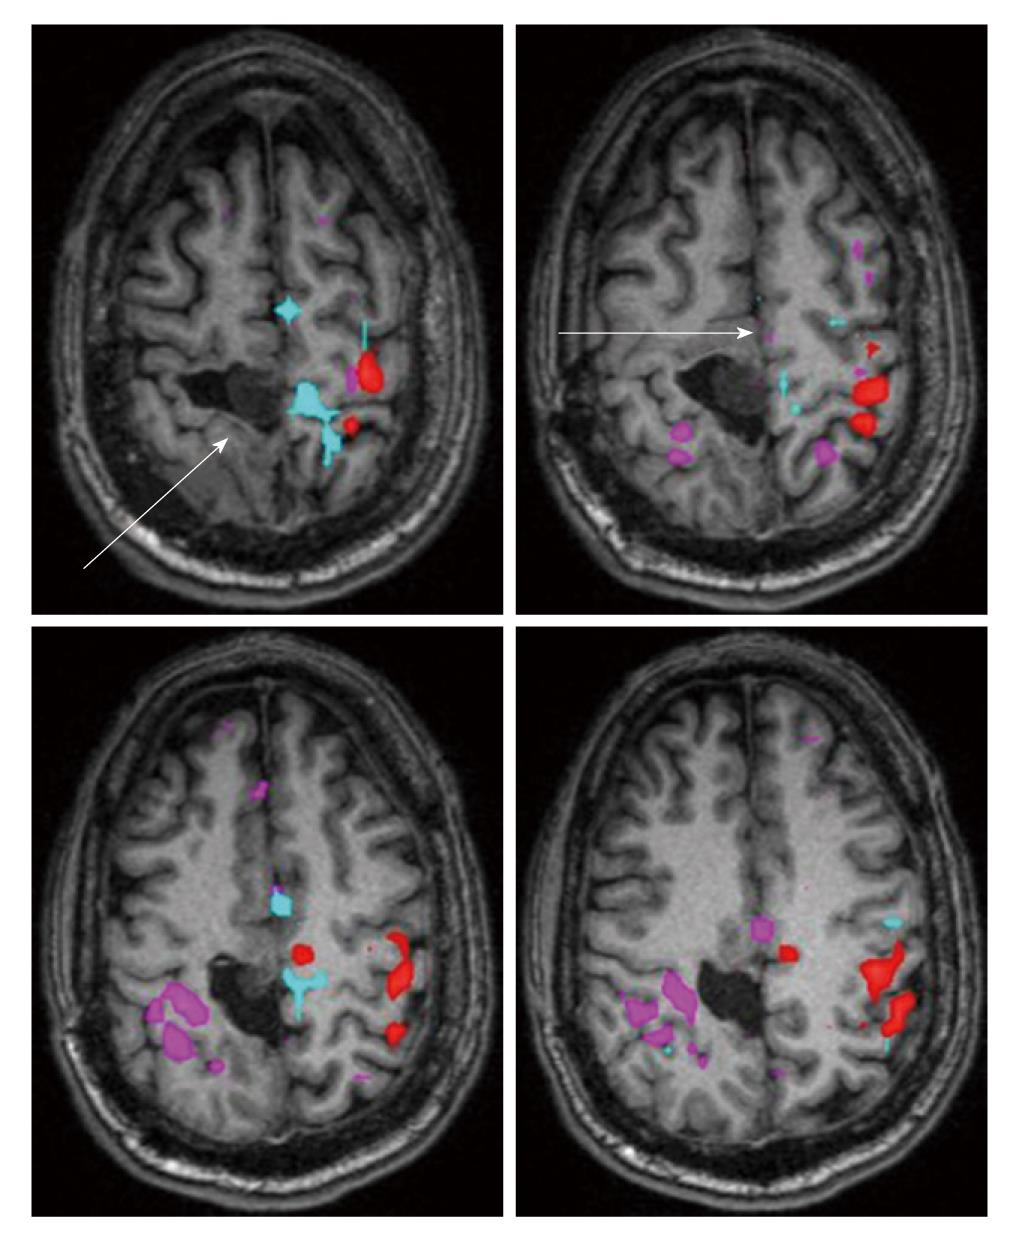
Figure 5 Color coding of Blood Oxygen Level Dependent activation map, overlaid on noncontrast T1-weighted 3D MPRAGE axial images, is as follows: magenta refers to left hand motor task activation (hand opening/closing), thresholded at a T value of 4.
6, while red refers to the right hand motor task, thresholded at a T value of 4.5, and cyan/light blue refers to bilateral foot motor task (toe flexion/extension), thresholded at a clustered cross-correlation value of 0.50. Note the striking absence of any activation on the foot motor task in the foot representation area of the right (ipsilesional) primary motor cortex as well as absence of activation in the superior frontal gyrus (supplementary motor area), while the contralateral homologous regions demonstrate expected activation, as seen color-coded in cyan.
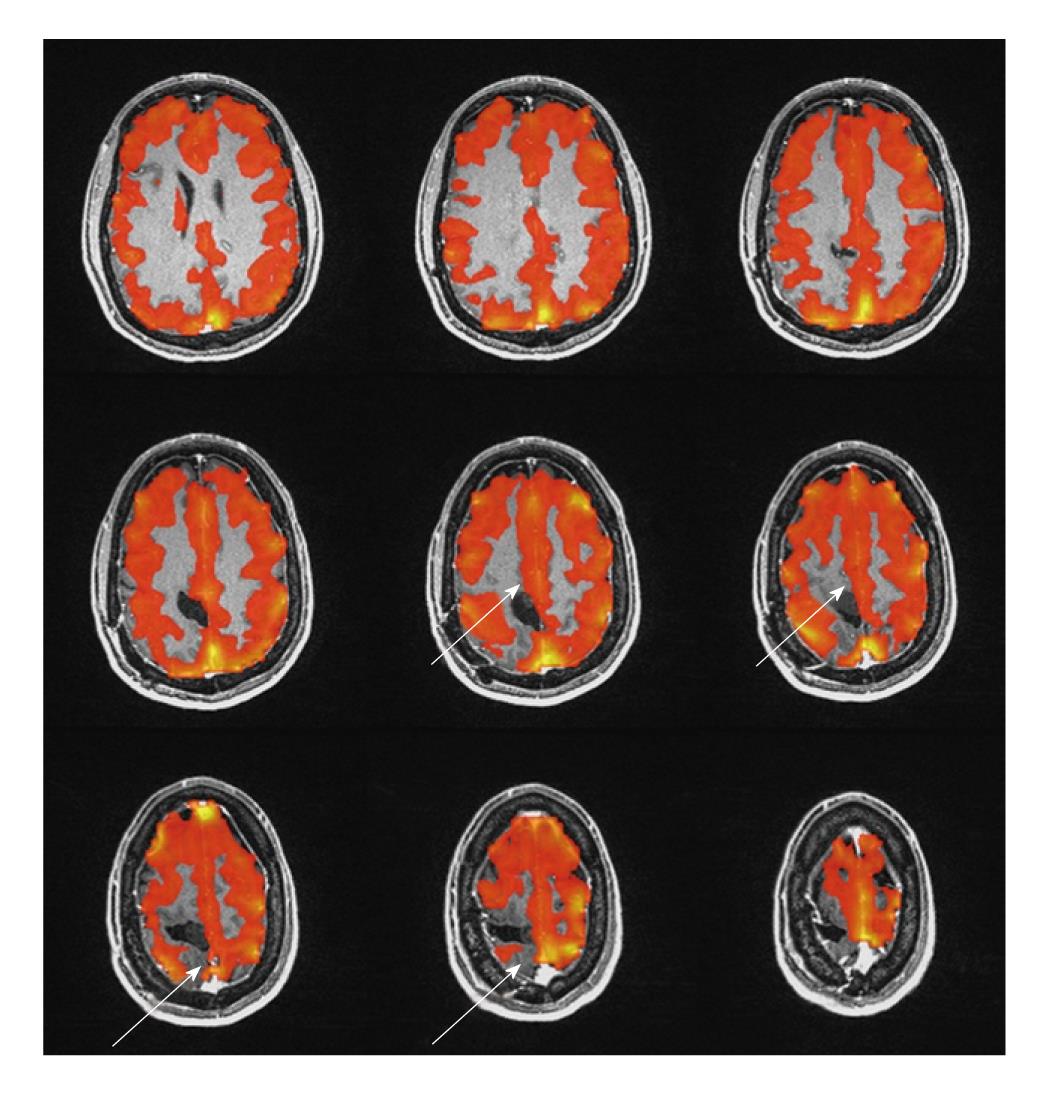
Figure 6 Blood Oxygen Level Dependent breath-hold cerebrovascular reactivity map, overlaid on postcontrast 3D MPRAGE anatomic axial images.
The Blood Oxygen Level Dependent cerebrovascular reactivity (CVR) map was thresholded at positive 0.25% signal change. Note the absence of CVR just anterior and posterior to the surgical resection cavity in the right frontal convexity (in the expected location of the foot representation area of the primary motor cortex, as well as decreased CVR along the medial right frontal convexity, corresponding to the supplementary motor area.
- Citation: Zaca D, Hua J, Pillai JJ. Cerebrovascular reactivity mapping for brain tumor presurgical planning. World J Clin Oncol 2011; 2(7): 289-298
- URL: https://www.wjgnet.com/2218-4333/full/v2/i7/289.htm
- DOI: https://dx.doi.org/10.5306/wjco.v2.i7.289


