Copyright
©2011 Baishideng Publishing Group Co.
World J Clin Oncol. May 10, 2011; 2(5): 217-224
Published online May 10, 2011. doi: 10.5306/wjco.v2.i5.217
Published online May 10, 2011. doi: 10.5306/wjco.v2.i5.217
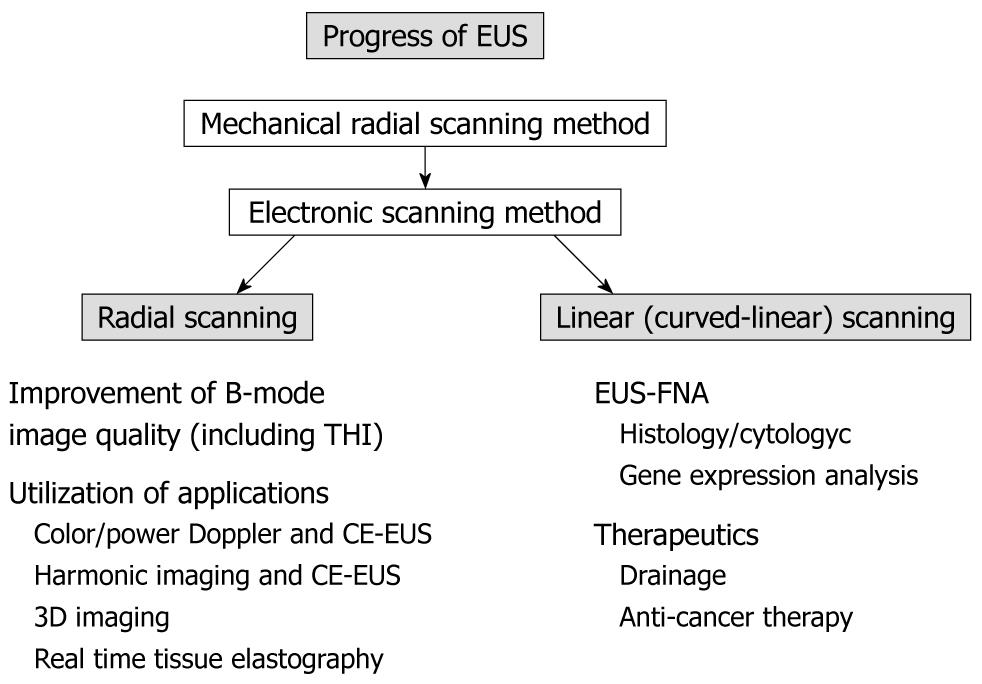
Figure 1 Progress of endoscopic ultrasonography.
In the early 2000s, mainstream use of endoscopic ultrasonography (EUS) changed from a mechanical radial scanning method to an electronic radial or electronic linear scanning method, which enabled the endosonographer to make use of many applications. FNA: Fine needle aspiration; THI: Tissue harmonic imaging; CE-EUS: Contrast-enhanced EUS; 3D: Three-dimensional.
Figure 2 Branch-duct type intraductal papillary mucinous neoplasm.
A: An mechanical radial scanning endoscopic ultrasonography (EUS) image could not depict the mural nodule due to a near field artifact; B, C: Electronic radial scanning EUS images revealed a mural nodule about 10 mm in diameter; C: The image was made more sophisticated by tissue harmonic imaging (THI) technology, which brought a clearer ultrasonographic image by omitting acoustic artifacts.
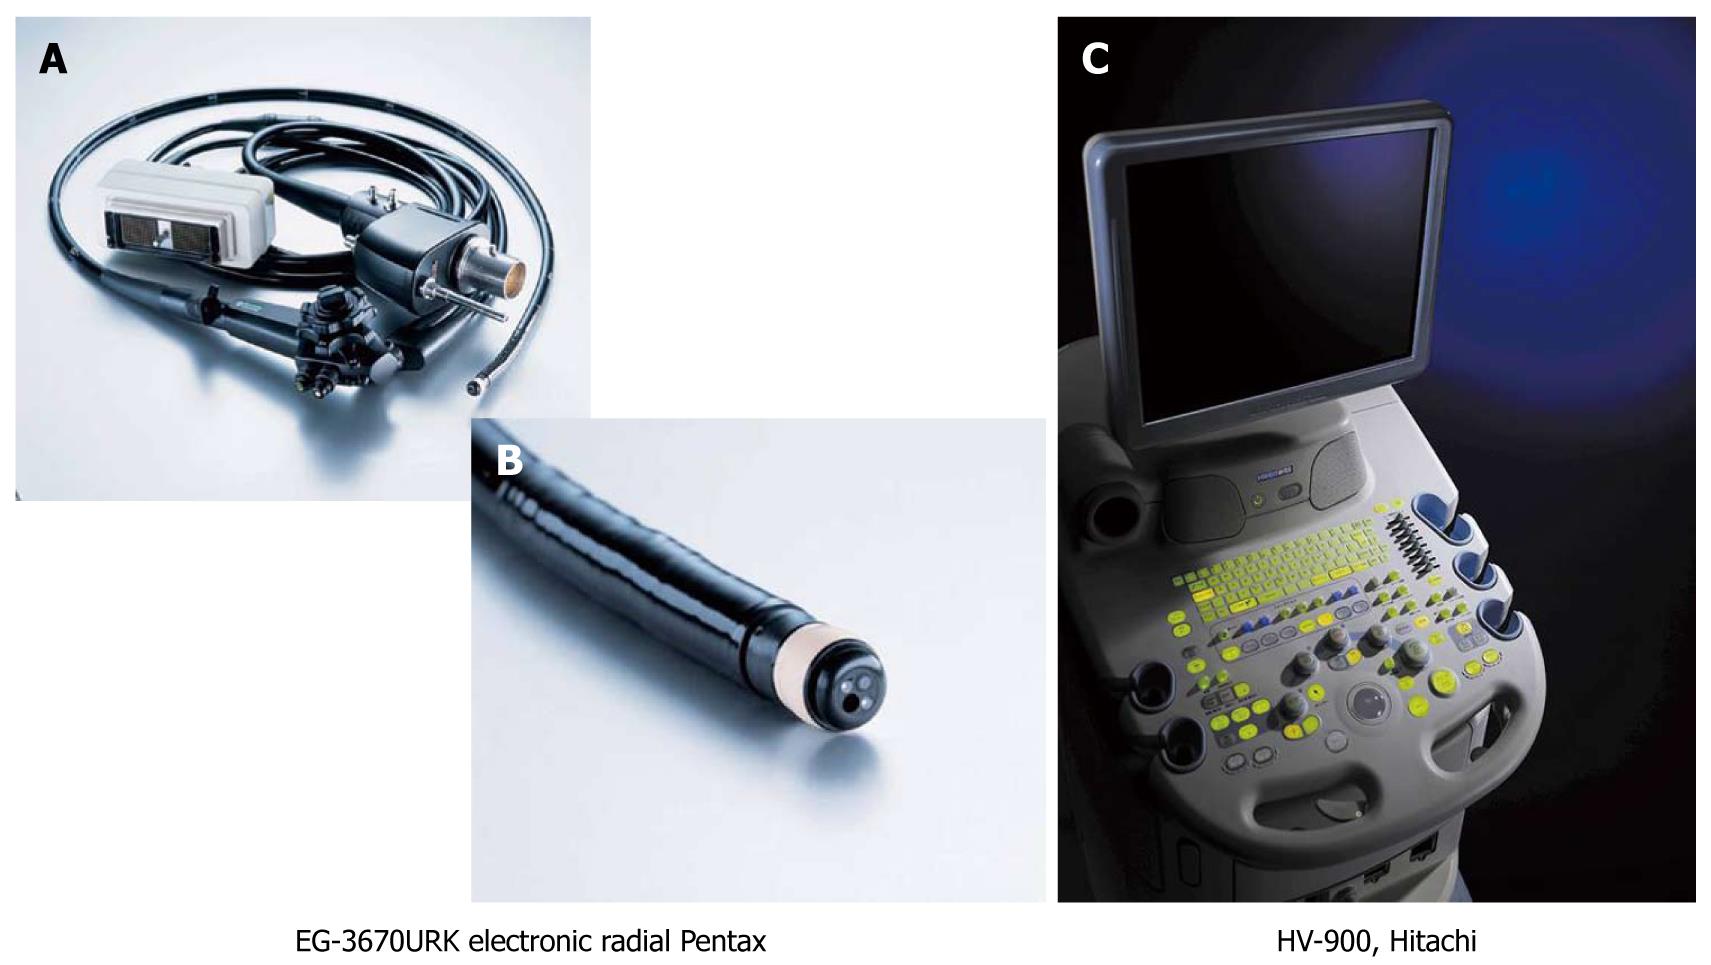
Figure 3 Endoscope and ultrasound machine (Setting-1).
A, B: The images indicate the whole view of the Pentax endosonoscope (EG-3670URK) and the tip of the scope; C: The image shows the ultrasound machine (HV-900, Hitachi, Japan).
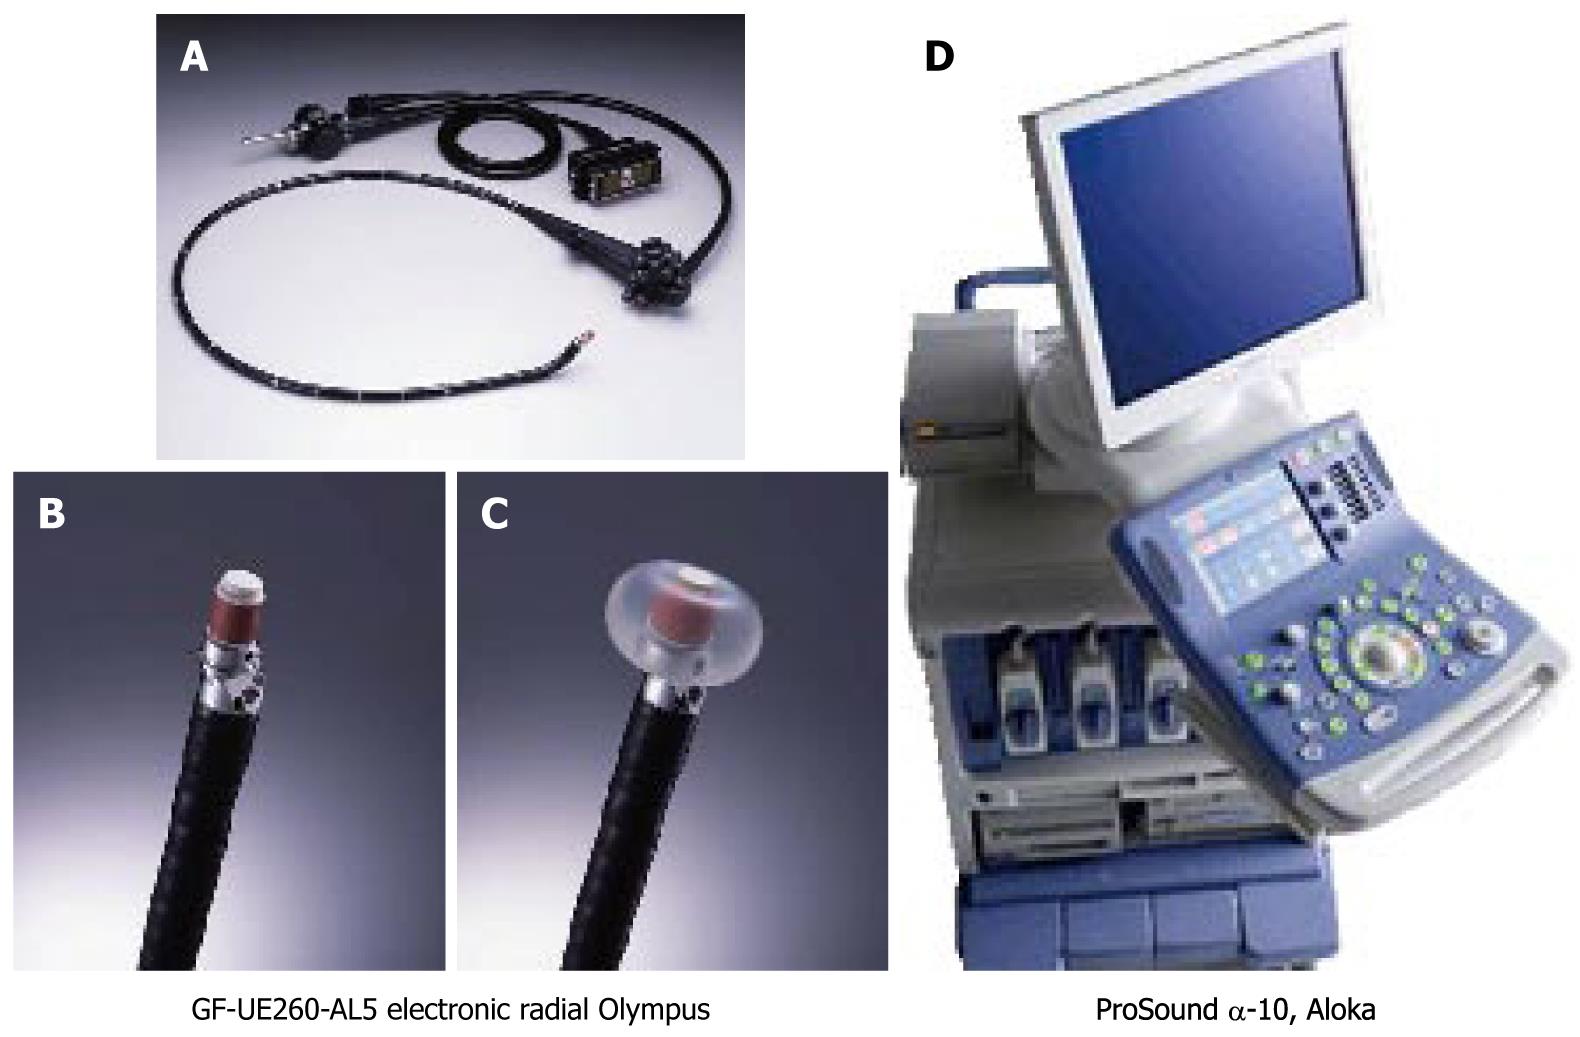
Figure 4 Endoscope and ultrasound machine (Setting-2).
A-C: The left three images indicate the whole view of the Olympus endosonoscope (GF-UE260-AL5) and the tip of the scope (both bare tip and tip with inflated balloon images are presented.); D: The image shows the ultrasound machine (ProSound α-10, Aloka, Japan).
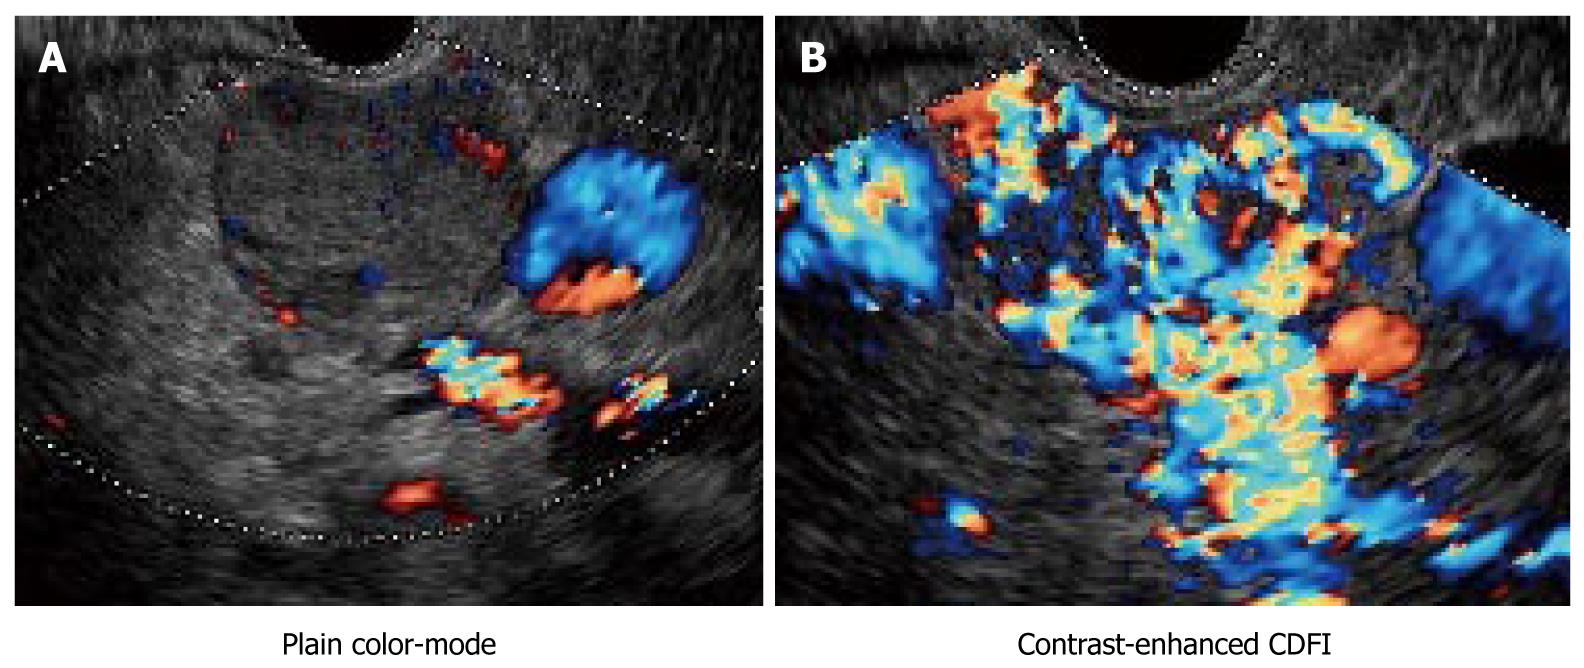
Figure 5 Endocrine tumor of the pancreas.
A: Plain color (non-enhanced color) Doppler endoscopic ultrasonography (EUS) only showed few color signals inside the clearly delineated iso-echoic tumor; B: In contrast, there were abundant color signals inside the tumor, indicating it was hypervascular. B-mode image combined with contrast-enhanced EUS images provided an important clue for the diagnosis of pancreatic endocrine tumors. Levovist® was used in this case.
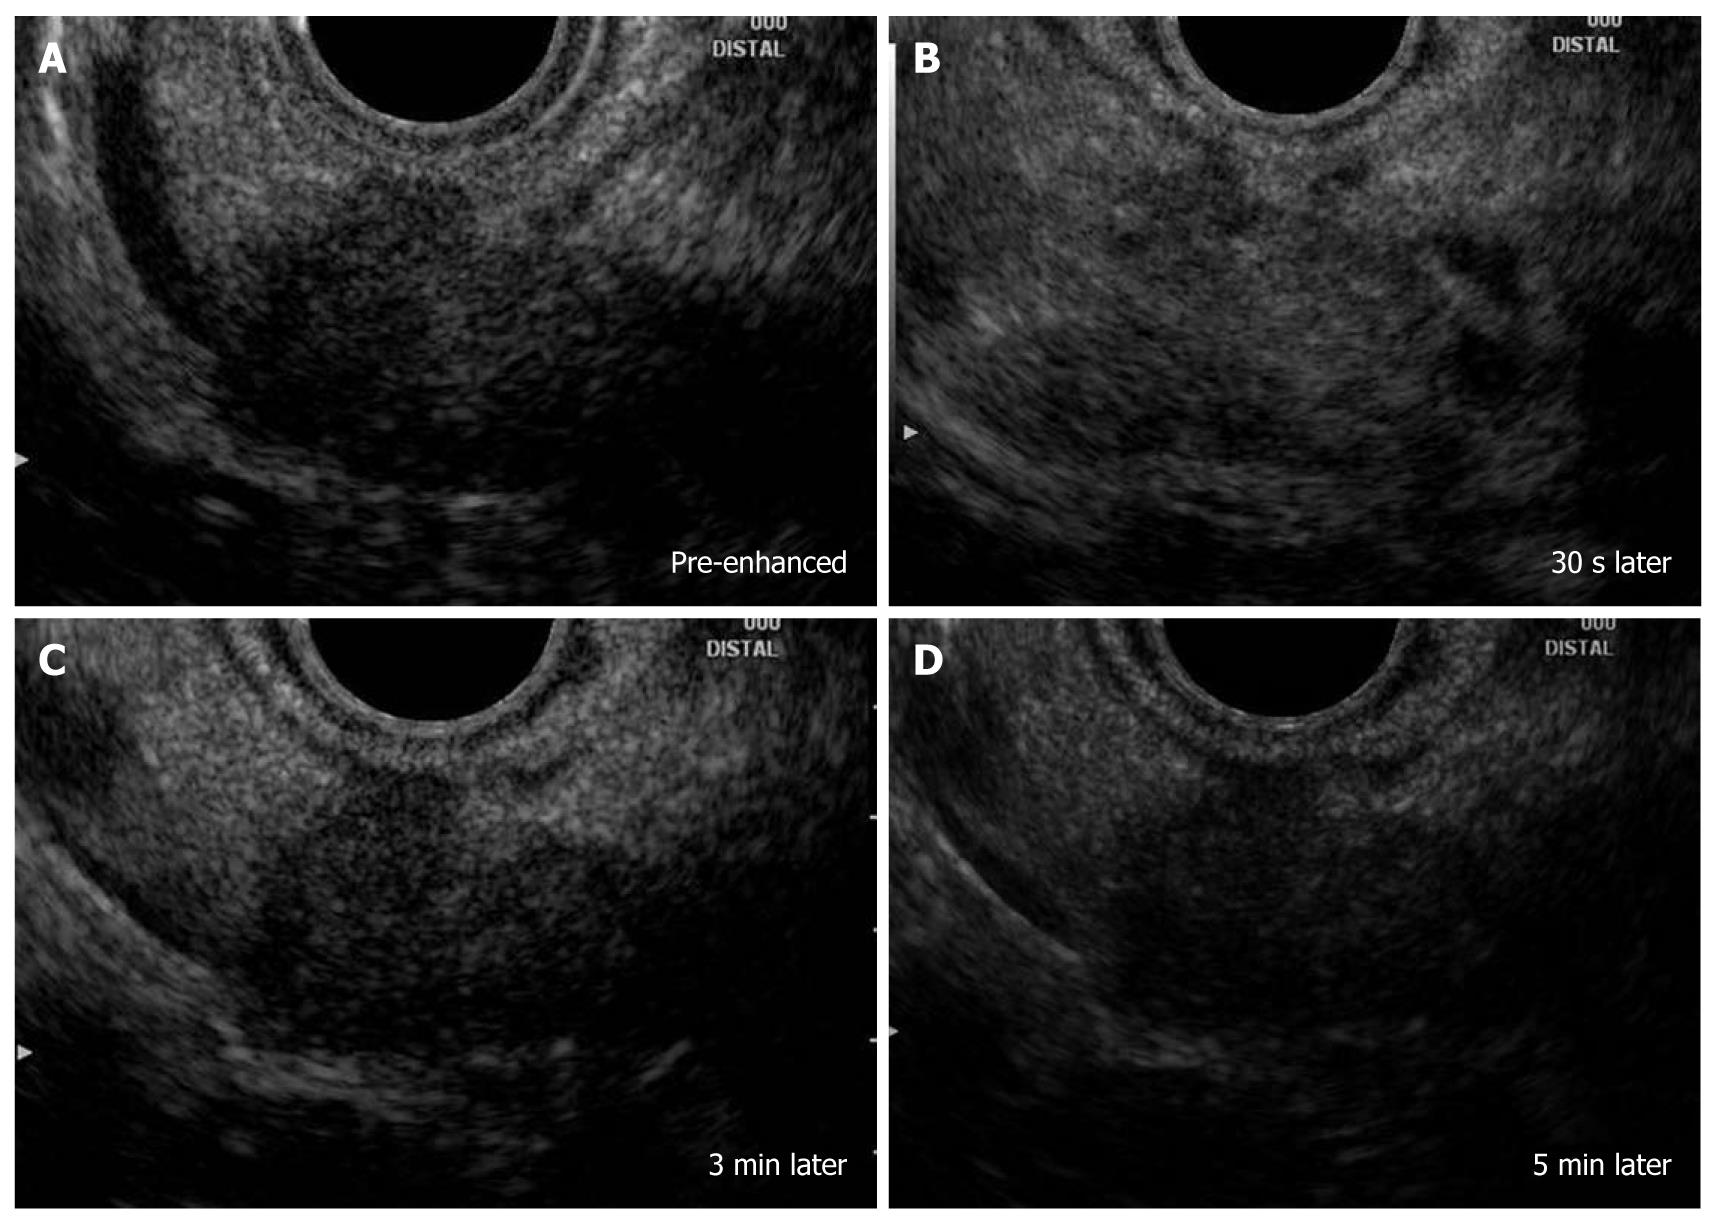
Figure 6 Pancreatic ductal adenocarcinoma.
A: There was a hypoechoic mass at the pancreatic body with an irregular margin (pre-enhanced); B: The image indicated an increase in echo-intensity close to that of the surrounding normal parenchyma (30 s later after injection of Sonazoid); C, D: The center and the rightmost images were obtained 3 min and 5 min after injection. The tumor became hypoechoic (i.e. hypovascular) compared with surrounding tissues.
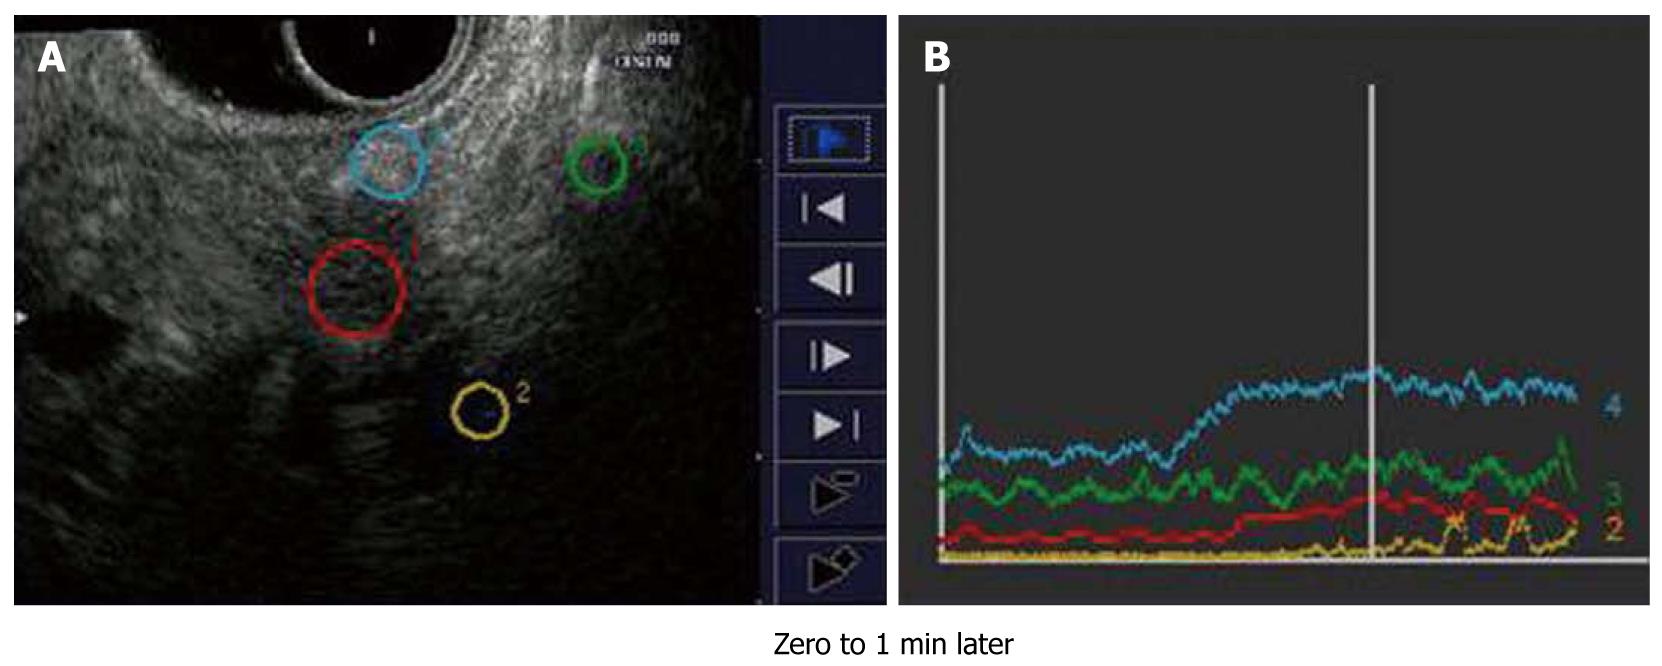
Figure 7 Time intensity curve for pancreatic ductal adenocarcinoma.
A, B: Both settings (settings 1 and 2) can provide a quantitative analysis graphic curve of the changing echo-intensity named the “time intensity curve”.
Figure 8 Image of a intraductal papillary mucinous neoplasm with high-grade dysplasia.
A: There are numerous papillary growths in the intraductal papillary mucinous neoplasm (IPMN) maximum intensity projection image; B: The volume-rendering images reflect the surface architecture with reality; C: The combination of volume-rendering imaging and color Doppler imaging may be more useful in the diagnosis of the malignant potential of the IPMN.
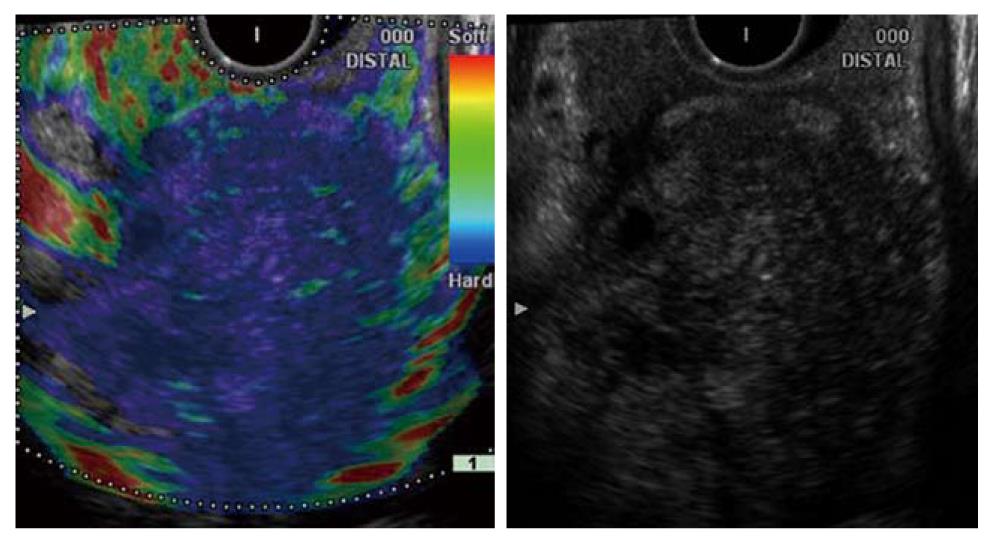
Figure 9 Pancreatic ductal adenocarcinoma.
Endoscopic ultrasonography-elastographic image (left side) shows a markedly hard area at the site of the low-echo tumor area (right side) and distribution of slightly soft spots in its interior. Histopathologic examination confirmed that the hard area contained a large amount of fibrous tissue, and the internal soft spots were aggregations of ducts atypical (of various sizes).
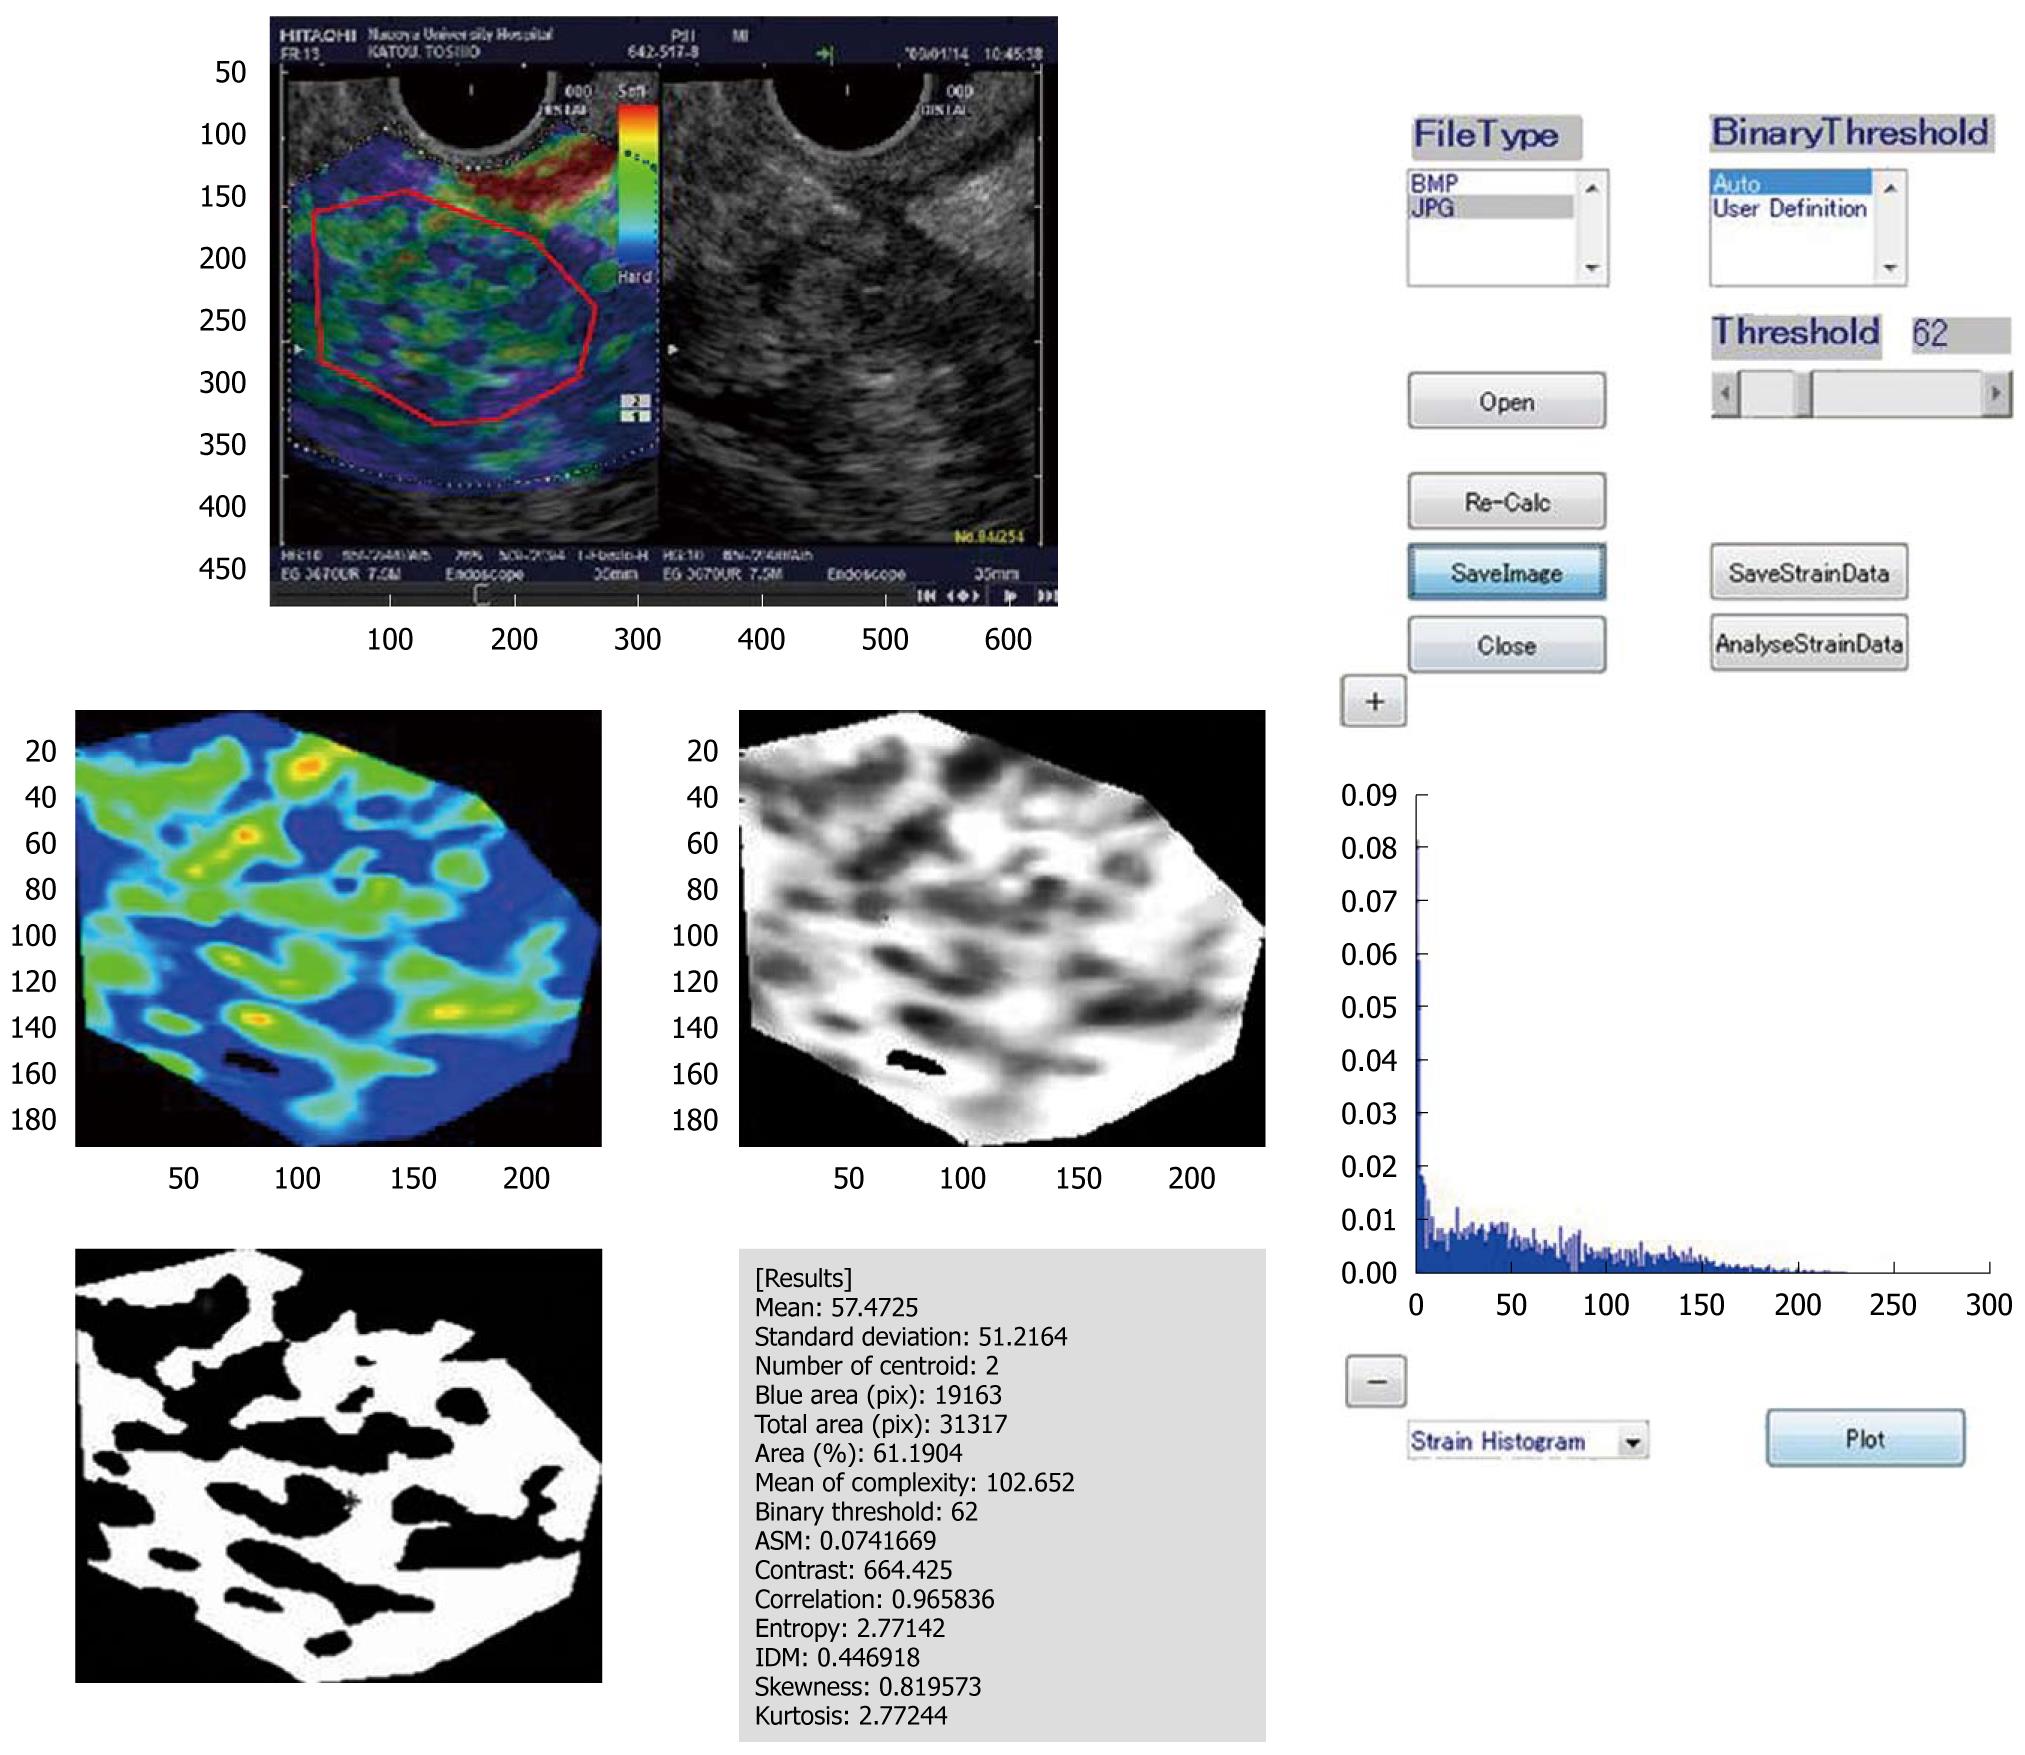
Figure 10 Prototype image analysis software (chronic pancreatitis in this case).
The prototype image analysis software used here extracts various features from real-time tissue elastography images. It converts the red-green-blue value inside the region of interest of the elastography image into a relative strain value and calculates other features of the elastography image, such as the mean of the relative strain value, the standard deviation of the relative strain value, and the proportion of the blue (low strain) region in the analysis region, and determines the complexity of the blue (low strain) region in the analysis region [(Perimeter of blue region)2/(Area of blue region)].
- Citation: Hirooka Y, Itoh A, Kawashima H, Ohno E, Ishikawa T, Itoh Y, Nakamura Y, Hiramatsu T, Nakamura M, Miyahara R, Ohmiya N, Ishigami M, Katano Y, Goto H. Clinical oncology for pancreatic and biliary cancers: Advances and current limitations. World J Clin Oncol 2011; 2(5): 217-224
- URL: https://www.wjgnet.com/2218-4333/full/v2/i5/217.htm
- DOI: https://dx.doi.org/10.5306/wjco.v2.i5.217


