Copyright
©2011 Baishideng Publishing Group Co.
World J Clin Oncol. Apr 10, 2011; 2(4): 187-194
Published online Apr 10, 2011. doi: 10.5306/wjco.v2.i4.187
Published online Apr 10, 2011. doi: 10.5306/wjco.v2.i4.187
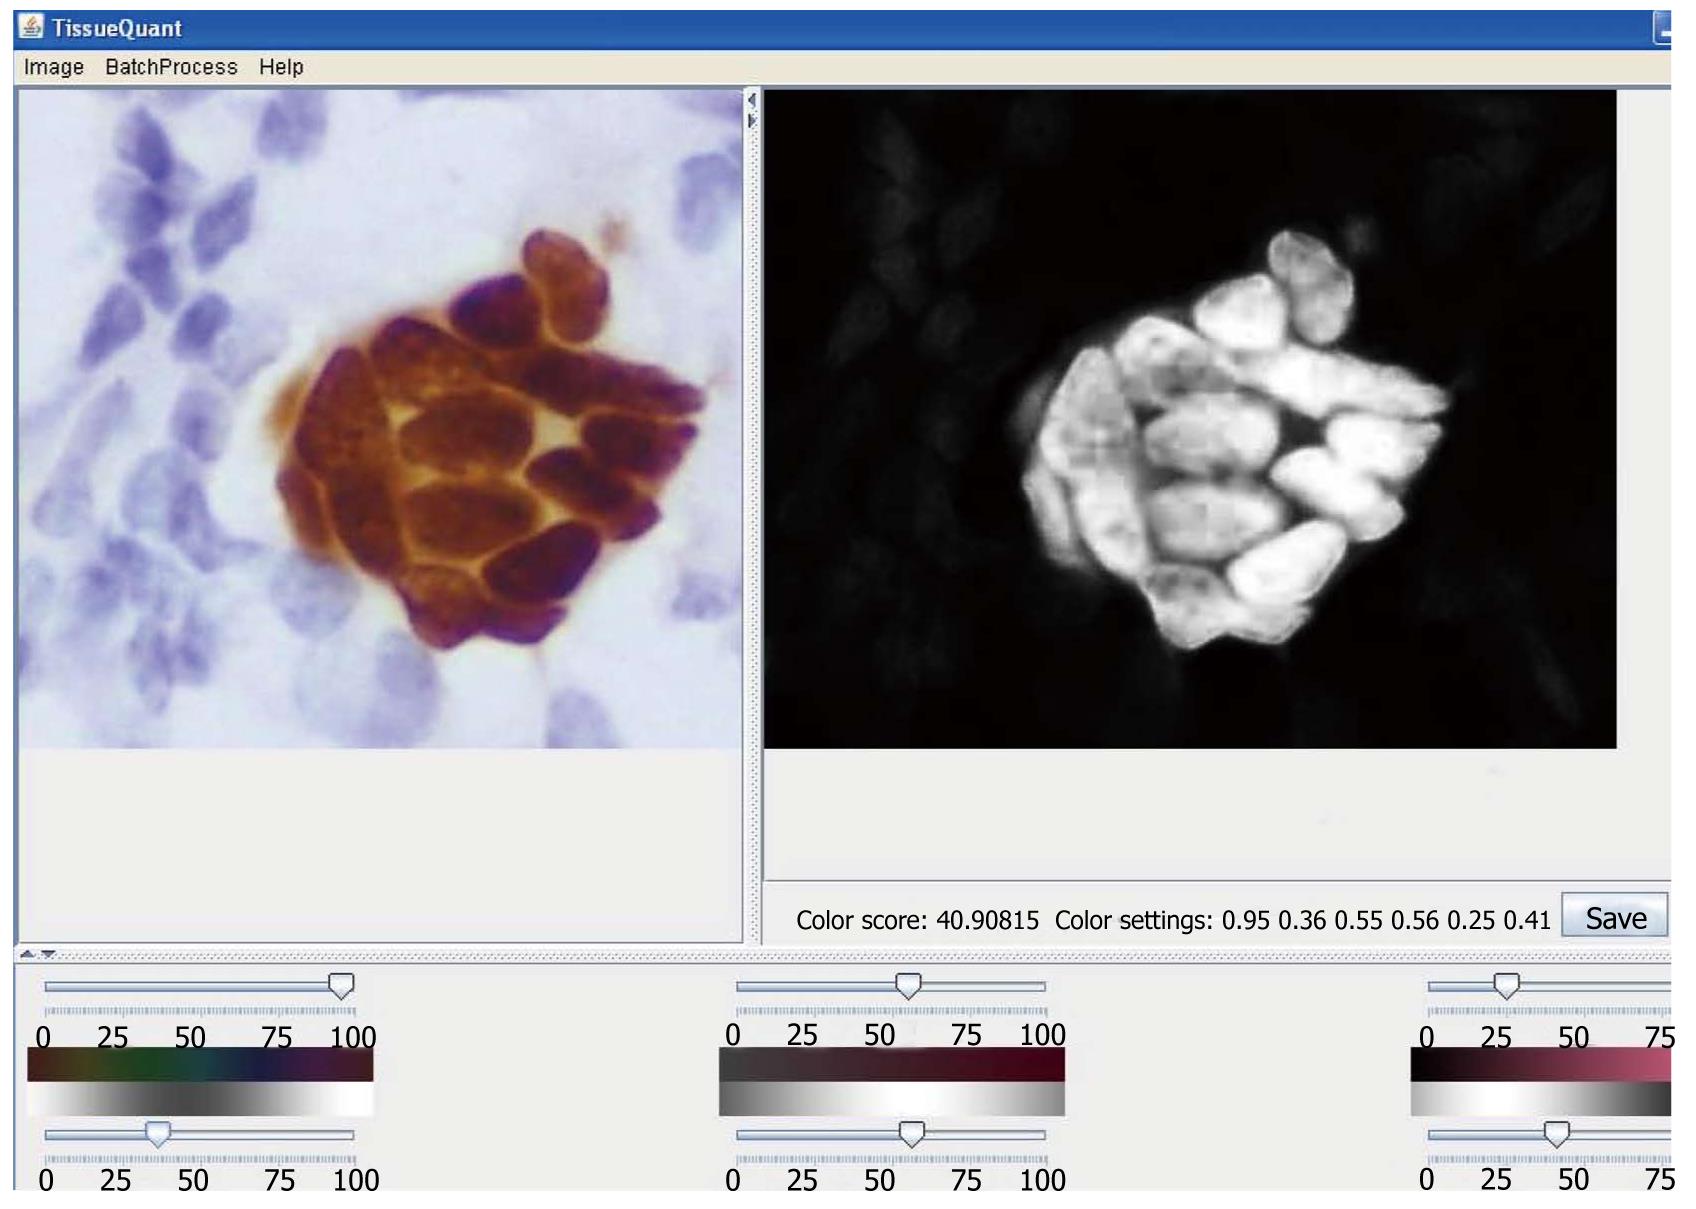
Figure 1 Screenshot of the TissueQuant software.
On the left panel of the main window the original image is opened. The right panel displays the color score representation of the image. In the lower panel are the sliders which could be adjusted to select the color shade of interest.
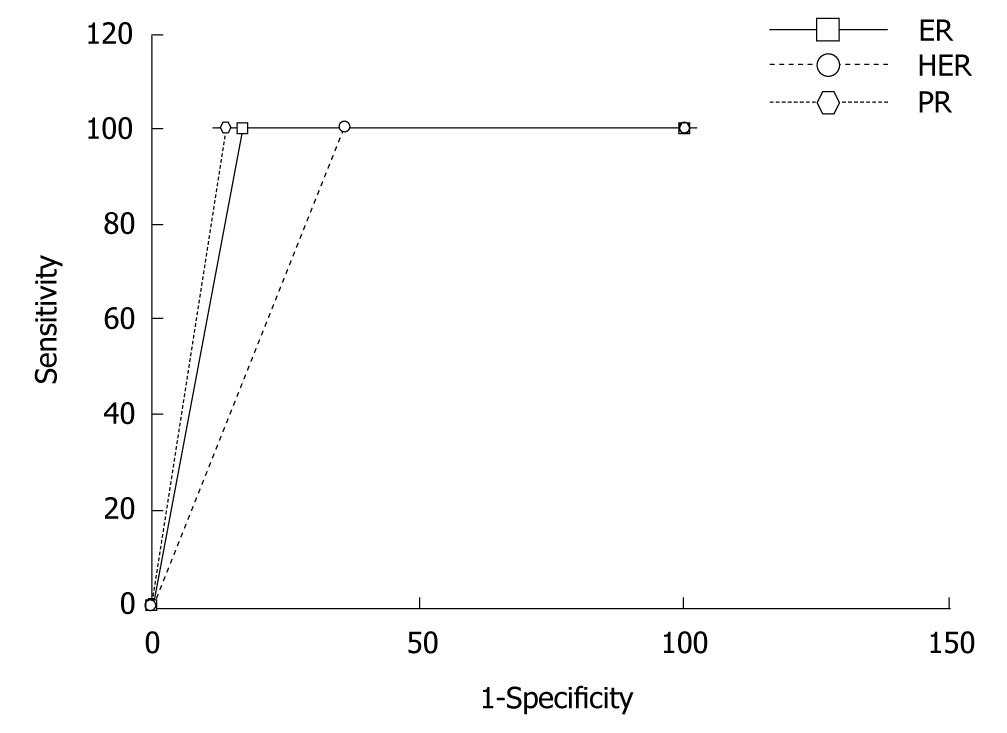
Figure 2 ROC curves for the automated evaluation of estrogen receptor, progesterone receptor and human epidermal growth factor receptor-2 expression images using TissueQuant.
For all three expressions the sensitivity of 100% is maintained, the specificity for PR expression is best at, 86%, for ER the specificity is 82.3% and for HER-2/neu expression the specificity is least at, 64.3%. ER: Estrogen receptor; PR: Progesterone receptor; HER-2/neu: Human epidermal growth factor receptor-2.
- Citation: Prasad K, Tiwari A, Ilanthodi S, Prabhu G, Pai M. Automation of immunohistochemical evaluation in breast cancer using image analysis. World J Clin Oncol 2011; 2(4): 187-194
- URL: https://www.wjgnet.com/2218-4333/full/v2/i4/187.htm
- DOI: https://dx.doi.org/10.5306/wjco.v2.i4.187


