Copyright
©2010 Baishideng Publishing Group Co.
World J Clin Oncol. Feb 10, 2011; 2(2): 125-134
Published online Feb 10, 2011. doi: 10.5306/wjco.v2.i2.125
Published online Feb 10, 2011. doi: 10.5306/wjco.v2.i2.125
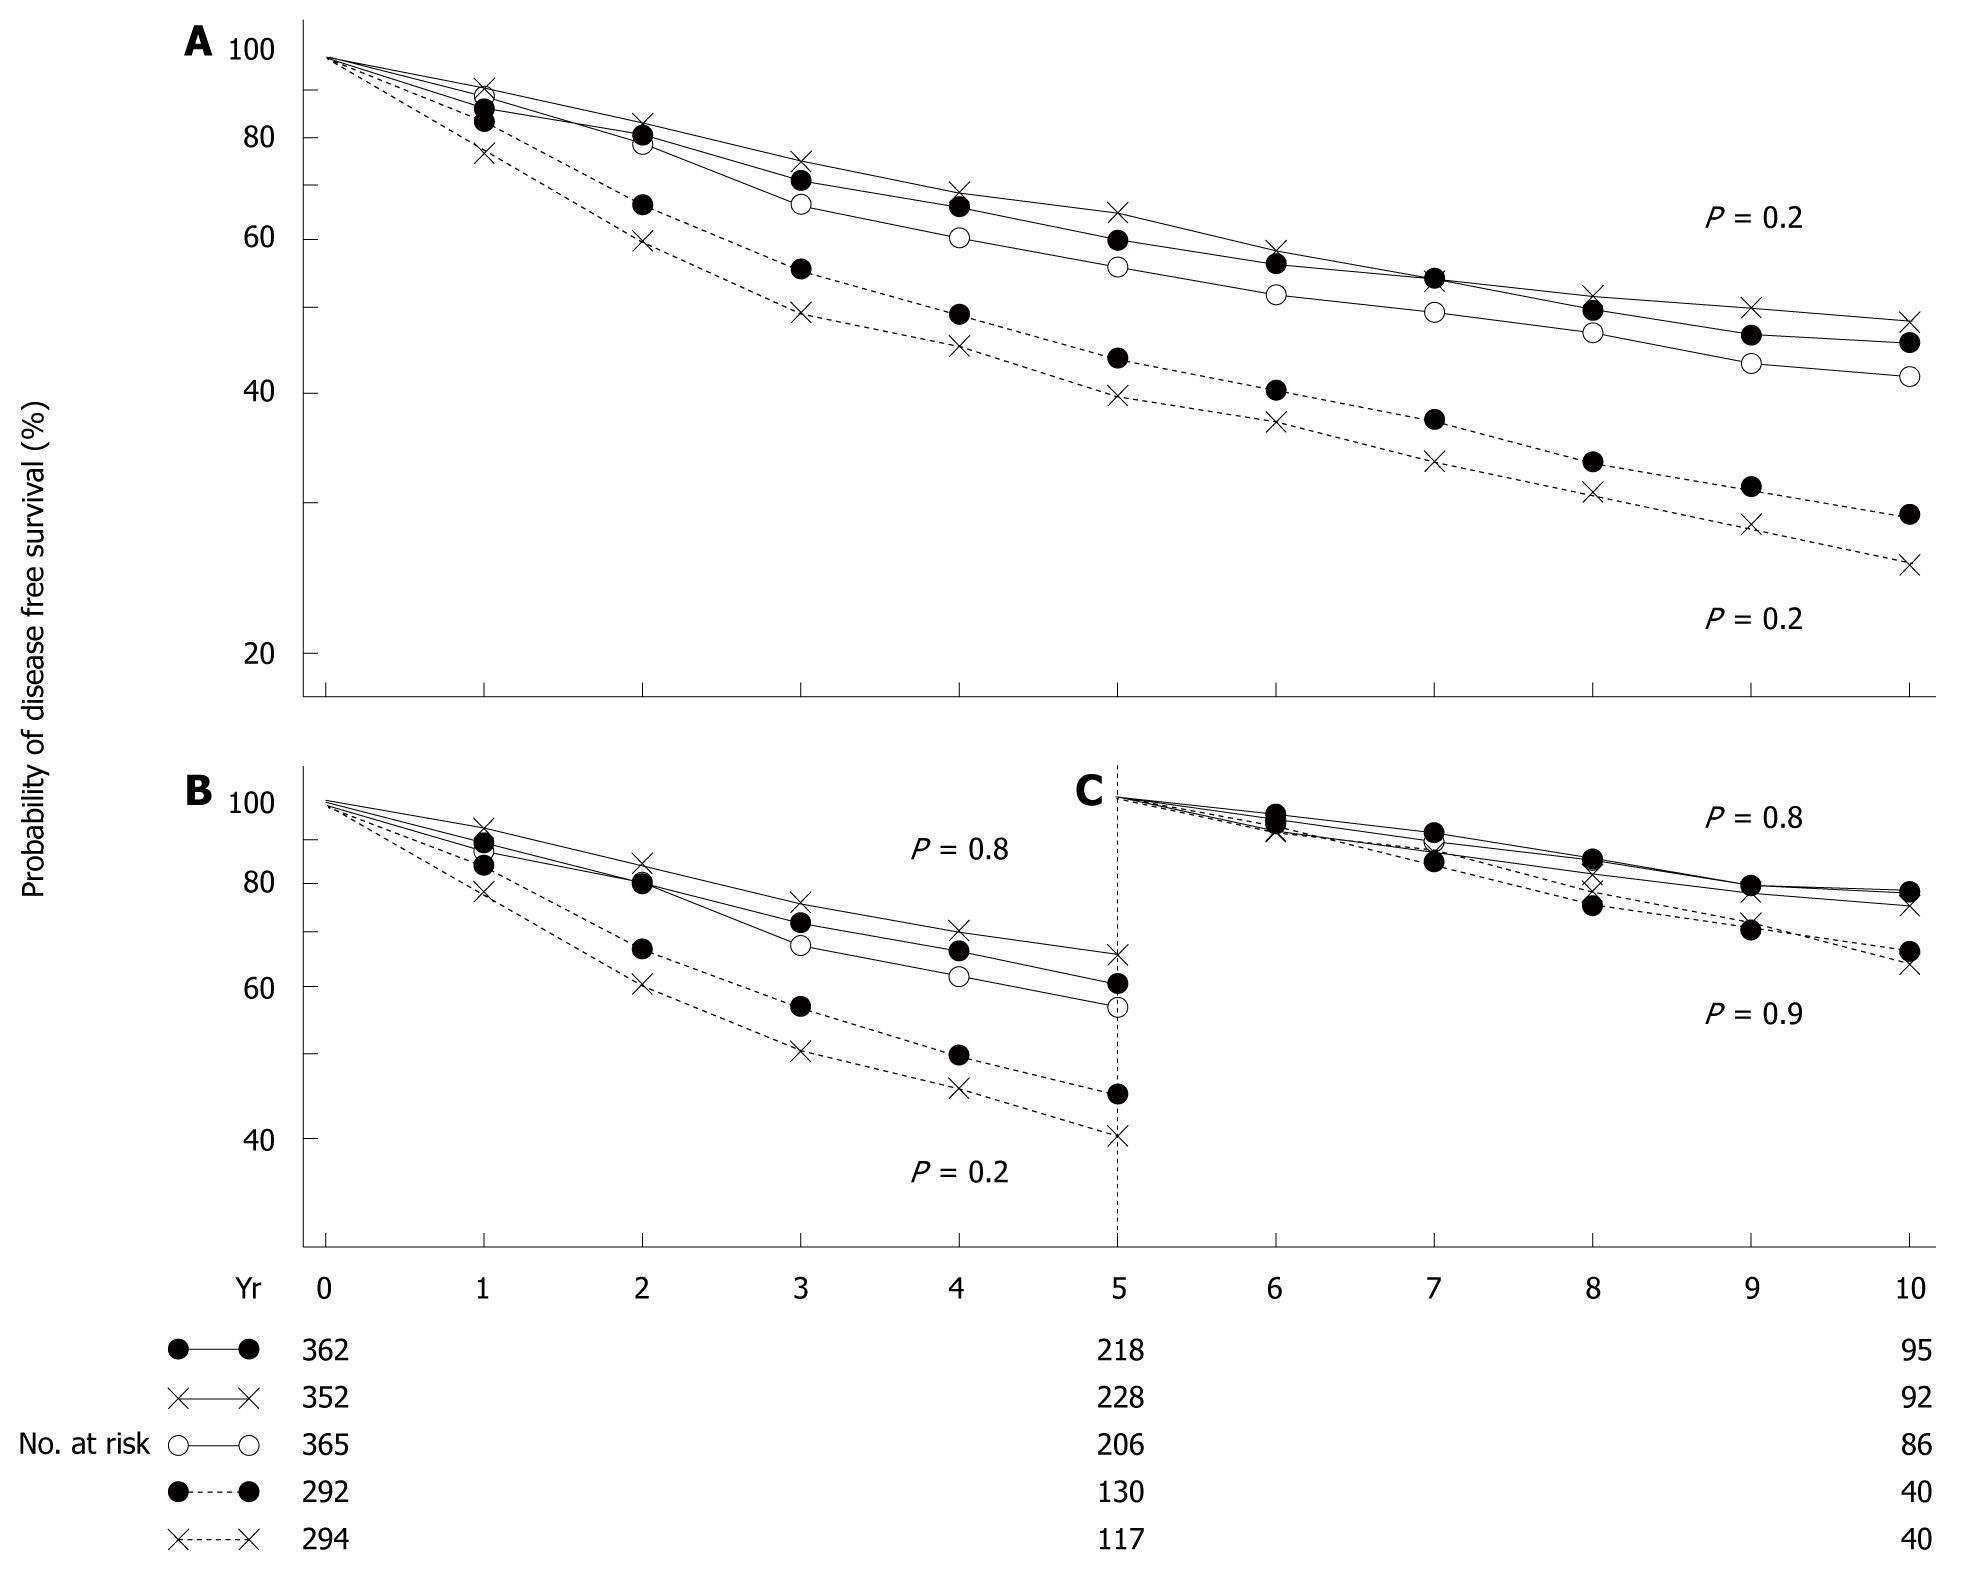
Figure 1 Disease-free survival at 10 years (A), during the first 5 years (B), and during the second 5 years for patients free of disease at the end of 5 years (C).
Patients were treated by radical mastectomy (solid circles), total mastectomy plus radiation (crosses), or total mastectomy alone (open circles). There were no significant differences among the three groups of patients with clinically negative nodes (solid line) or between the two groups with clinically positive nodes (broken line)[1].
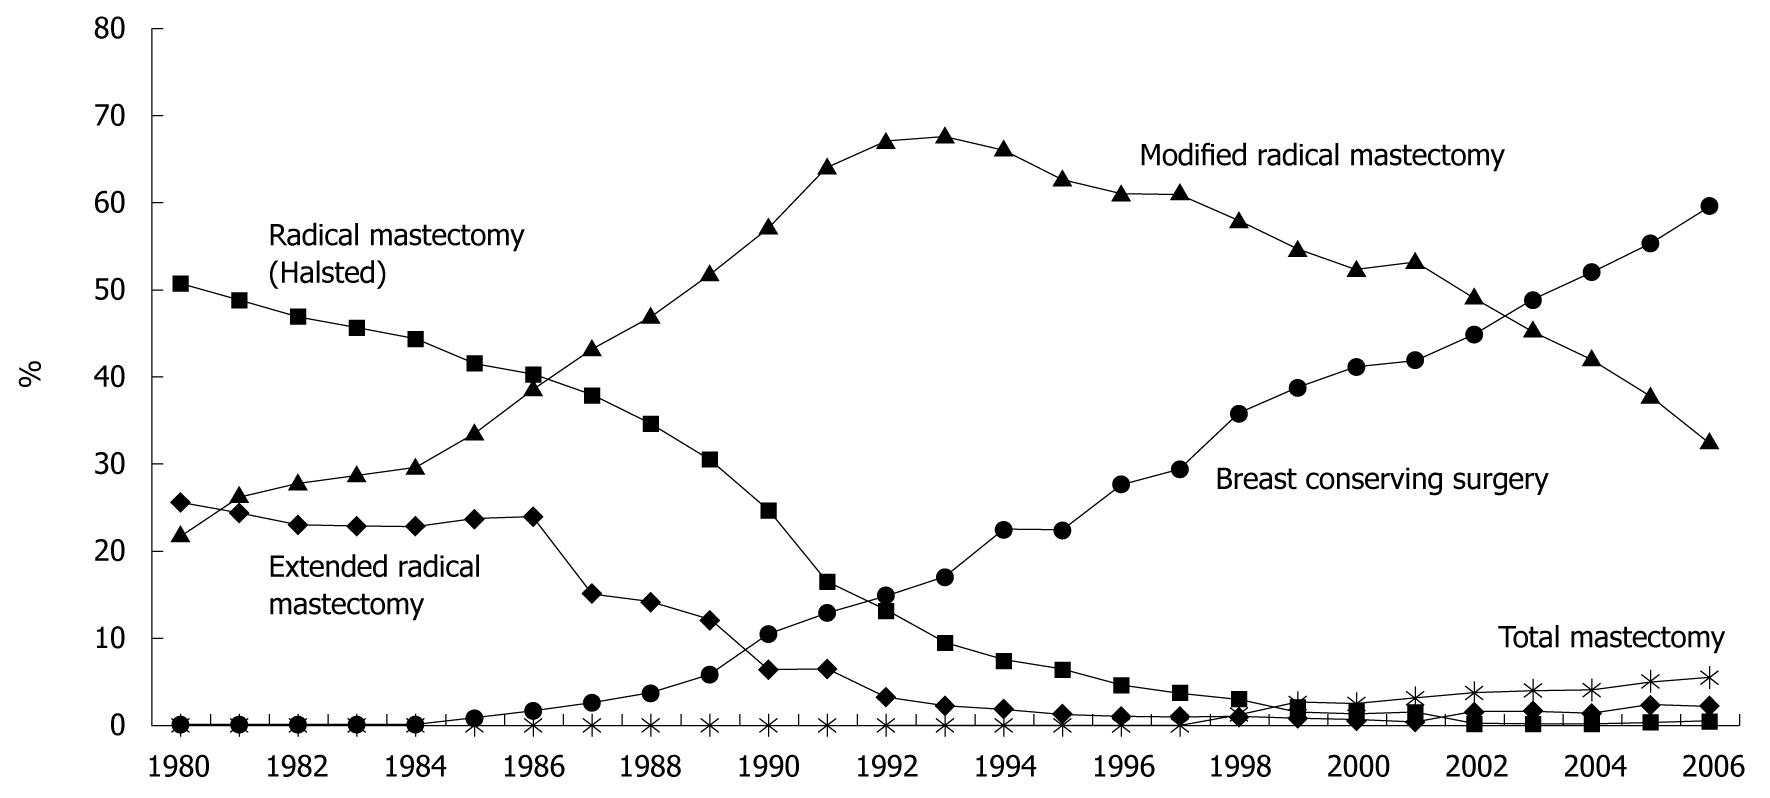
Figure 2 Changing trends in surgical procedures for breast cancer in Japan.
The questionnaire survey was enabled through the cooperation of 352 institutions. (Source: Figure 1 in reference 2).
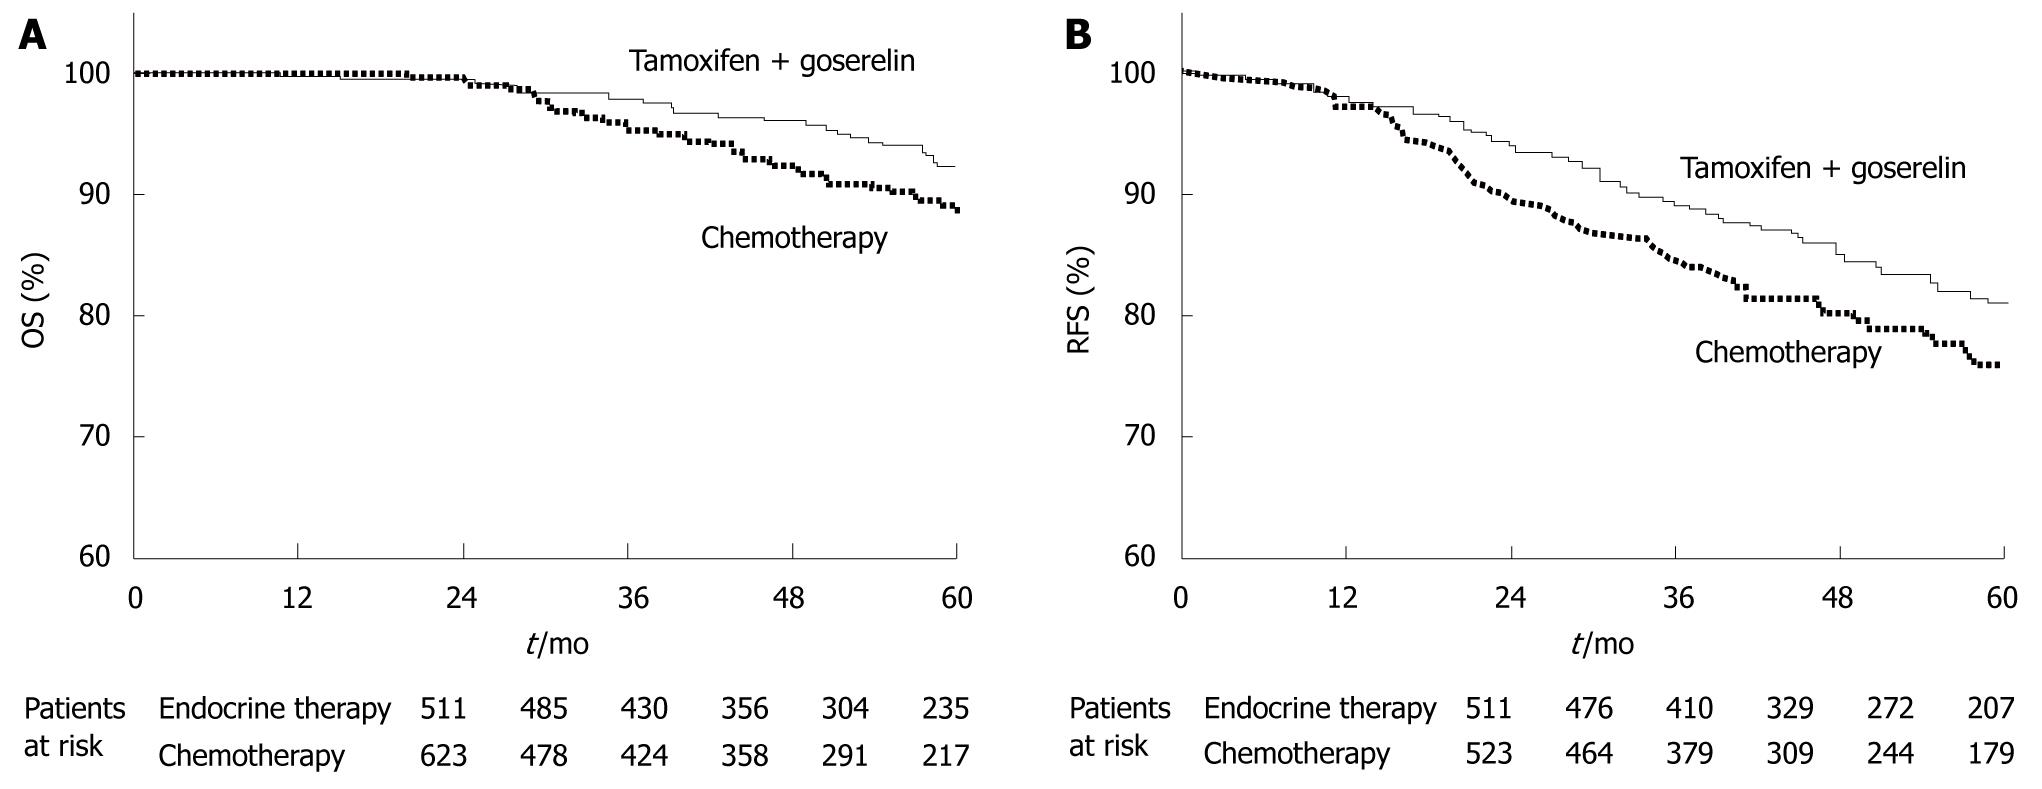
Figure 5 ABCSG-05 trial.
Kaplan-Meier estimates of overall survival (OS) (A) and relapse-free survival (RFS) (B) in the group assigned to endocrine therapy (tamoxifen and goserelin) and the group assigned to chemotherapy. Differences between groups were not significant. A: P = 0.093, generalized Wilcoxon test; P = 0.195, log-rank test. Figures of patients at risk are included. (Source: Figure 1 in reference 5); B: P = 0.017, generalized Wilcoxon test; P = 0.037, log-rank test. Figures of patients at risk are included. (Source: Figure 2 in reference 5).
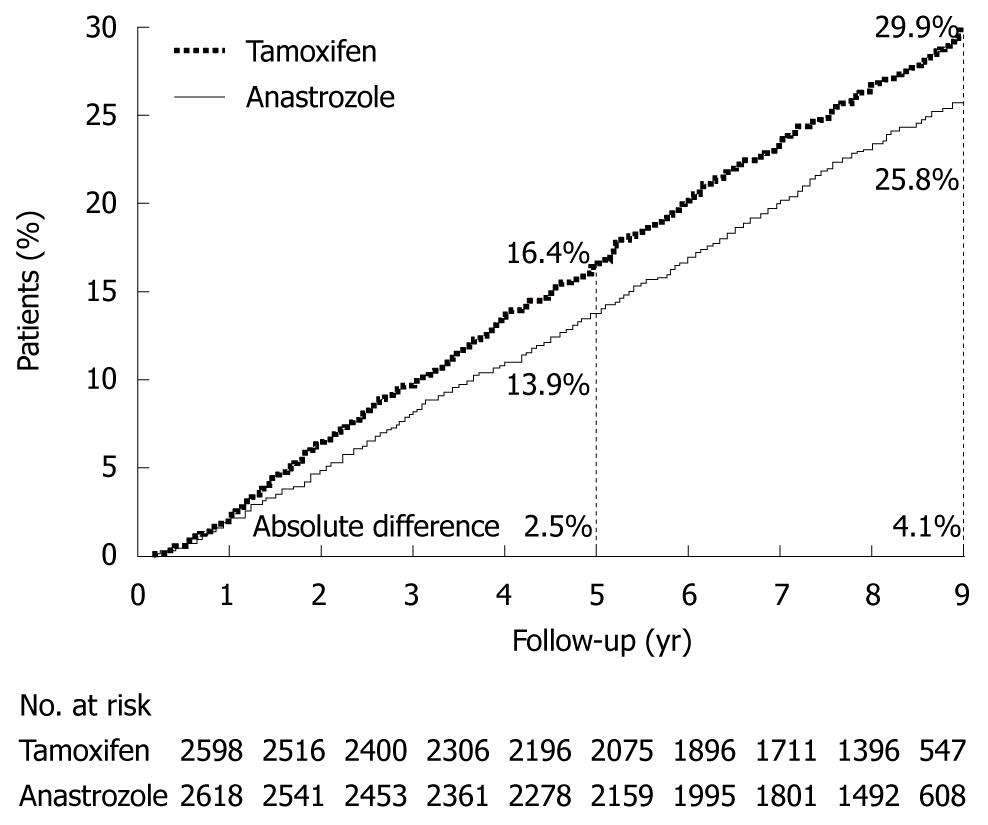
Figure 6 Arimidex, Tamoxifen Alone or in Combination trial.
Kaplan-Meier prevalence curves for disease free survival in hormone-receptor-positive patients. (Source: Figure 3 in reference 6).
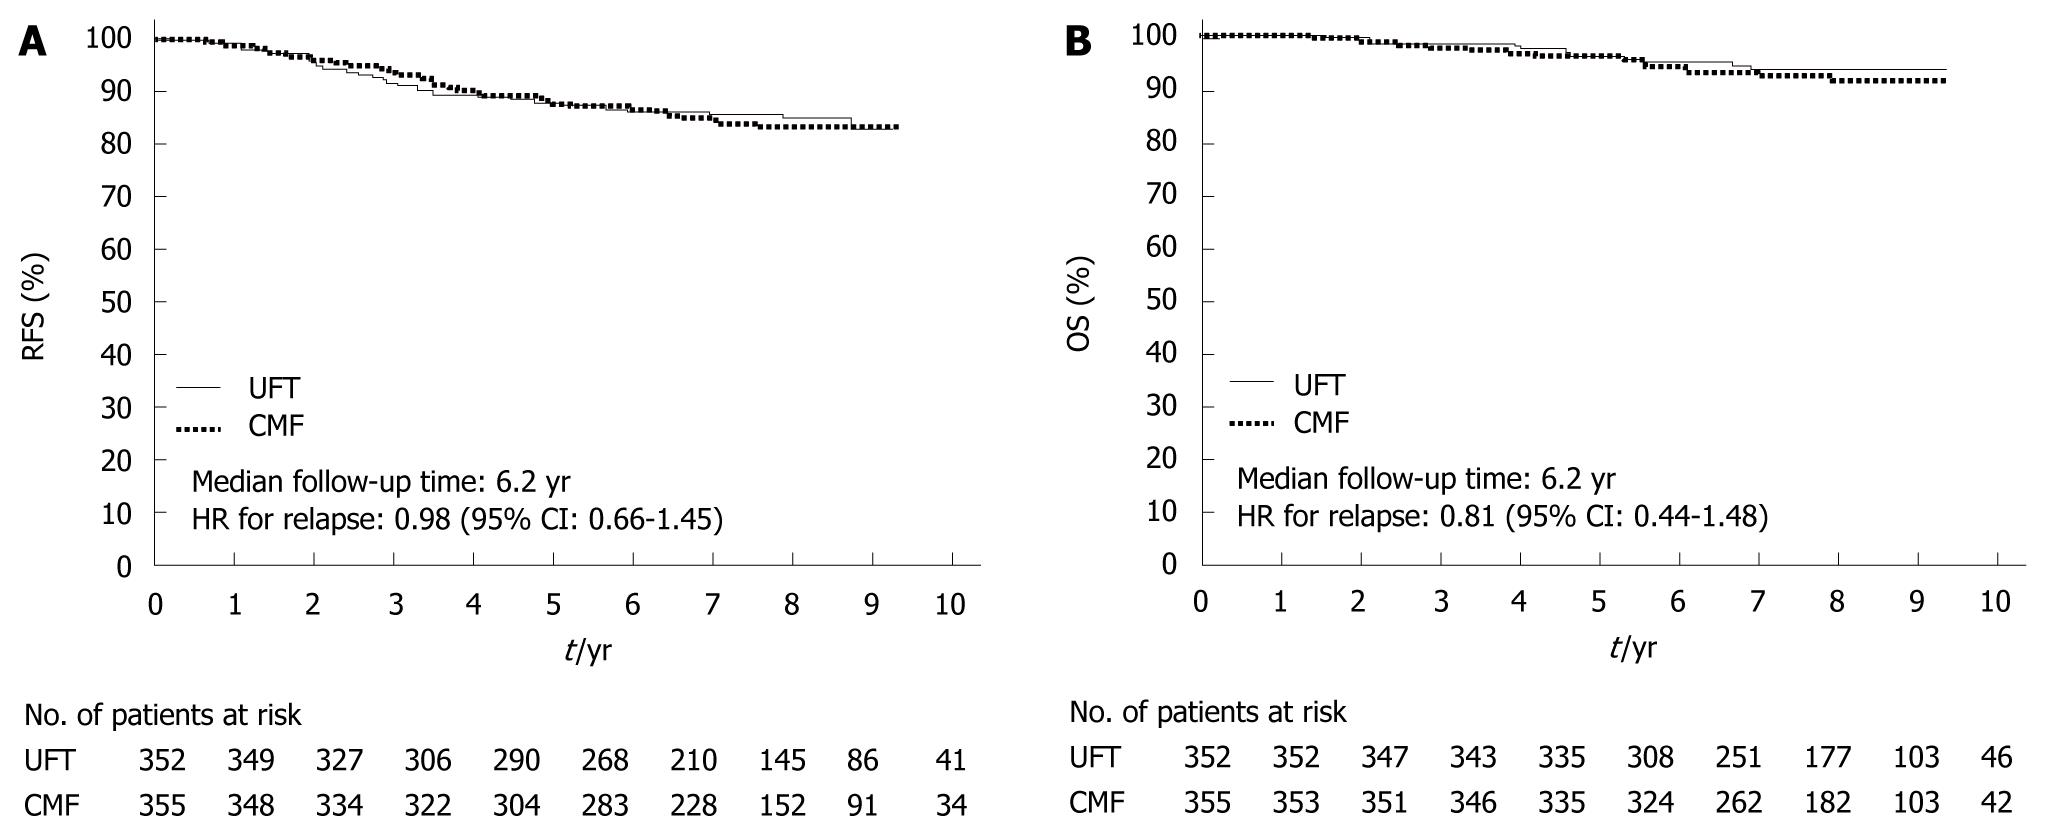
Figure 7 National Surgical Adjuvant Study for Breast Cancer 01 Trial.
Relapse-free survival (RFS) (A) and overall survival (OS) (B) of patients treated with tegafur/uracil (UFT) or chemotherapy (CMF). A: 5-year; 87.8% vs 88.0%; hazard ratio (HR) = 0.98; 95% CI: 0.66-1.45. (Source: Figure 3A in reference 7); B: 5-year, 96.2% vs 96.0%, HR = 0.81, 95% CI: 0.44-1.48. (Source: Figure 3B in reference 7).
Figure 8 CUBC trial.
Relapse-free survival (RFS) (A) and overall survival (OS) (B) of patients treated with tegafur/uracil (UFT) or chemotherapy (CMF). A: 5-year, 72.2% vs 76.3%, hazard ratio (HR) = 1.18, 95% CI: 0.77-1.80. (Source: Figure 2A in reference 8); B: 5-year, 87.0% vs 88.4%, HR = 1.15; 95% CI: 0.62-2.12]. (Source: Figure 2B in reference 8).
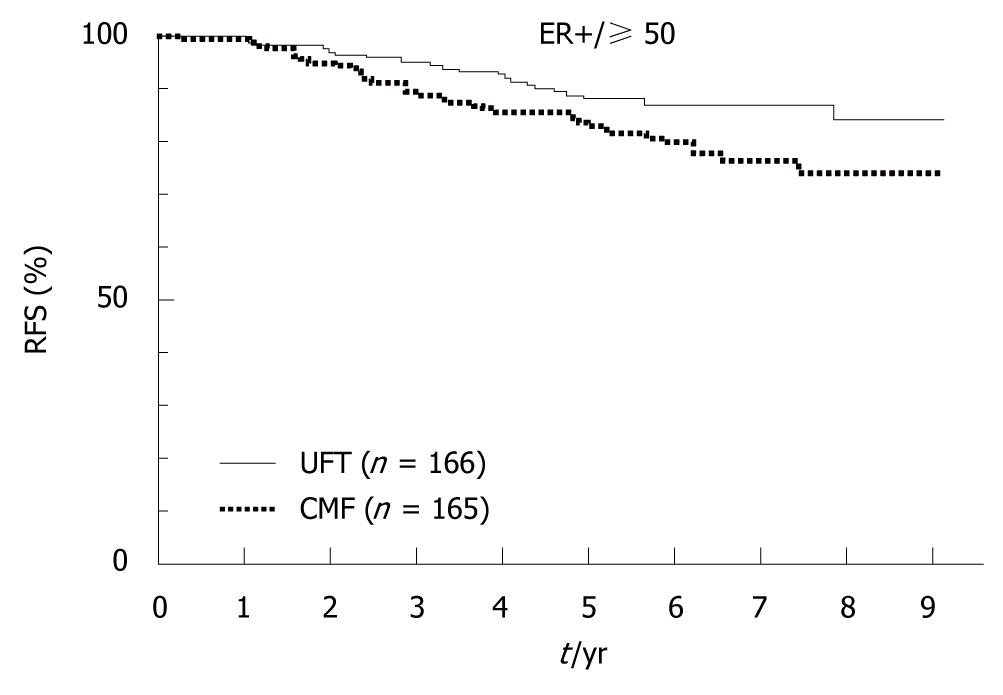
Figure 9 A pooled analysis of two randomized controlled trials (N•SAS-BC 01 trial and CUBC trial).
Relapse-free survival (RFS) according to estrogen receptor (ER) + and age ≥ 50 years. [tegafur/uracil (UFT) vs chemotherapy (CMF), hazard ratio (HR) = 0.58, 95% CI: 0.34-1.01]. (Source: Figure 5 in reference 9).
Figure 10 Phase III trial of pegylated liposomal doxorubicin HCL vs conventional doxorubicin for first-line treatment of metastatic breast cancer.
A: Relapse-free survival (RFS). [6.9 mo vs 7.8 mo, hazard ratio = 1.00, 95% CI: 0.82-1.22]. PLD: Pegylated liposomal doxorubicin. (Source: Figure 1 in reference 11); B: Overall survival (OS). (21 mo vs 22 mo, HR = 0.94, 95% CI: 0.74-1.19). (Source: Figure 4 in reference 11).
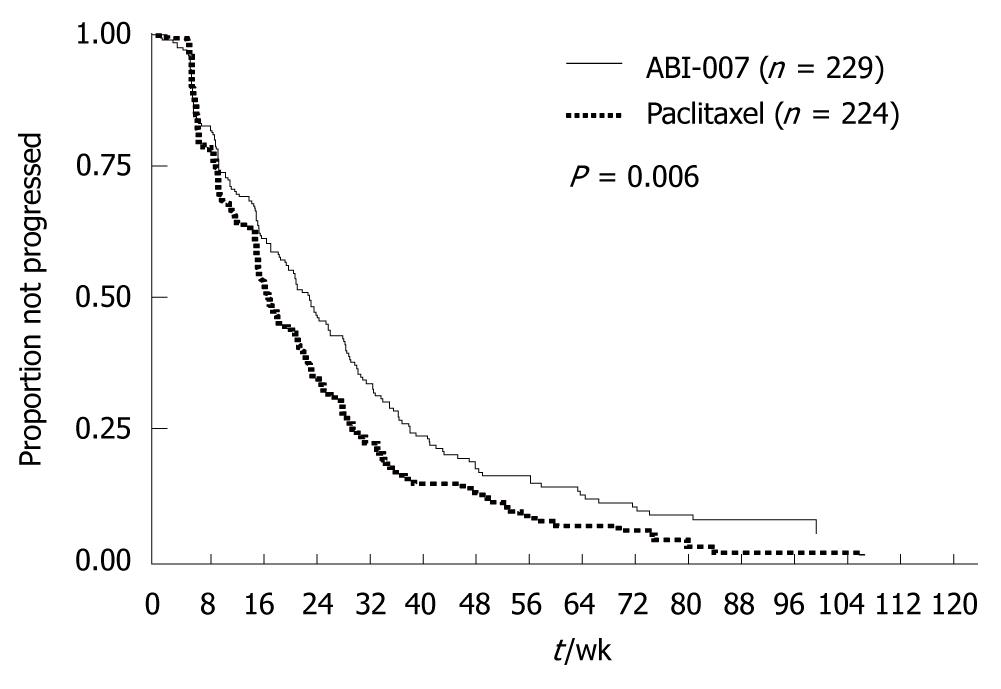
Figure 11 Phase III trial of nanoparticle albumin-bound paclitaxel (ABI-007) compared with polyethylated castor oil@based paclitaxel (standard paclitaxel) in women with breast cancer.
Median TTP (23.0 wk vs 16.9 wk, hazard ratio = 0.75, P = 0.006). (Source: Figure 1 in reference 12).
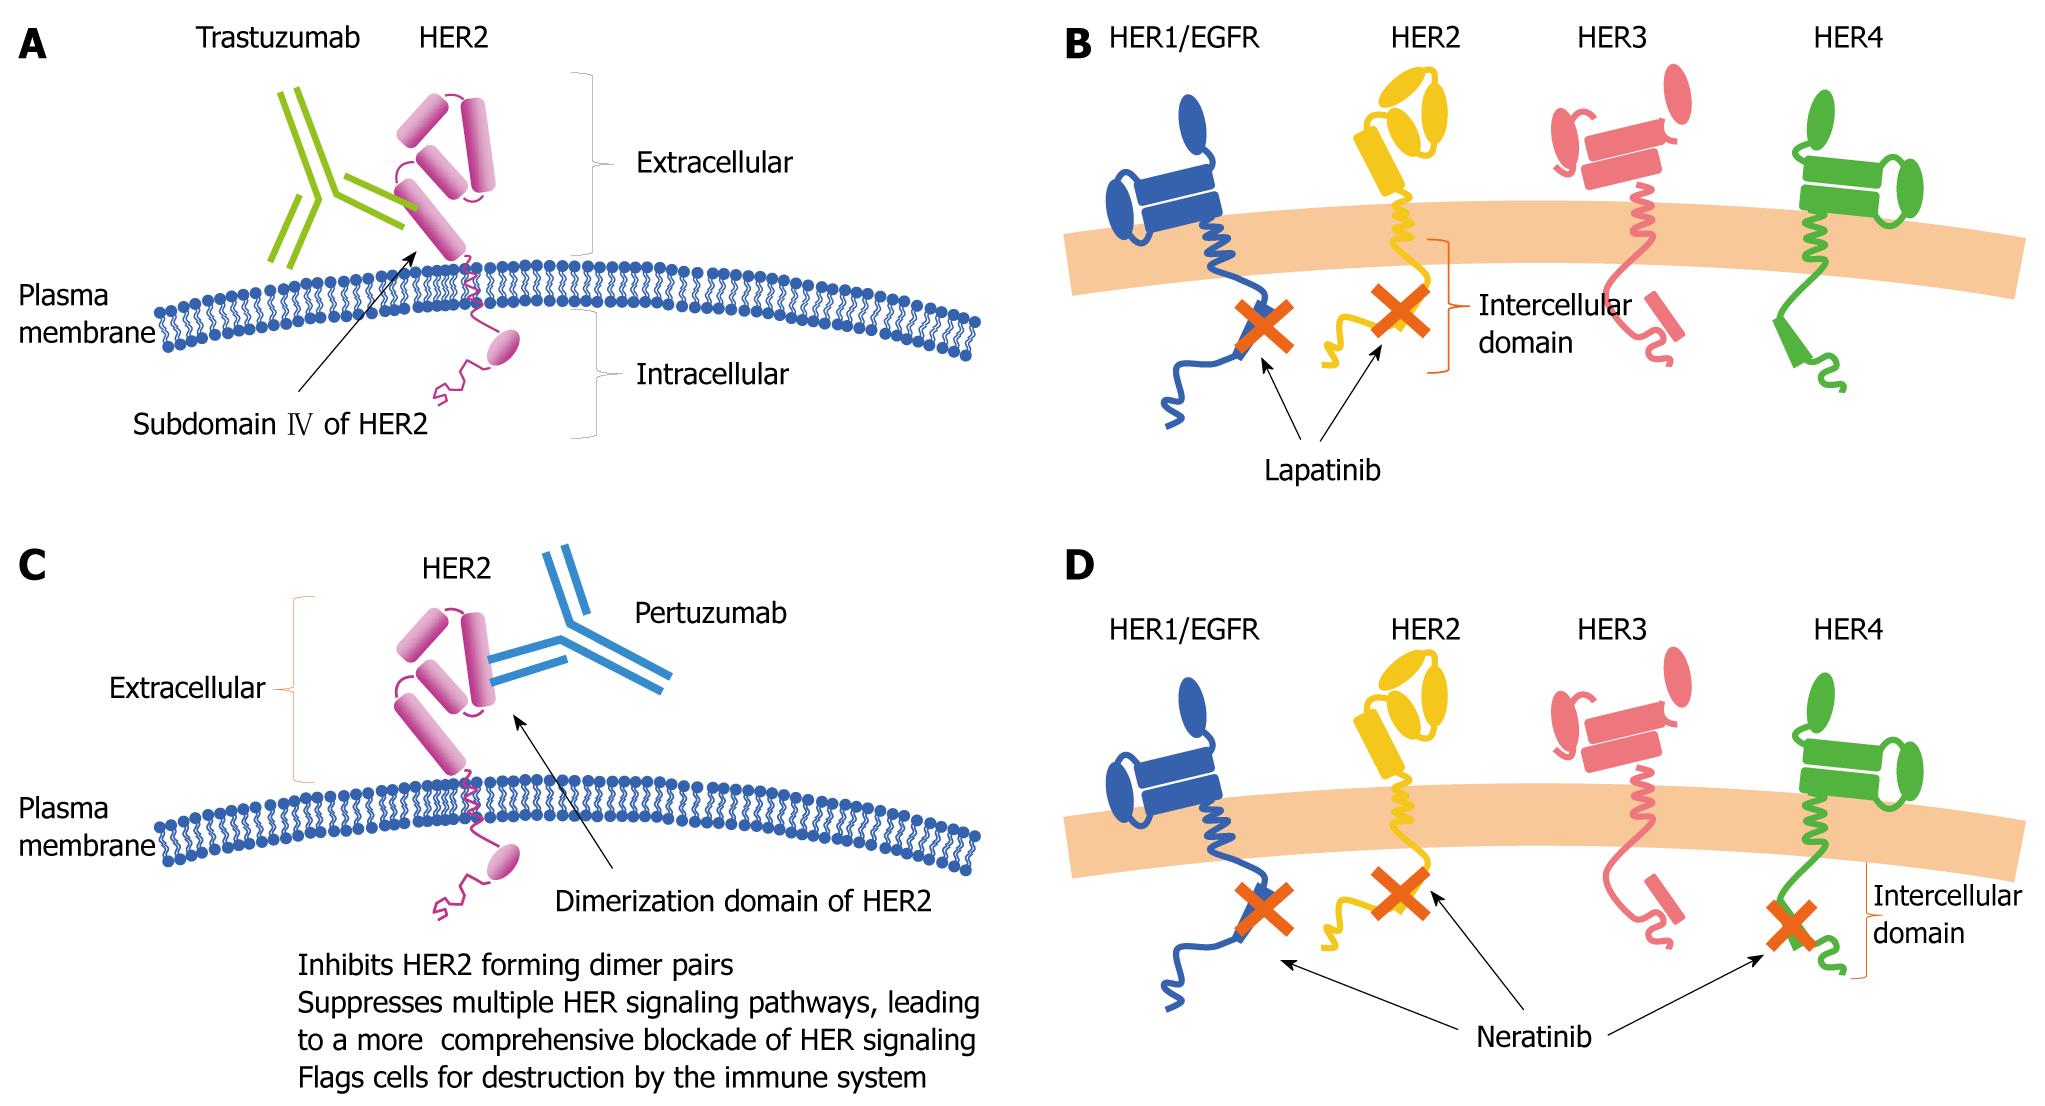
Figure 12 Target of trastuzumab (A), lapatinib (B), pertuzumab (C), neratinib (D).
HER: Human epidermal growth factor receptor.
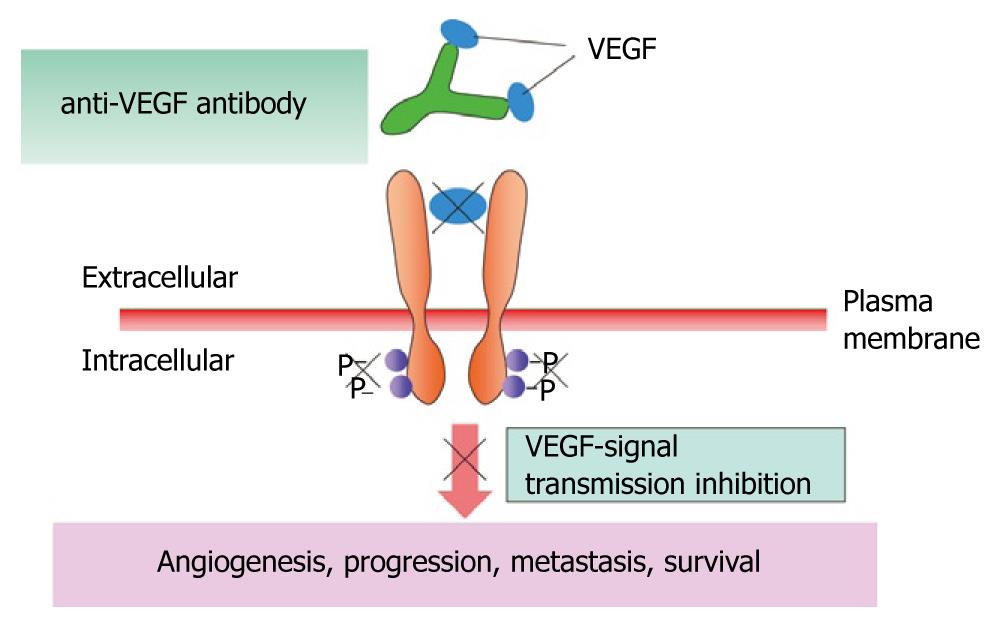
Figure 13 Mechanism of bevacizumab.
VEGF: Vascular endothelial cell growth factor.
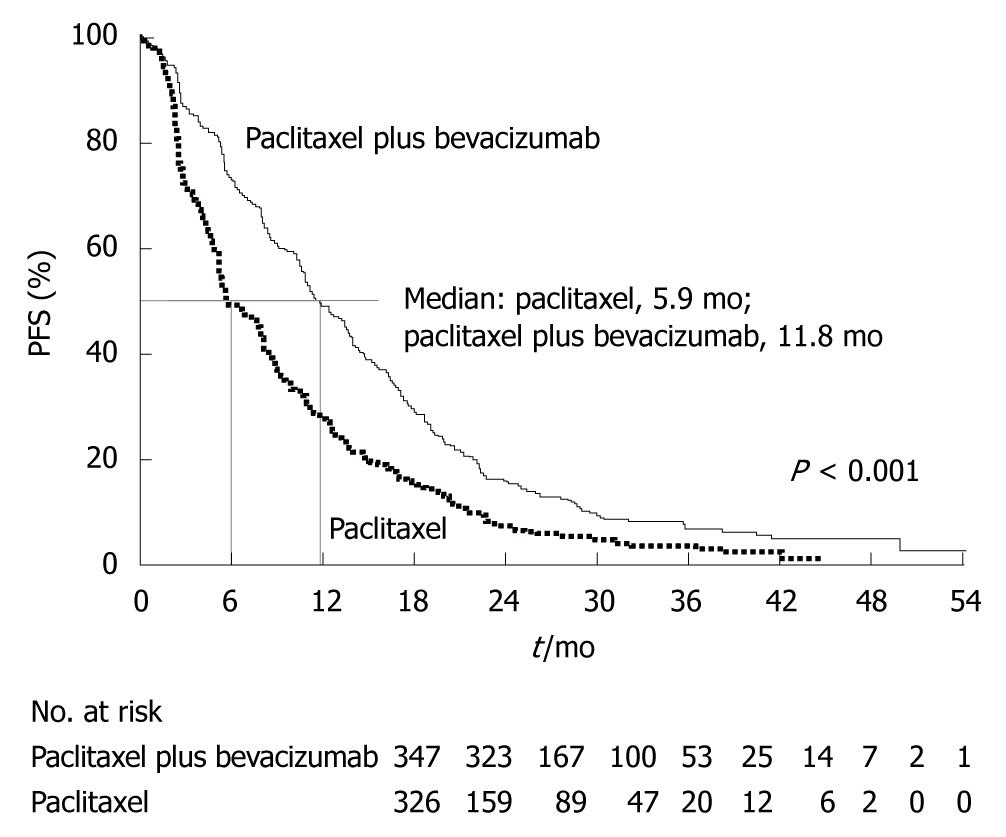
Figure 14 Phase III trial of paclitaxel plus bevacizumab vs paclitaxel alone for metastatic breast cancer.
Progression-free survival (PFS) (median, 11.8 mo vs 5.9 mo, hazard ratio = 0.60). (Source: Figure 2A in reference 21).
- Citation: Park Y, Kitahara T, Takagi R, Kato R. Current status of therapy for breast cancer worldwide and in Japan. World J Clin Oncol 2011; 2(2): 125-134
- URL: https://www.wjgnet.com/2218-4333/full/v2/i2/125.htm
- DOI: https://dx.doi.org/10.5306/wjco.v2.i2.125


