Copyright
©2011 Baishideng Publishing Group Co.
World J Clin Oncol. Dec 10, 2011; 2(12): 397-403
Published online Dec 10, 2011. doi: 10.5306/wjco.v2.i12.397
Published online Dec 10, 2011. doi: 10.5306/wjco.v2.i12.397
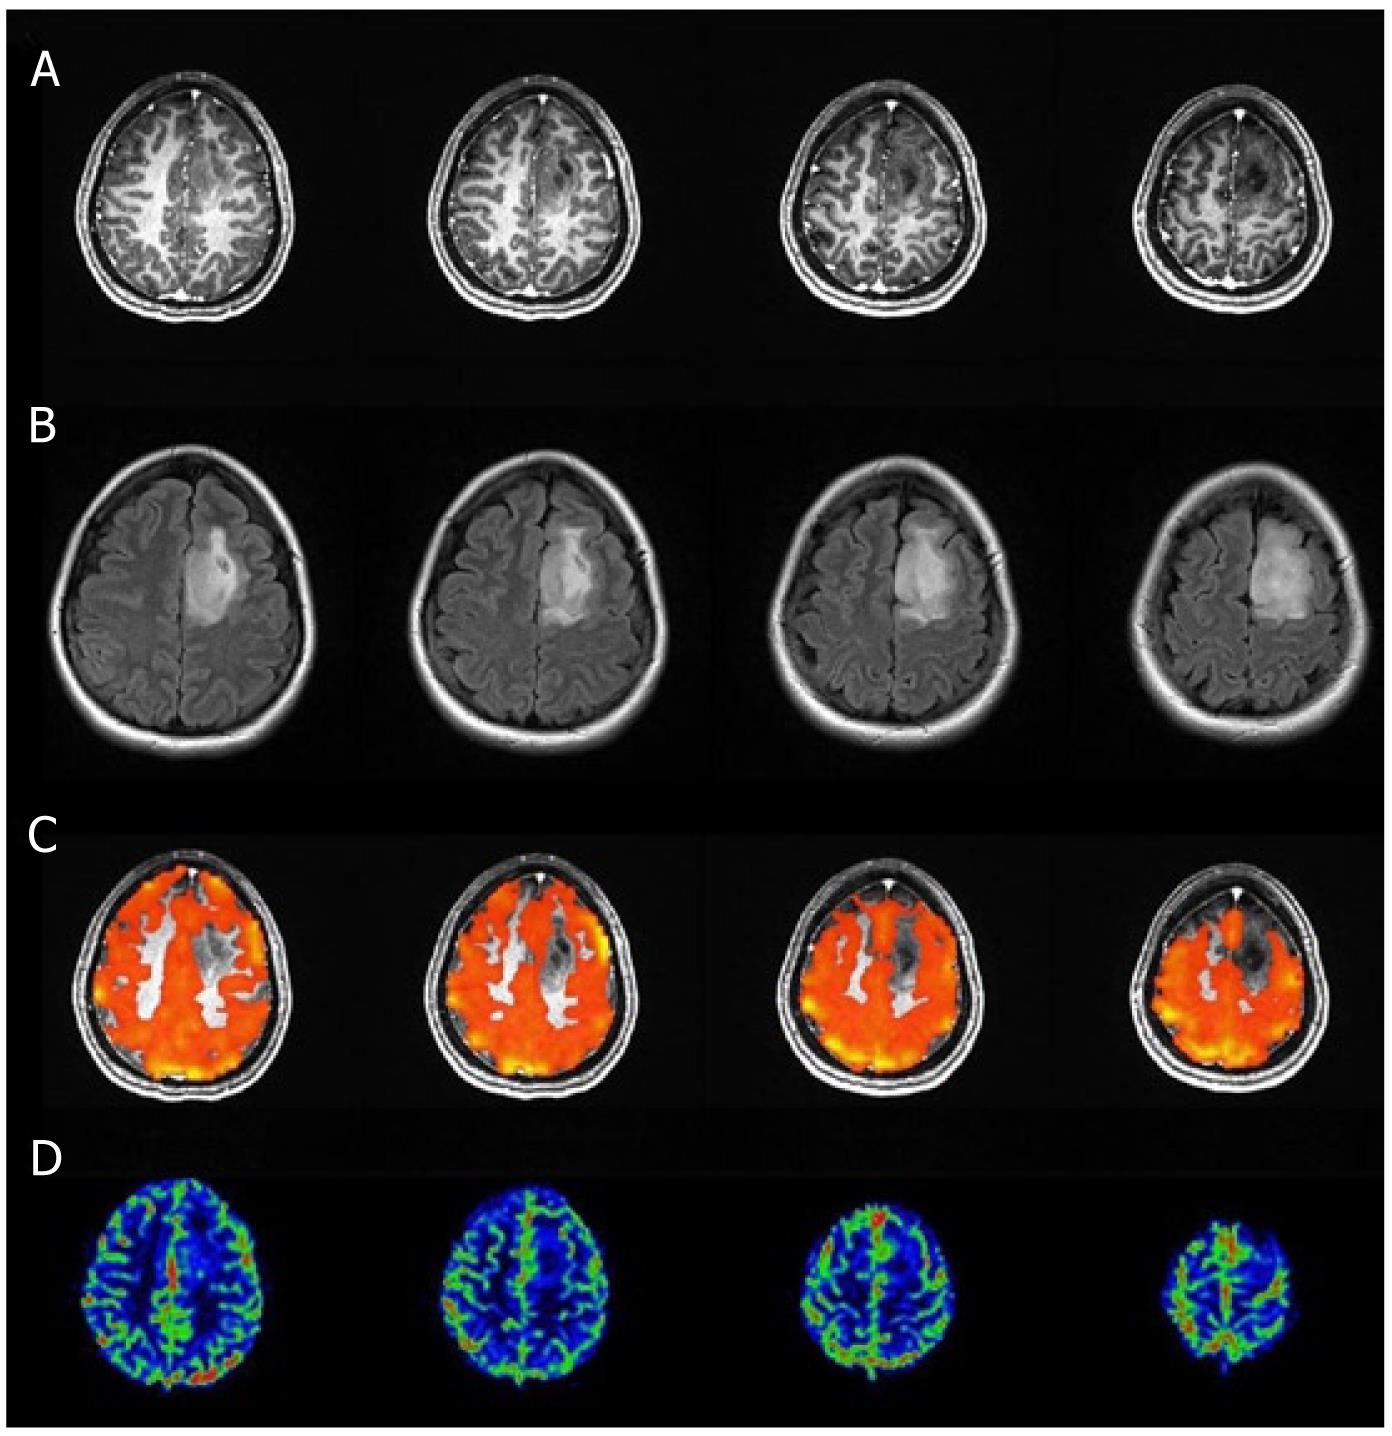
Figure 1 Axial T1 postcontrast 3D MPRAGE and T2 FLAIR images (A and B) breath-hold cerebrovascular reactivity maps (C) and relative cerebral blood flow maps (D) in a patient presenting with a left frontal lobe lesion, classified as grade II oligoastrocytoma after surgical resection, are displayed.
Breath-hold cerebrovascular reactivity (BH CVR) maps were fused with axial T1 post Gadolinium images, and the threshold was set to 0.35 for blood oxygen level dependent PSC. Decreased CVR is present within and at the anterosuperolateral margin of the lesion (involving the infiltrated cortex of the left superior frontal gyrus) relative to contralateral hemispheric normal tissue. This represents an area of tumor-induced neurovascular uncoupling. Perfusion imaging did not provide equivalent information because the same area does not demonstrate any definite regional perfusion abnormality.
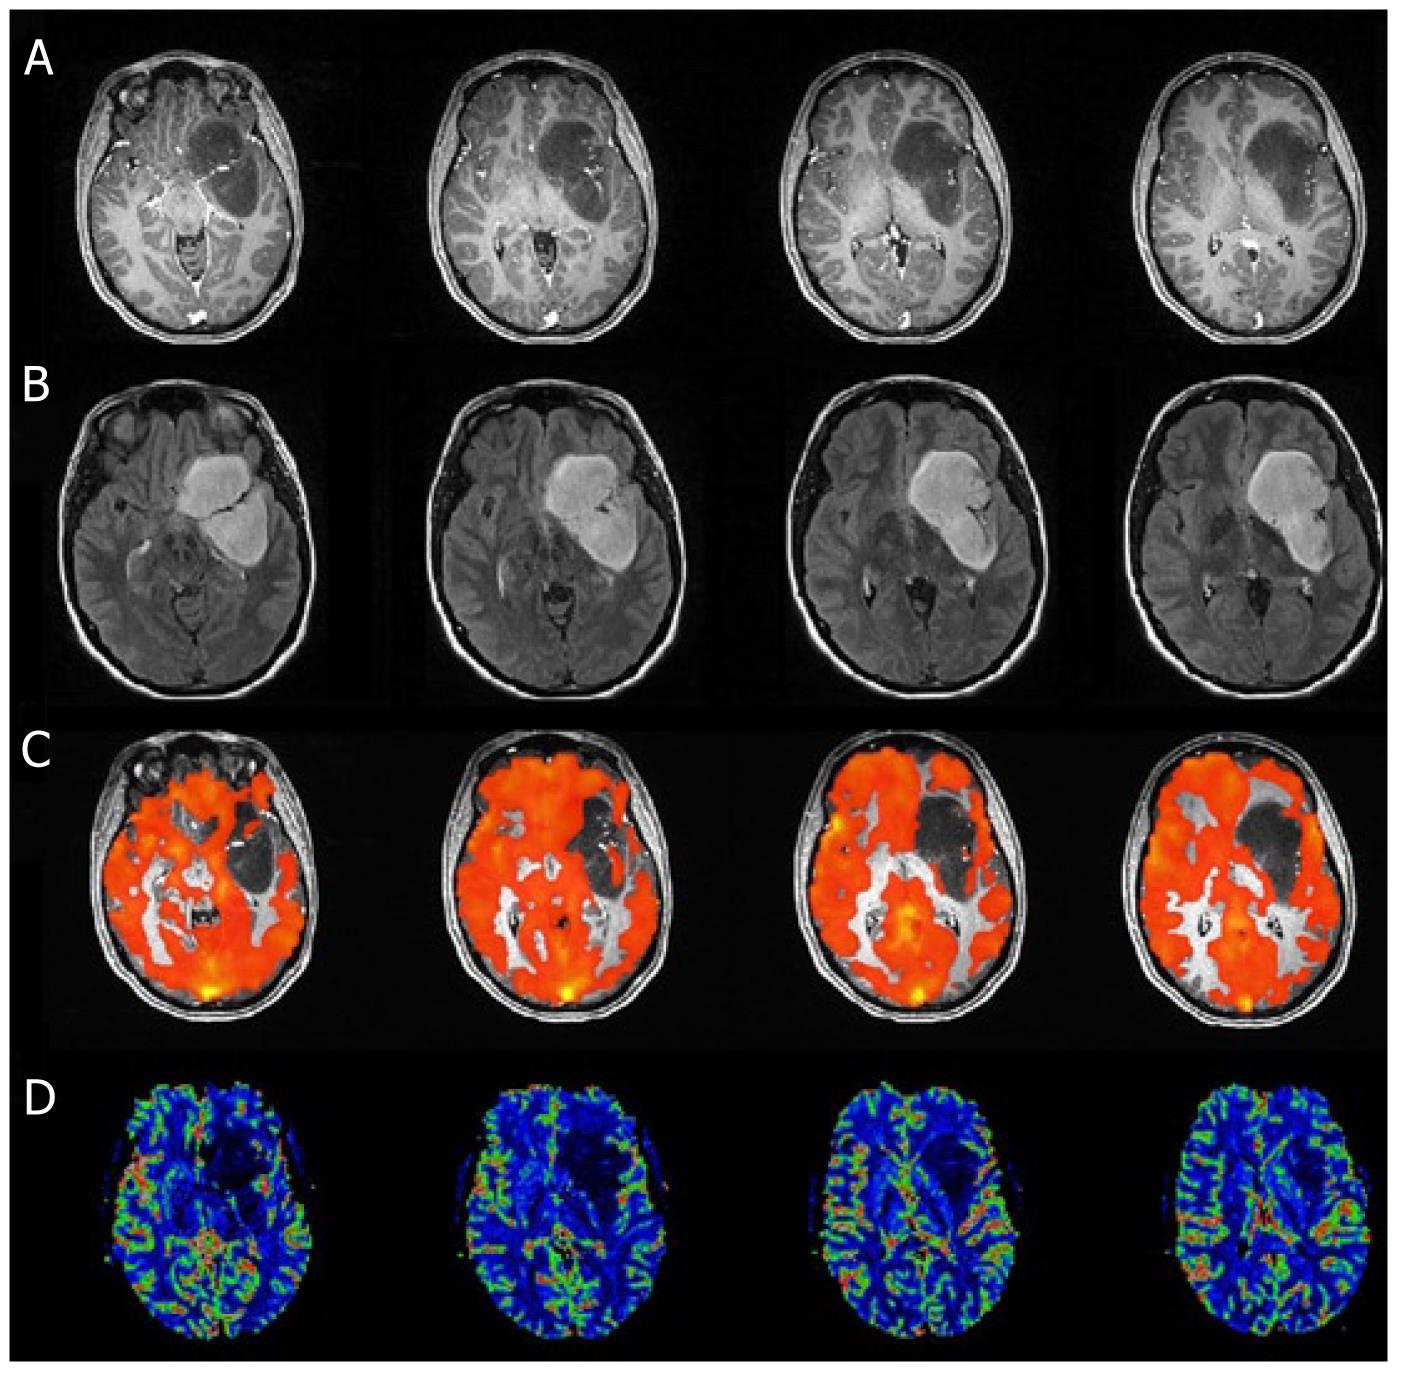
Figure 2 Axial T1 postcontrast 3D MPRAGE and T2 FLAIR images (A and B), breath-hold cerebrovascular reactivity maps (C) and relative cerebral blood flow maps (D) in a patient presenting with a left hemispheric lesion, classified as pilocytic grade I astrocytoma after surgical resection, are displayed.
Breath-hold cerebrovascular reactivity (BH CVR) maps were fused with axial T1 post Gadolinium images, and the threshold was set to 0.45 for blood oxygen level dependent PSC. Decreased CVR is present within the lateral margin of the lesion (involving the adjacent cortex of the left superior temporal gyrus) relative to contralateral hemispheric normal tissue. This represents an area of tumor-induced neurovascular uncoupling. Perfusion imaging did not provide equivalent information because the same area does not demonstrate regional perfusion abnormality.
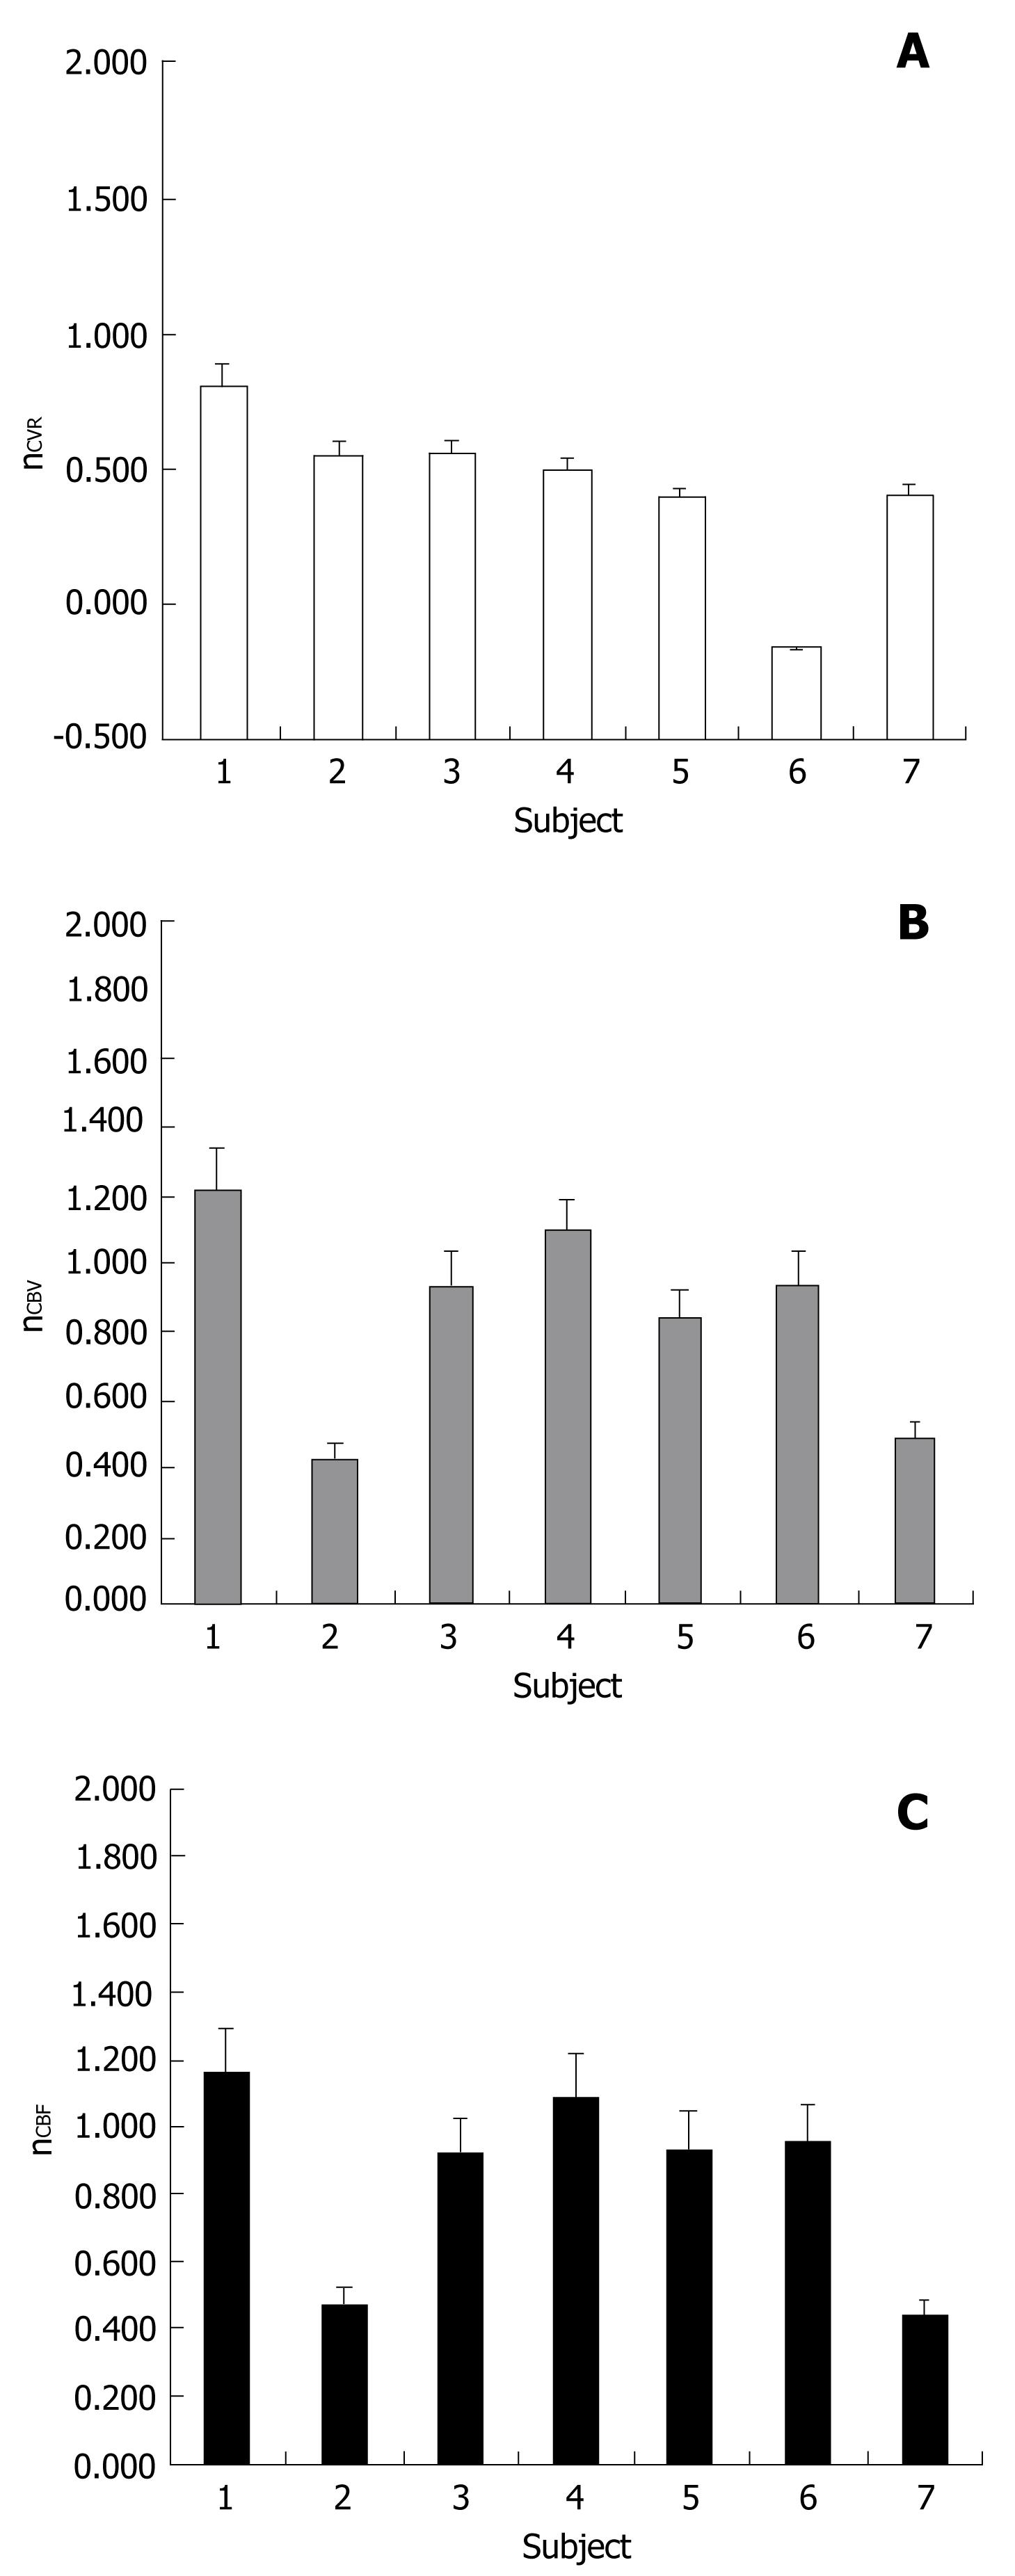
Figure 3 Cerebrovascular reactivity ratio (nCVR) (A) cerebral blood volume ratio (nCBV) (B) and cerebral blood flow ratio (nCBF) (C) distribution for the group of seven patients with classified grade I and grade II tumors included in this study.
In all cases nCVR is less than 1.0 and the median value is significantly less than 1.0 according to the one sample Wilcoxon test. nCBV and nCBF median values are not significantly lower or higher than 1.0.
Figure 4 Normalized relative cerebral blood volume ratio (nCBV) vs normalized cerebrovascular reactivity ratio (nCVR) (A) and normalized relative cerebral blood flow ratio (nCBF) vs normalized CVR ratio (nCVR) (B) in our cohort of low grade gliomas.
As described in the Methods section, these normalized ratios were calculated by dividing the mean voxel values obtained in ipsilesional regions of interest (ROIs) by those obtained in mirror contralesional ROIs. Neither nCBF nor nCBV demonstrated significant inverse correlation with nCVR in this LGG group. LGG: Low grade gliomas; CVR: Cerebrovascular reactivity
- Citation: Pillai JJ, Zacá D. Clinical utility of cerebrovascular reactivity mapping in patients with low grade gliomas. World J Clin Oncol 2011; 2(12): 397-403
- URL: https://www.wjgnet.com/2218-4333/full/v2/i12/397.htm
- DOI: https://dx.doi.org/10.5306/wjco.v2.i12.397


