Copyright
©2011 Baishideng Publishing Group Co.
World J Clin Oncol. Oct 10, 2011; 2(10): 339-343
Published online Oct 10, 2011. doi: 10.5306/wjco.v2.i10.339
Published online Oct 10, 2011. doi: 10.5306/wjco.v2.i10.339
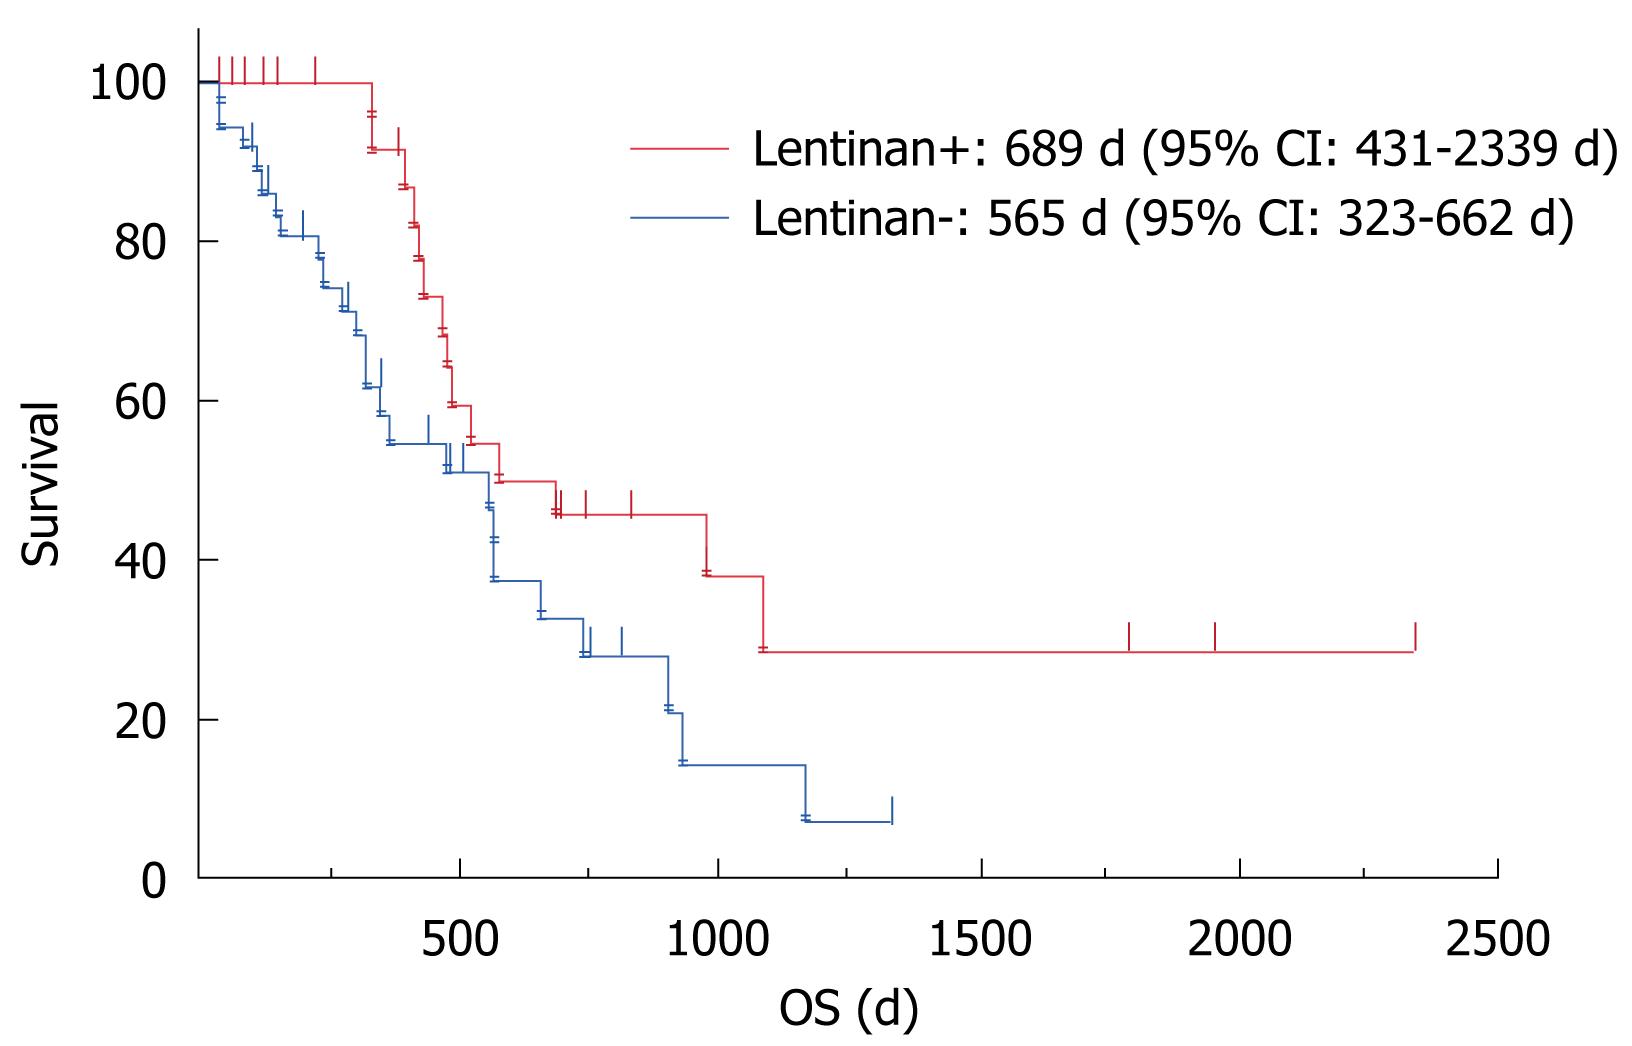
Figure 1 Kaplan-Meier curves of overall survival.
Lentinan+: The group that received chemo-immunotherapy with lentinan (n = 31); Lentinan-: The group that received S-1-based chemotherapy alone (n = 37). OS: Overall survival.
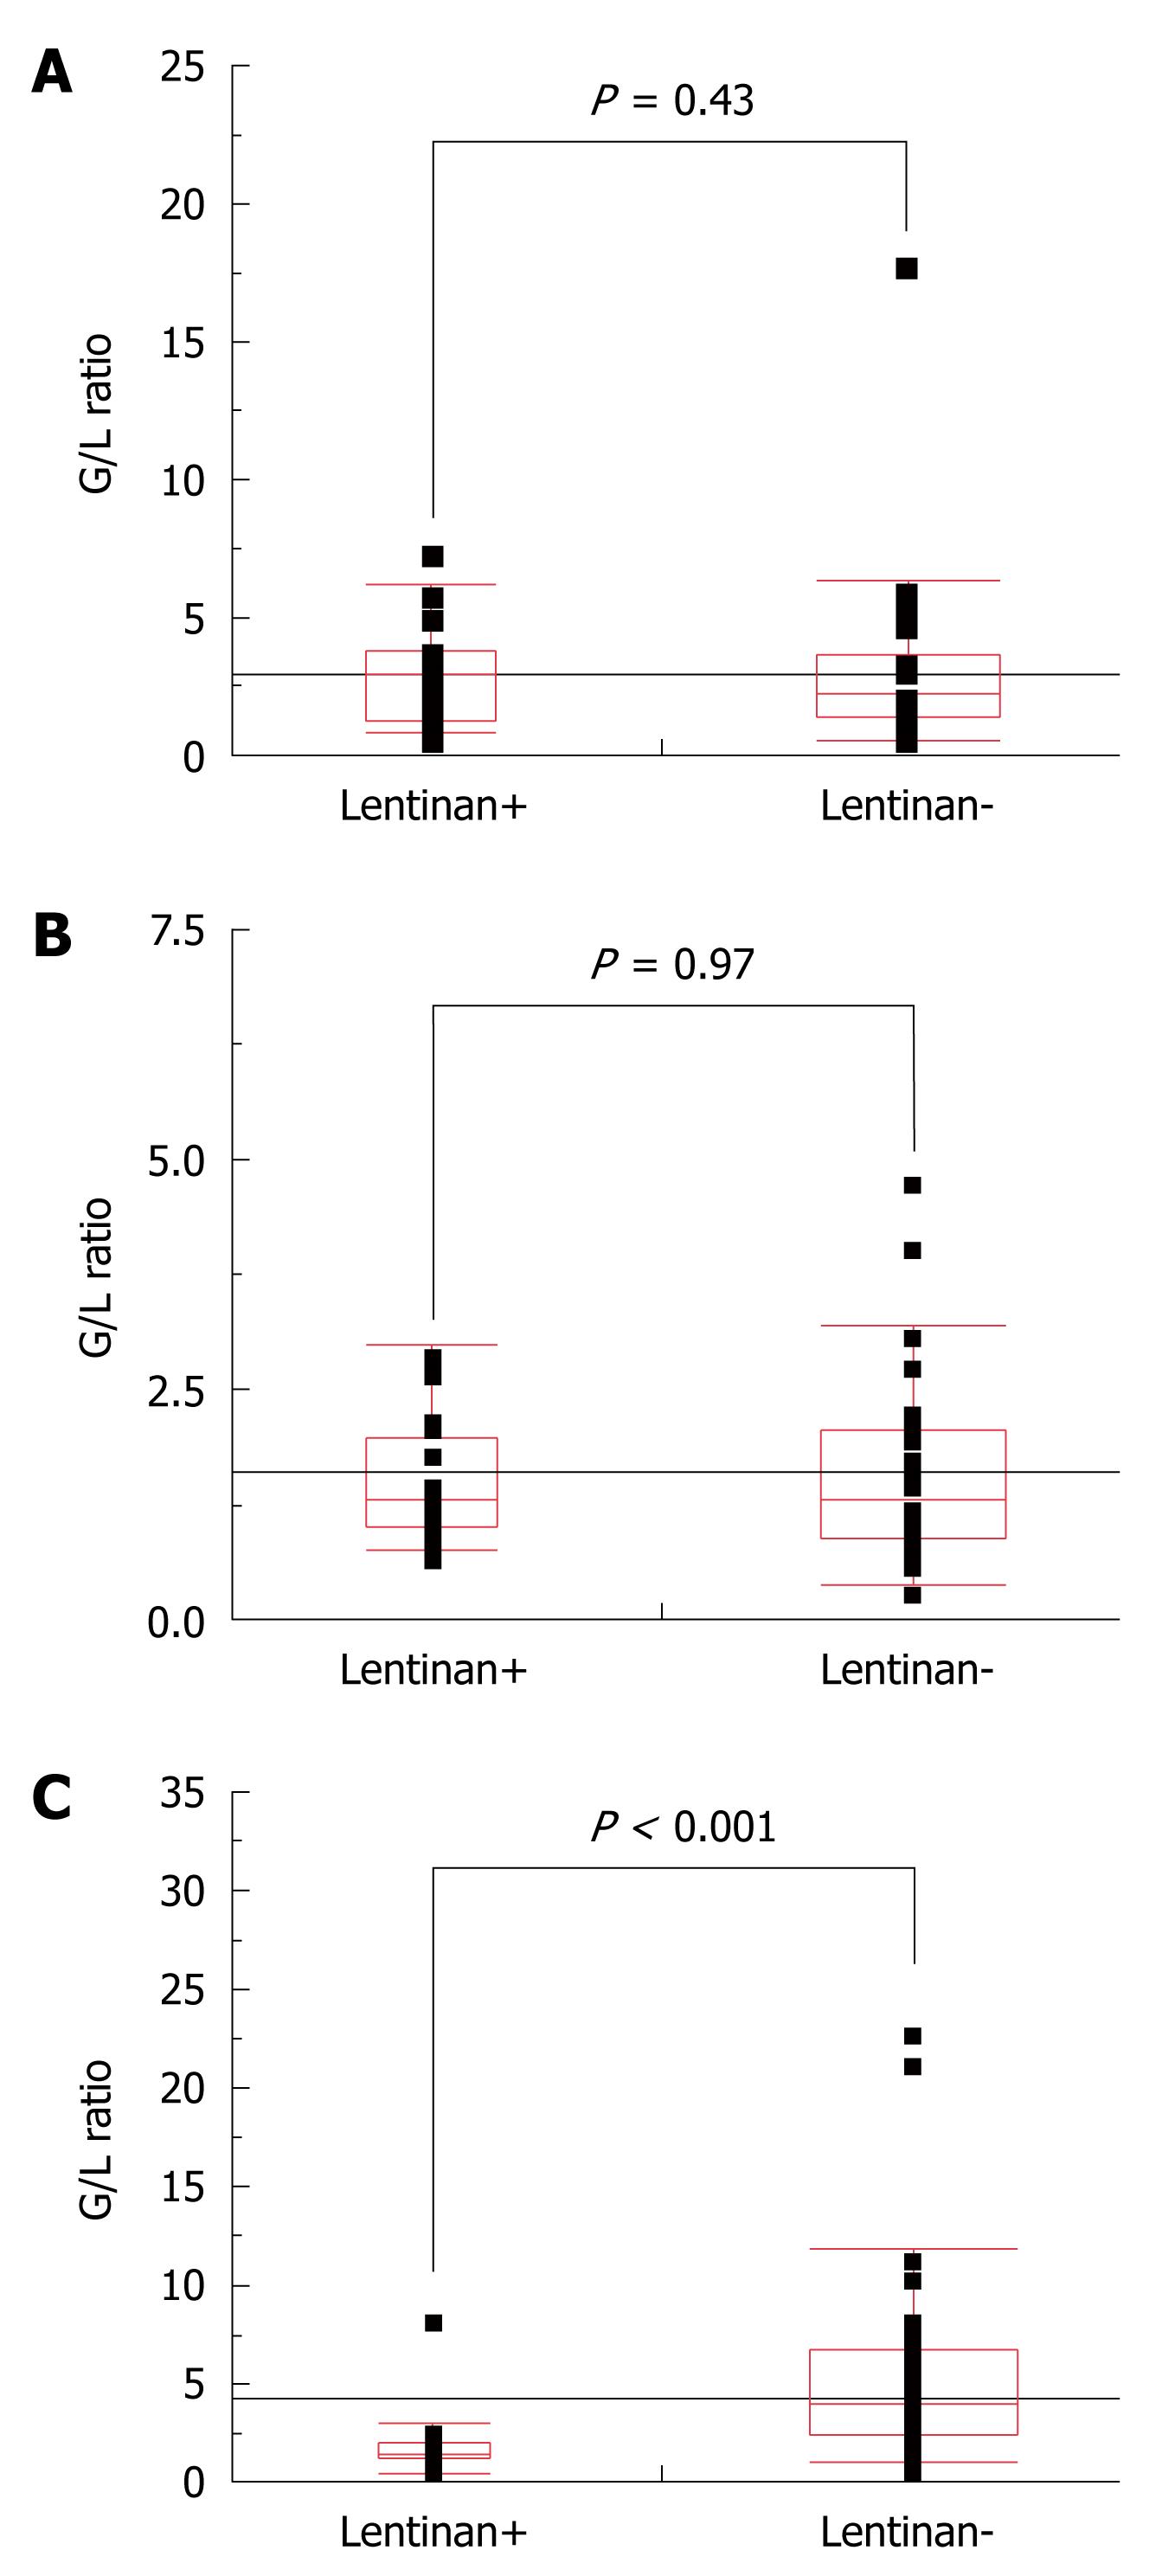
Figure 2 Comparison of the granulocyte/lymphocyte ratio between patients who did (Lentinan+) and those who did not receive lentinan (Lentinan-) using the χ2 test.
A: Before therapy; B: At 3 mo after initiation of the S-1-based chemothrapy; C: At either 1 year after initiation of the S-1-based chemotherapy or 1 mo prior to death (cases in which the survival time was < 1 year after chemotherapy). P values of less than 0.05 were considered statistically significant. G/L: Granulocyte/lymphocyte.
- Citation: Ina K, Furuta R, Kataoka T, Kayukawa S, Yoshida T, Miwa T, Yamamura Y, Takeuchi Y. Lentinan prolonged survival in patients with gastric cancer receiving S-1-based chemotherapy. World J Clin Oncol 2011; 2(10): 339-343
- URL: https://www.wjgnet.com/2218-4333/full/v2/i10/339.htm
- DOI: https://dx.doi.org/10.5306/wjco.v2.i10.339


